msRepeatFinder
Polymer Analysis Software
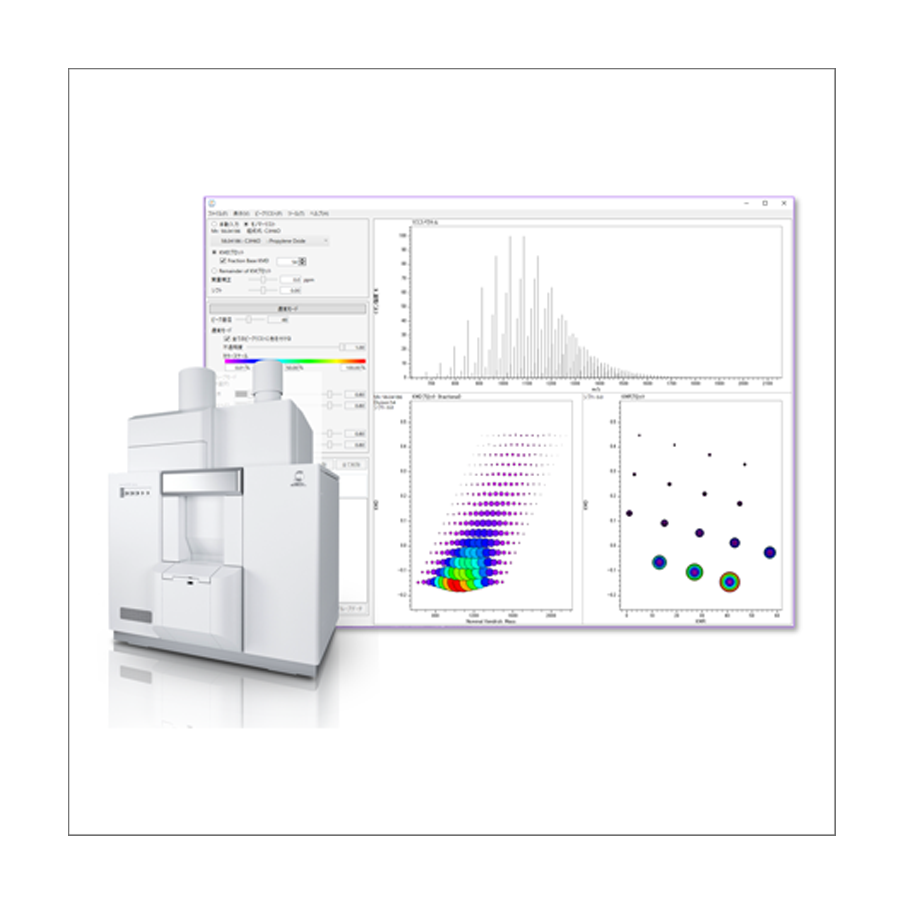
Definitive Polymer Analysis Software !!
Visualizes complicated mass spectral data and accelerates information sharing !
Features
Kendrick Mass Defect (KMD) analysis and its application to synthetic polymers
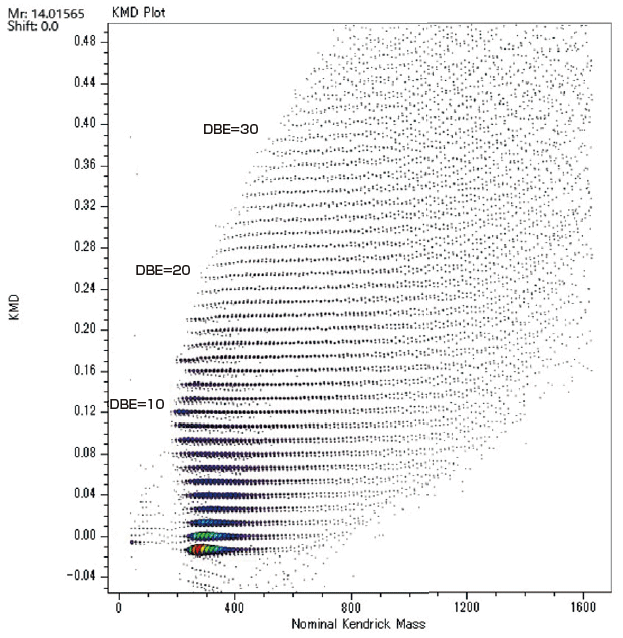
Kendrick Mass Defect (KMD) analysis is a method proposed by Edward Kendrick in 1963 [1] that is still used today in the petrochemical field. In mass spectrometry, an accurate mass obtained by a high resolution mass spectrometer uses a unit system with its mass of 12C being 12.0000 u, while Kendrick mass (KM) uses a unit system of CH2 = 14.00000. It is possible to classify the mass spectrum peaks of an extremely complex mixture mainly consisting of hydrocarbons, such as crude oil, according to the degree of unsaturation of the hydrocarbons and the presence or absence of heteroatoms.
The National Institute of Advanced Industrial Science and Technology (AIST) and JEOL Ltd. have succeeded in applying the principle of the Kendrick mass defect method to the analysis of high resolution mass spectra of polymers [2]. In this case, KM is defined so that the exact mass of the monomer, which is a repeating unit, is an integer. Creating a Kendrick Mass Defect (KMD) plot allows you to visualize the types and numbers of polymers in complex mass spectra without assigning individual mass spectrum peaks. Recently, the Fraction Base KMD method, Remainder of KM method, etc. have been proposed as related technologies that can be applied to the analysis of polymers over a wide mass range, and to the structural analysis of polymers by MS/MS. These KMD technologies not only shorten the time required for polymer analysis, but also facilitate information sharing.
[1] E. Kendrick, Anal. Chem. (1963) 35, 2146–2154.
[2] H. Sato et. al, J. Am. Soc. Mass Spectrom. (2014) 25, 1346-1355
How Polymers Appear on KMD Plot
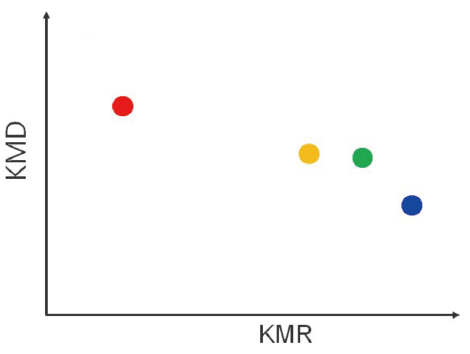
Understanding how polymers look on KMD and KMR (Kendrick Mass Remainder) plots will facilitate analysis. The horizontal axis of the KMD plot is the integer part of KM, or nominal KM, and the vertical axis is the KMD, which is the difference between the nominal KM and the KM. In KMD analysis, one monomer needs to be set first. The mass spectral peaks of the polymer composed of that monomer are aligned parallel to the horizontal axis on the KMD plot. Since the KMD value depends on the end group, in the case of a mixed sample of homopolymers with different end groups, multiple series arranged horizontally along the horizontal axis may be observed. KMR plots can be used for mixtures of homologous polymers with different end groups. The horizontal axis is the remainder of the nominal KM divided by the nominal mass of the monomer. Polymers with the same end group are aggregated at one point, and homopolymers with different end groups, which are difficult to distinguish on the KMD plot, can be easily identified.
KMD plot
A series consisting of the specified monomers is lined up parallel to the horizontal axis.
Visualization of polymer type / molecular weight distribution.
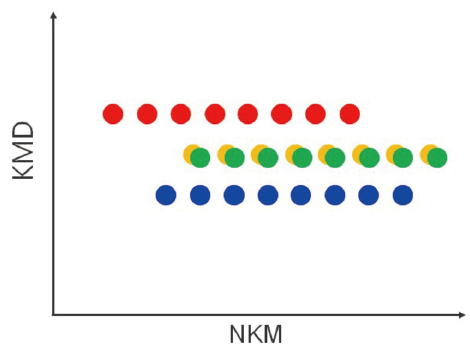
KMR plot
A series that consists from the same monomer and end groups is aggregated into a single point.
Series that are difficult to separate with a KMD plot can be identified.
Since the molecular weight distribution cannot be visualized, it is used in combination with a KMD plot.
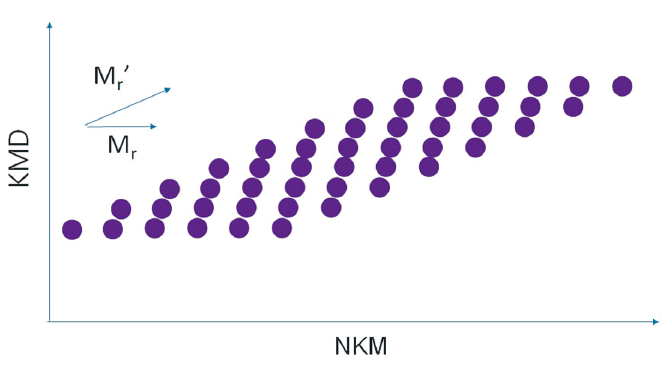
Polymers composed of monomers different from the specified monomer can be easily identified because they are arranged in diagonal straight lines on the KMD plot. For a copolymer, for example, in the case of a binary system, two types of monomers compose the constituting units. If one of them is specified, the distribution will be parallel to the horizontal axis, and the distribution of the other monomer will be diagonally arranged. Since each monomer has a distribution, it is visualized in the KMD plot as a grid of parallelograms.
For a mixture of different polymer species
When a certain monomer is specified, the polymers consisting of that monomer are lined up parallel to the horizontal axis, and the other polymers are lined up diagonally.
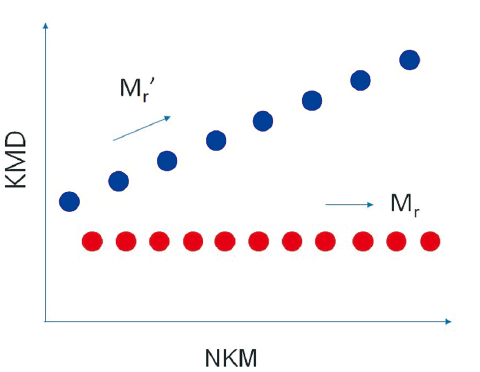
For binary copolymers
Since each of the two monomers has a distribution, a grid pattern is formed.
End-group analysis of polymers by using a high mass-resolution MALDI-TOFMS
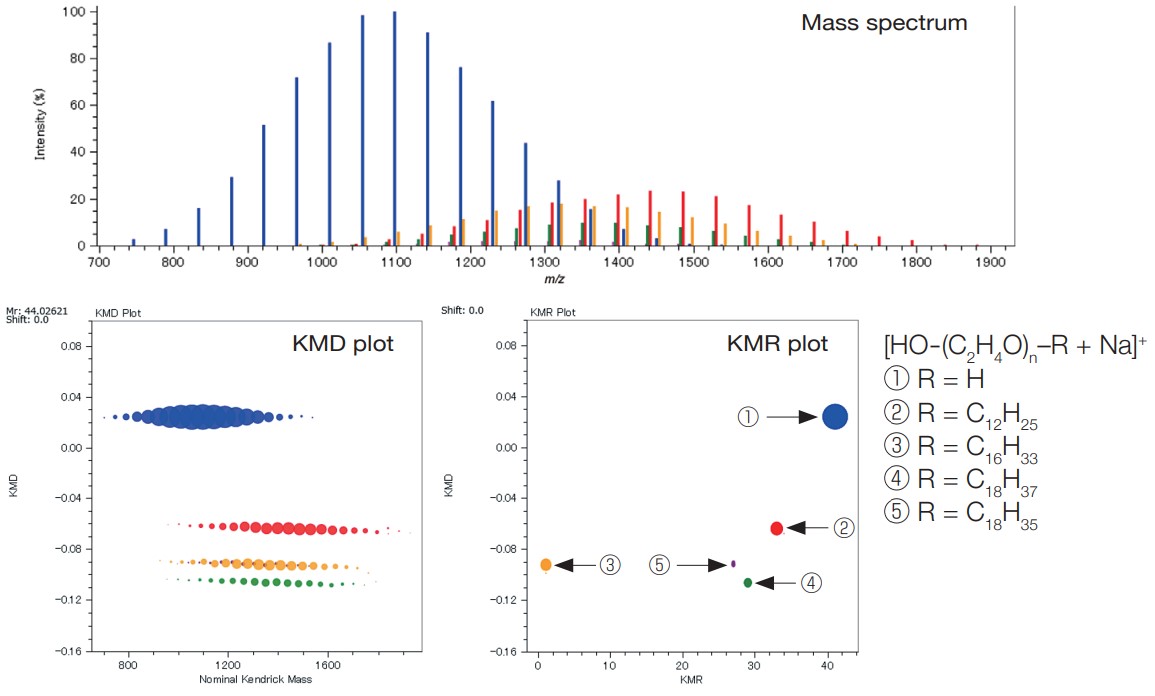
By applying the msRepeatFinder to the mass spectrum measured by the ultra-high mass-resolution MALDI-TOFMS, JMS-S3000 SpiralTOF™ series, mixtures of homopolymers with different end groups can be separated and grouped. It is also possible to search and group the points on the KMD plot by specifying the composition of the end groups. Relative ionic intensities and polymer index values are calculated for the grouped series as shown in the table.
In the example below, the KMD plot shows that there are at least four series with different end groups. By using the KMR (Kendrick Mass Remainder) plot, it is possible to confirm that there are actually five series.
MALDI mass spectrum, KMD plot and KMR plot of a polyethylene oxide mixture with different end groups
| Sum ofIntensities | Sum of Intensities (%) | No. average of molecular weight |
Weight average of molecular weight |
Dispersity | Monomer | End group α |
End group ω |
Adduct ion |
Charge | No. average degree of polymerization |
Weight average degree of polymerization |
Dispersity (degree of polymerization) |
|
|---|---|---|---|---|---|---|---|---|---|---|---|---|---|
| 1 | 826378 | 61.26 | 1092.769 | 1109.324 | 1.015 | C2H4O | H | OH | Na | 1 | 23.89 | 24.28 | 1.016 |
| 2 | 239802 | 17.78 | 1434.544 | 1453.005 | 1.013 | C2H4O | C12H25 | OH | Na | 1 | 27.832 | 28.323 | 1.018 |
| 3 | 174958 | 12.97 | 1347.449 | 1365.068 | 1.013 | C2H4O | C16H33 | OH | Na | 1 | 24.581 | 25.079 | 1.02 |
| 4 | 90119 | 6.68 | 1371.922 | 1387.459 | 1.011 | C2H4O | C18H37 | OH | Na | 1 | 24.5 | 24.949 | 1.018 |
| 5 | 17689 | 1.31 | 1280.546 | 1291.183 | 1.008 | C2H4O | C18H35 | OH | Na | 1 | 22.47 | 22.783 | 1.014 |
Elucidation of end-group structures from accurate mass measurement using ultra-high mass-resolution MALDI-TOFMS and MS/MS measurement (product ion mass spectrum)
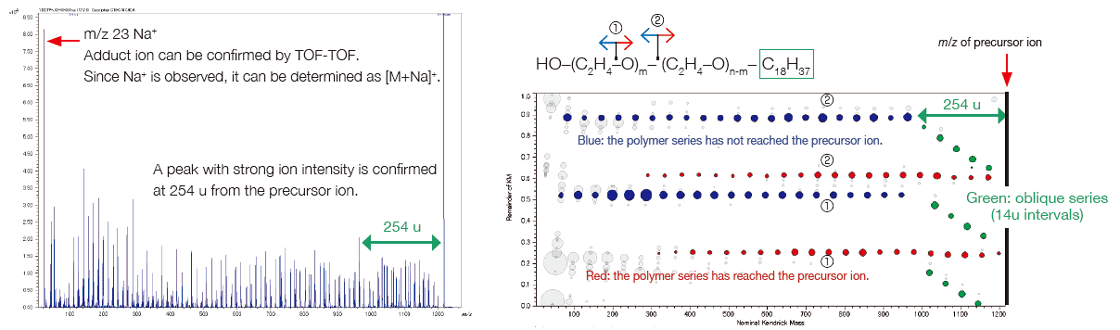
msRepeatFinder can determine the elemental composition of the ions from the measured accurate mass. The result obtained for the elemental composition of the end group for group ④ is shown. The 4 candidates have the same elemental composition, but different degrees of polymerization. The information obtained from the product ion mass spectrum is utilized to narrow down the candidates. When a peak at m/z 23 is observed in the product ion mass spectrum, the precursor ion is recognized as being an Na adduct ion. The characteristic neutral loss indicates that the size of one end group is about 254 u while that of the other is relatively small. As a result, we could estimate that it was the polyethylene oxide which has an end group of C18H37/OH.
| No. | End group composition formula | Monomer | n | Adduct ion | Mass | DBE | Mass error (modulus; mDa) |
Mass error (mDa) |
Mass error (modulus; ppm) |
Mass error (ppm) |
|---|---|---|---|---|---|---|---|---|---|---|
| ① | C16H34 | C2H4O | 22 | Na | 1217.83200 | -0.5 | 2.2767 | -2.2767 | 1.8695 | -1.8695 |
| ② | C18H38O | C2H4O | 21 | Na | 1217.83200 | -0.5 | 2.2767 | -2.2767 | 1.8695 | -1.8695 |
| ③ | C20H42O2 | C2H4O | 20 | Na | 1217.83200 | -0.5 | 2.2767 | -2.2767 | 1.8695 | -1.8695 |
| ④ | C22H46O3 | C2H4O | 19 | Na | 1217.83200 | -0.5 | 2.2767 | -2.2767 | 1.8695 | -1.8695 |
Product-ion mass spectrum and RKM plot of group ④
Analysis of copolymers by using a high resolution MALDI-TOFMS
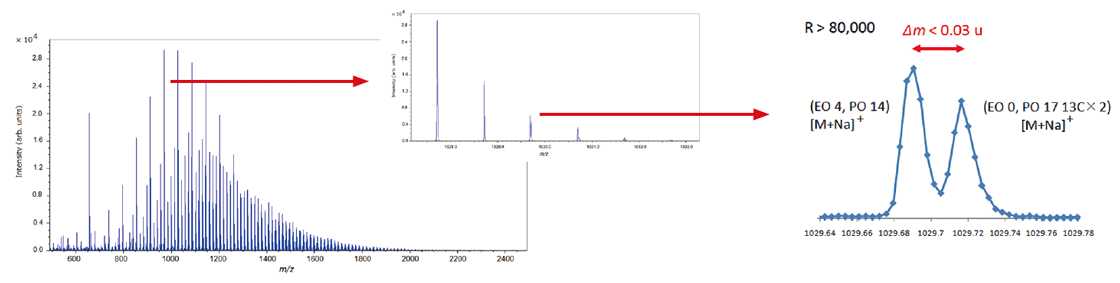
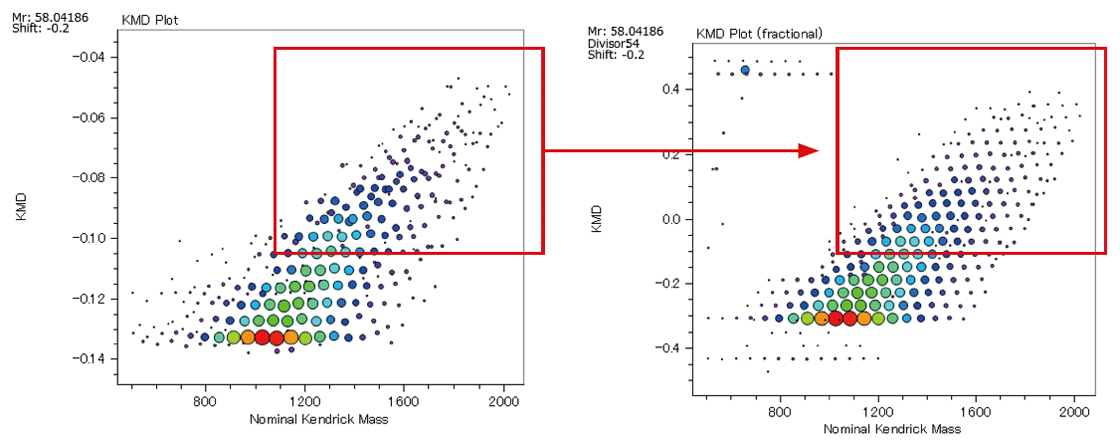
It is important to use high mass-resolution to analyze copolymers, which consist of two or more species of monomer. An ultra-high mass resolution MALDI-TOFMS can separate many isobaric ion peaks (which have the same nominal mass but different accurate mass) on a mass spectrum. Since the mass spectra of copolymers are complicated, it is not practical to assign the peaks one by one. KMD analysis using msRepeatFinder makes it possible to visualize the distribution of polymer species. Below is the analysis example of an EO-PO block copolymer. The enlarged mass spectrum shows that peaks that are less than 0.03 u apart are clearly separated by a high mass-resolution. Visualizing the mass spectrum using a KMD plot (base unit: PO), a lattice is seen reflecting the PO distribution on the horizontal axis and the EO distribution in a diagonal direction.
In addition, Fraction Base KMD plots provide a clearer visualization of the polymer series than conventional KMD plots.
Mass spectrum of EO-PO block copolymer
KMD plot (left) / Fraction base KMD plot (right)
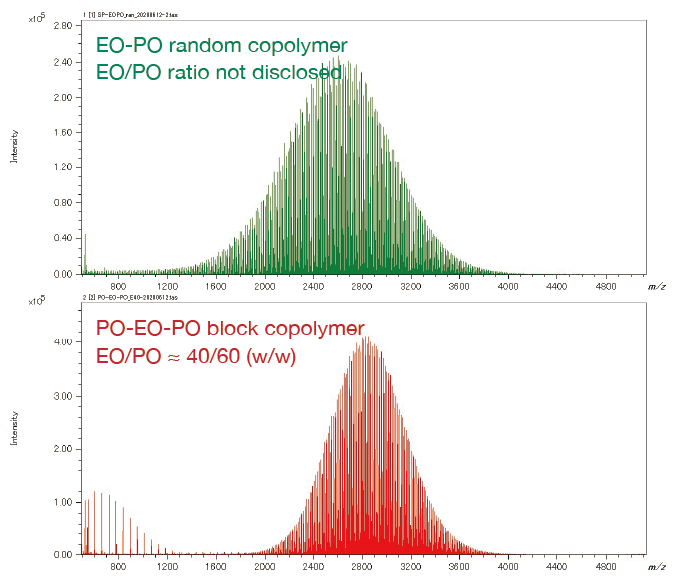
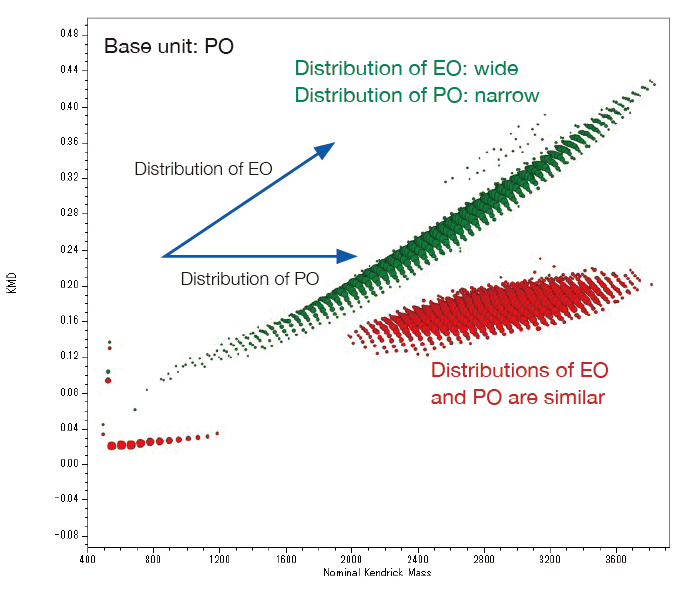
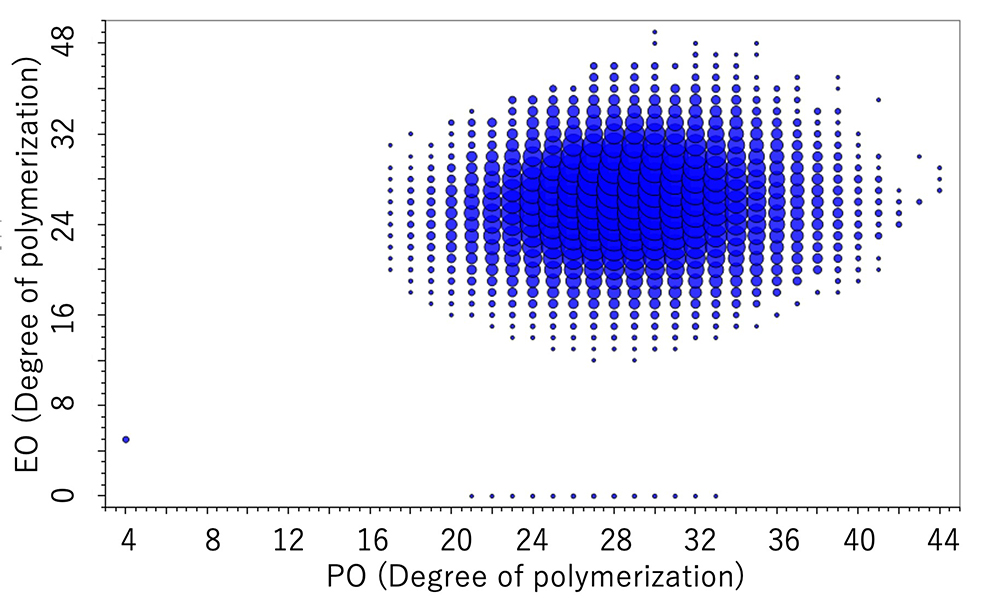
From the pattern on the KMD plot, it is possible to know the ratio of the two monomers contained in the binary copolymer, or the difference in the synthetic process of the copolymers. Below are the mass spectra and KMD plots (base unit: PO) of two EO-PO copolymers with approximately equal average molecular weights. A small amount of PO homopolymer was detected on the mass spectrum and the KMD plot of the PO-EO-PO block copolymer. This is considered to be one of the proofs that this sample is a block copolymer, as the residual EO or PO homopolymers in the randomly polymerized EO-PO copolymers are unlikely given the process of synthesizing the copolymers.
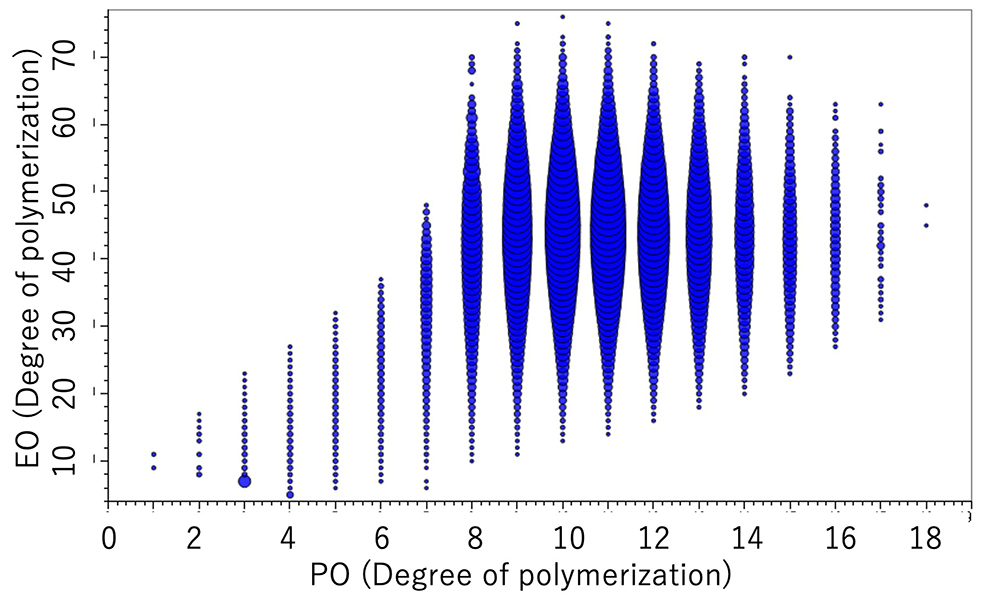
On the other hand, for the EO-PO random copolymer, the KMD plot shows that the numeric distribution of EO monomers is wide. In addition, by specifying the end groups, the DP (degree of polymerization) plot can be generated, and the molar ratio and weight ratio of EO and PO can be calculated. The weight ratio of the PO-EO-PO block copolymers are in good agreement with the published values. It is possible to estimate the EO/PO composition ratios of the EO/PO random copolymer whose EO/PO ratio is not disclosed.
Mass Spectra of EO-PO random copolymer and PO-EO-PO block copolymer
Overlaid KMD plot of EO-PO random copolymer and PO-EO-PO block copolymer
DP plot of the EO-PO random copolymer
| Molar ratio % | Wight ratio % | ||
|---|---|---|---|
| EO | PO | EO | PO |
| 79.8 | 20.2 | 75.0 | 25.0 |
DP plot of the EO-PO block copolymer
| Molar ratio % | Wight ratio % | ||
|---|---|---|---|
| EO | PO | EO | PO |
| 46.8 | 53.2 | 40.1 | 59.9 |
Search monomer unit
msRepeatFinder ver. 8 includes a new function to automatically search for monomer units from a mass spectrum. In the mass spectrum of a polymer, the mass diff erence between adjacent peaks corresponds to the mass of a monomer unit. This function extracts accurate mass diff erences that are frequently observed in mass spectra, and then automatically calculates the elemental compositions of the monomer units.
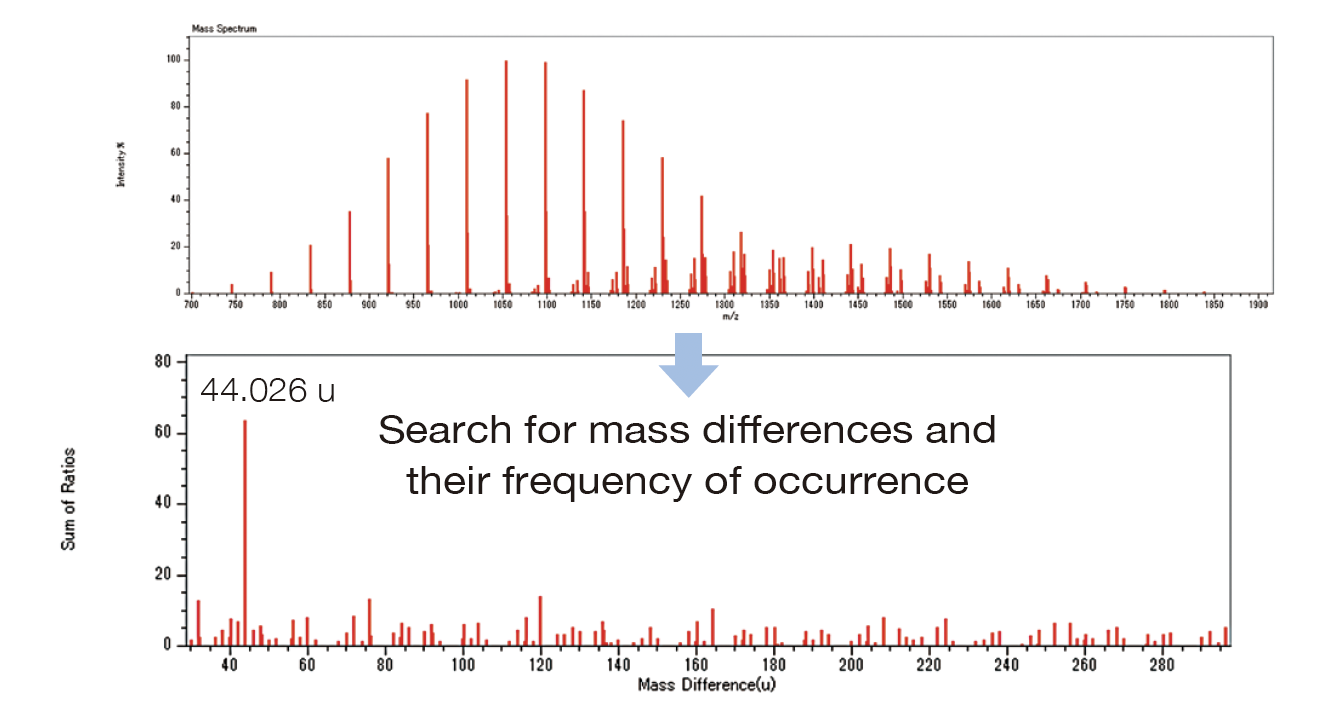
| Mass difference | 44.026 u |
|---|---|
| Sum of ratios | 63.389 |
| Molecular formula | C2H4O |
| Monomer list | Ethylene Oxide |
| Number of peaks | 100 |
| Average ion intensity | 13501.340 |
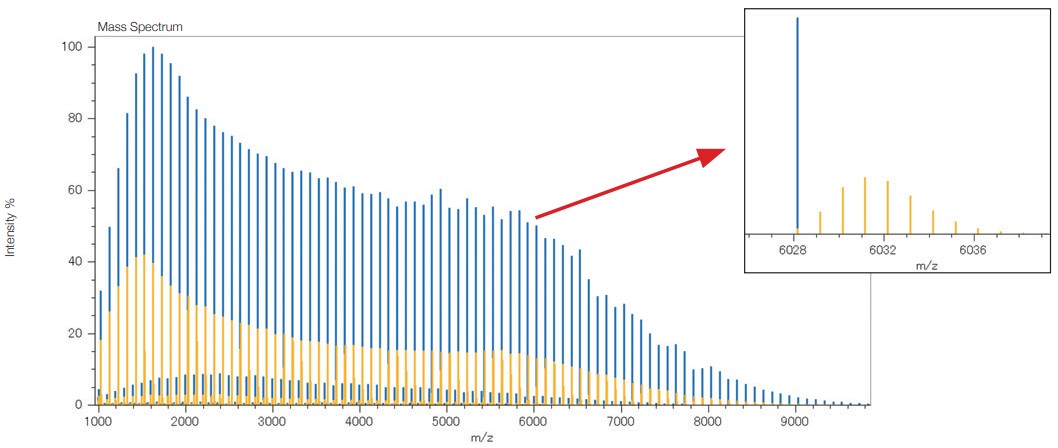
Deisotope
Deisotoping function simplifies KMD, KMR, and RKM plots by aggregating the ionic intensities of isotopic peaks into monoisotopic peaks.
Furthermore, since the ion intensity is aggregated at the monoisotopic peak, the influence of differences in isotope patterns depending on molecular weight is eliminated, making it easier to intuitively understand the molecular weight distribution.
MALDI mass spectrum of a PMMA standard mixture
(Yellow: before deisotoping Blue: after deisotoping)
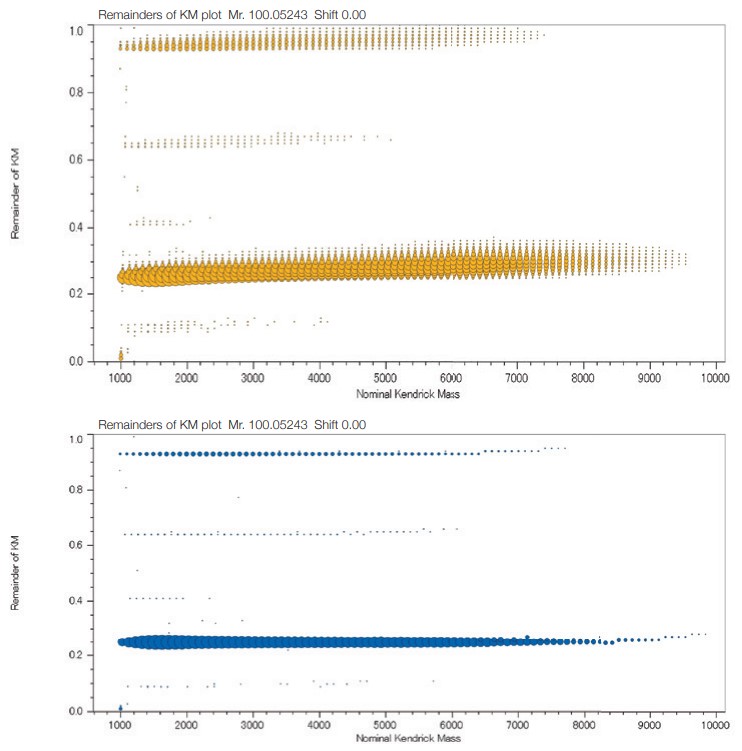
KMD plots of a PMMA standard mixture
(Top: before deisotoping Bottom: after deisotoping)
Differential analysis of 2 polymer samples
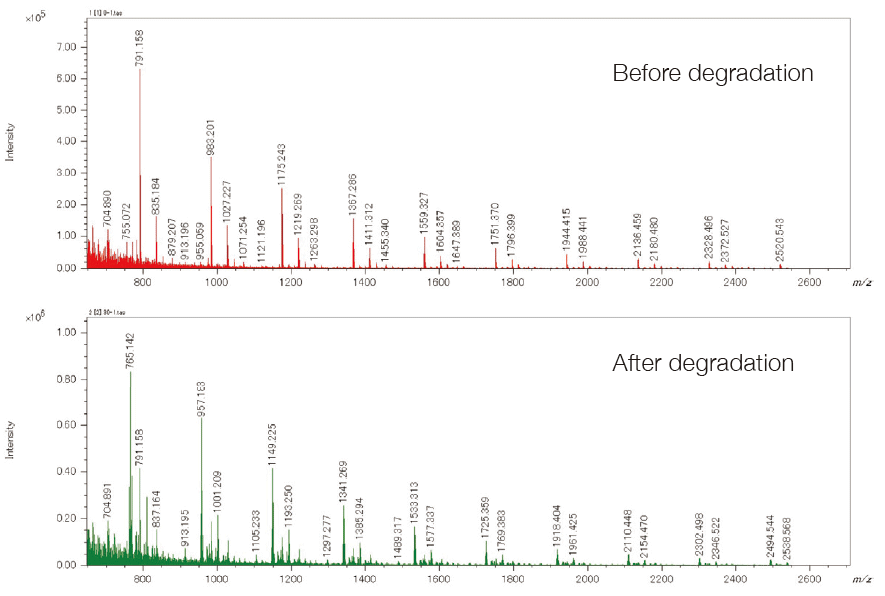
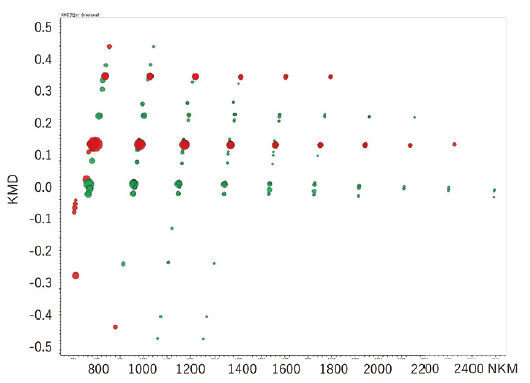
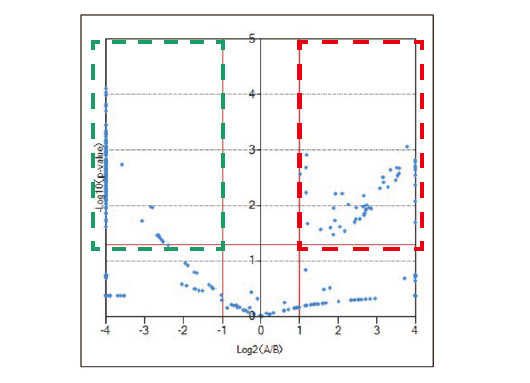
The differential analysis of the end groups and molecular weight distributions of polymer samples is very important for checking the degradation of a sample, the difference between production lots, and the difference in the synthesis processes. msRepeatFinder (optional) can perform the differential analysis of two samples. Below is an application example used for the degradation analysis of polyethylene terephthalate. The bottom left shows the mass spectrum before and after degradation. Before degradation, cyclic oligomers, and after the degradation, the series having the COOH/COOH end groups were observed as major components respectively. In performing differential analysis, each sample was measured three times. The bottom right is the result of the differential analysis shown in the KMD plots. The red shows stronger peaks before degradation, while the green shows the stronger peaks after the degradation. In addition, a volcano plot can be created to confirm the components that differ with statistical significance between the 2 samples.
Mass spectra of PET samples before and after degradation
KMD plot of differential analysis result
Volcano plot of differential analysis result
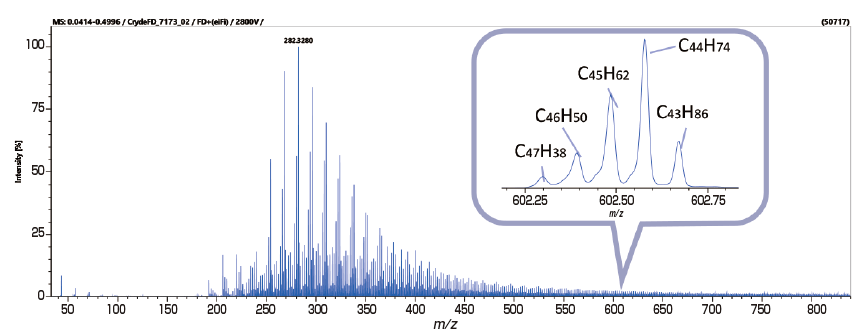
Analysis of Crude Oil with FD and KMD Analysis / Group-Type Analysis
msRepeatFinder is also applicable to KMD and group-type analyses of hydrocarbons. Below are the FD mass spectrum and the KMD plot of crude oil measured using the JMS-T2000GC AccuTOF™ GC-Alpha, a high-resolution GC-TOFMS equipped with an EI/FI/FD combination ion source. By visualizing the series of hydrocarbons with different degrees of unsaturation, each series can be easily grouped, and the following indicators are automatically calculated for each series.
Sum of intensities
Number average molecular weight
Weight average molecular weight
After visualizing the mass spectrum on the KMD plot, a detailed group-type analysis can be performed.
| No. | Formura | DBE | Sum of Intensities | Weighted Average of KMD |
Weighted Average of NKM |
Number Average molecular weitht (Mn) |
Weight Average molecular weitht (Mw) |
Polydispersity |
|---|---|---|---|---|---|---|---|---|
| 1 | CnH2n+2 | 0 | 2135838 | -0.013 | 309.9 | 310.2 | 318.7 | 1.03 |
| 2 | CnH2n | 1 | 1627964 | 0.001 | 333.9 | 334.2 | 349.6 | 1.05 |
| 3 | CnH2n-2 | 2 | 1070976 | 0.014 | 351.4 | 351.8 | 371.5 | 1.06 |
| 4 | CnH2n-4 | 3 | 677938 | 0.027 | 376.5 | 376.5 | 401.3 | 1.07 |
| 5 | CnH2n-6 | 4 | 943169 | 0.041 | 380.0 | 380.0 | 412.4 | 1.09 |
| 6 | CnH2n-8 | 5 | 870604 | 0.054 | 391.2 | 391.2 | 429.7 | 1.10 |
| 7 | CnH2n-10 | 6 | 706070 | 0.067 | 410.3 | 410.3 | 456.5 | 1.11 |
| 8 | CnH2n-12 | 7 | 694475 | 0.081 | 410.2 | 410.2 | 466.4 | 1.14 |
| 9 | CnH2n-14 | 8 | 764486 | 0.094 | 403.4 | 403.4 | 473.3 | 1.17 |
| 10 | CnH2n-16 | 9 | 710217 | 0.108 | 388.7 | 388.7 | 449.2 | 1.16 |
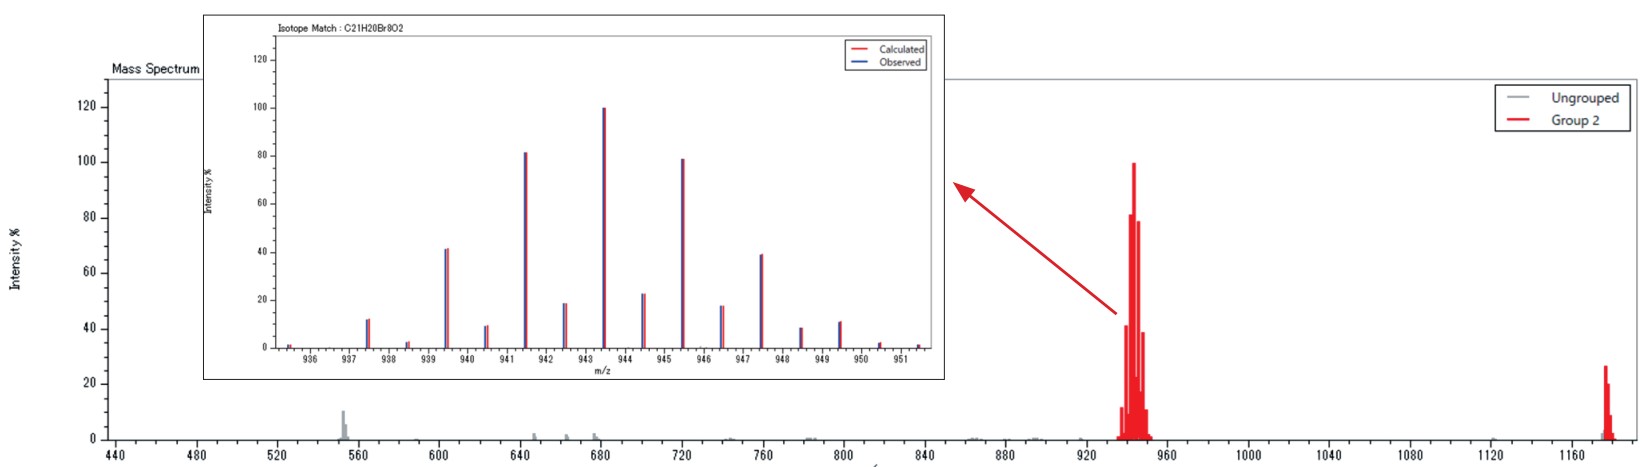
Identification of additives in polymers by FD (field desorption)
The compound list search function searches for the presence of compounds listed in a compound list using accurate mass and isotope pattern. A list of about 400 commonly used polymer additives is included. The example below shows the results of searching for polymer additives from the FD mass spectrum of a solvent extract of a commercial polypropylene product measured using a JMS-T2000GC AccuTOF™ GC-Alpha. A flame retardant (CAS No. 21850-44-2) and an antioxidant (CAS No. 6683-19-8) were found.
A compound list can be created by the user based on the molecular formula and some kind of ID (compound name, CAS No., etc.) of the compound to be searched.
| No. | Composition | Comment |
Calculated mass |
Observed mass |
Error(mDa) | Error(ppm) | Isotope matching score |
Isotope matching result |
|---|---|---|---|---|---|---|---|---|
| 8 | C21H20Br8O2 | Flame retardant (21850-44-2) |
943.4845 | 943.4794 | -5.1361 | -5.4438 | 0.98026 | Good |
| 10 | C73H108O12 | Antioxidant (6683-19-8) |
1176.784 | 1176.781 | -2.2204 | -1.8868 | 0.80855 | Good |
Functions
- Import peak lists (up to 10 lists at a time)
- Deisotope
- Search monomer units
- Display centroided (bar-graph) mass spectrum
- KMD plot
- Fraction base KMD plots
- KMR plots
- Remainder of KM (RKM) plot
- Estimated circles of homopolymer end groups (on KMR plots)
- Search polymer series
- Search homopolymer series and calculate average molecular weight (mass / degree of polymerization) and polydispersity (mass / degree of polymerization)
- Search polymer series in more than one peak lists at once
- Search binary copolymer, generate DP (degree of polymerization) plot, and calculate molar/weight ratio of 2 monomers.
- Grouping
- Color coded groups
- Enable/disable display of polymer series groups
- Calculating the average molecular weight/polydispersity of groups
- Relative ion intensity of each group with respect to the sum of the ion intensities of all groups
- Determination of elemental composition
- Elemental composition determination of monomers and end groups
- Elemental composition determination of end groups in more than one groups at once
- Saving history of elemental composition determination of end groups
- Differential analysis between two samples
- Compound List Search, elemental composition search, elemental composition determination of a single component
- Noise filtering by means of machine learning (for data acquired with JMS-S3000)
Remarks
Peak list input format: m/z and ion intensity.
The effectiveness of processed results is determined by the mass accuracy of the peak lists provided.
This program runs on Microsoft® Windows® 10 Pro (64bit), Windows® 11 Pro (64bit) or Windows® 11 IoT Enterprise.
For the PC, MS-57073PCE, MS-57075PCE or their equivalent is recommended.
Windows is a registered trademark or trademark of Microsoft Corporation in the U.S.A. and other countries.
Interview

INTERVIEW 11
I want to make a polymer visible
Hiroaki Sato: Ph.D.
Deputy Director, Research Institute for Sustainable Chemistry, National Institute of Advanced Industrial Science and Technology (AIST)
Dr. Sato has been closely accompanying the evolution of mass spectrometers for 30 years. By fully utilizing the state-of-the-art mass spectrometers, he has been clarifying what is happening in the world of polymers. The evaluation methods with his knowledge are about to give new strength to the chemical industry.
Catalogue Download
msRepeatFinder Polymer Analysis Software
Application
Application msRepeatFinder
Polymeric Materials Analysis by JEOL Mass Spectrometers - A Guidebook -
JMS-S3000 SpiralTOF™ series Polymer Mass Spectra Collection
JMS-S3000 SpiralTOF™ Series Polymers, Matrials, & Chemistry Applications Notebook
Related Products

JMS-T2000GC AccuTOF™ GC-Alpha 2.0 Gas Chromatograph - Time-of-Flight Mass Spectrometer
The ultimate GC-MS system that pursues the ultimate in performance and functionality, the JMS-T2000GC AccuTOF™ GC-Alpha, has evolved into version “2.0” with the integration of a fully automated standard sample inlet and msFineAnalysis AI.
We enable automated structure analysis of unknowns using three key technologies: high-performance TOFMS, soft ionization that generates molecular ions for vast majority of analytes, and AI-powered structure analysis.
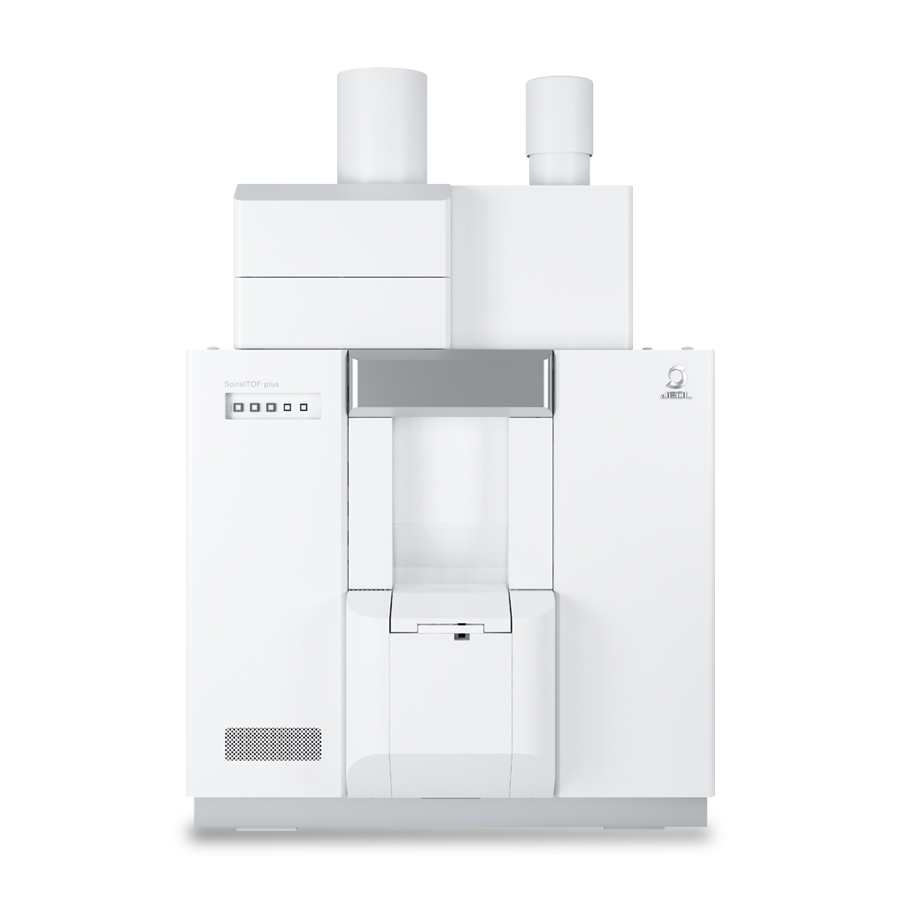
JMS-S3000 SpiralTOF™-plus 3.0 Polymer Analysis System
The combination of the JMS-S3000 SpiralTOF™-plus 3.0's high mass resolution, high mass accuracy, and wide dynamic range with the msRepeatFinder polymer analysis software makes it the most powerful polymer analysis system.
◆ Clicking the Play button starts the video (approx. 4 minutes).
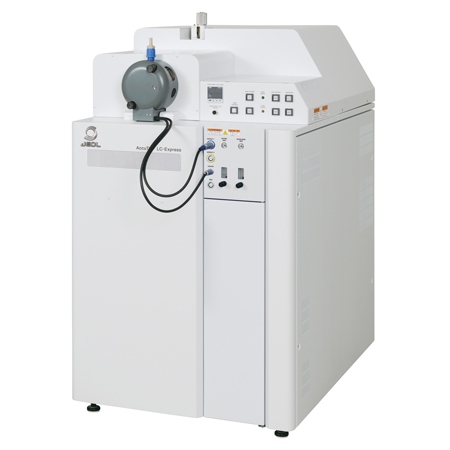
JMS-T100LP AccuTOF™ LC-Express Atmospheric pressure ionization high-resolution time-of-flight mass spectrometer
The AccuTOF™ LC-Express is the fourth generation of the successful AccuTOF™ LC series, a robust and easy-to-maintain, high-throughput mass spectrometer aiming for high productivity with multiple ionization methods.JEOL's unique ionization technology, DART™ (Direct Analysis in Real Time) can rapidly provide accurate mass information. It is also easy to replace the ion source with the electrospray ionization (ESI) source for LC/MS operation, or with ColdSpray ionization (CSI) source. Thus, the AccuTOF™ LC-Express can satisfy a variety of research needs in organic chemistry and material science.al Time)
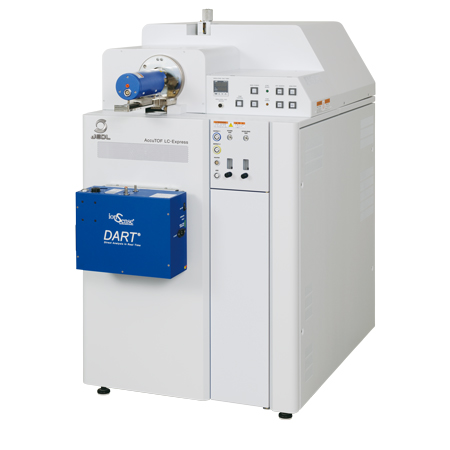
DART™ (Direct Analysis in Real Time)
DART™ (Direct Analysis in Real Time) is a new ion source that can analyze samples with various states and shapes without any sample preparation.
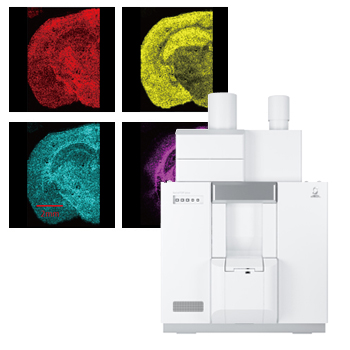
JMS-S3000 SpiralTOF™-plus 3.0 Mass Spectrometry Imaging System
MALDI MS imaging has expanded from proteins/peptides to small molecules such as lipids and pharmaceuticals, where matrix and surface interferences can obscure analyte signals in conventional MALDI-reflectron TOFMS. High mass-resolving power is key to reliable spatial mapping, making the SpiralTOF™-plus 3.0 indispensable for MALDI MS imaging.
◆Click the play button in the above box to watch the video. (2 min.)◆
Applications shown in the movie:
Distribution of lipids (phospholipids and fatty acids) in thyroid cancer tissues
Mass spectrometry imaging on mixed conductive/non-conductive substrate using JMS-S3000 SpiralTOF™
Other mass spectrometry imaging applications are here.
More Info
Are you a medical professional or personnel engaged in medical care?
No
Please be reminded that these pages are not intended to provide the general public with information about the products.