


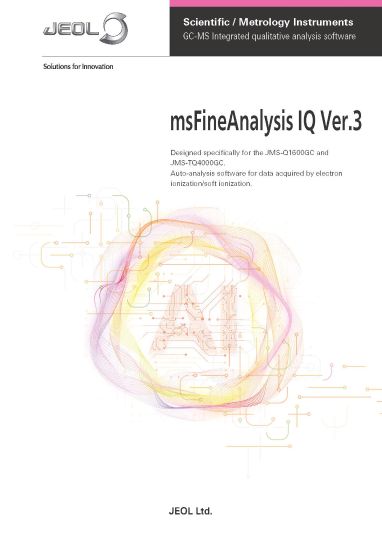
msFineAnalysis IQ
GC-QMS qualitative analysis software
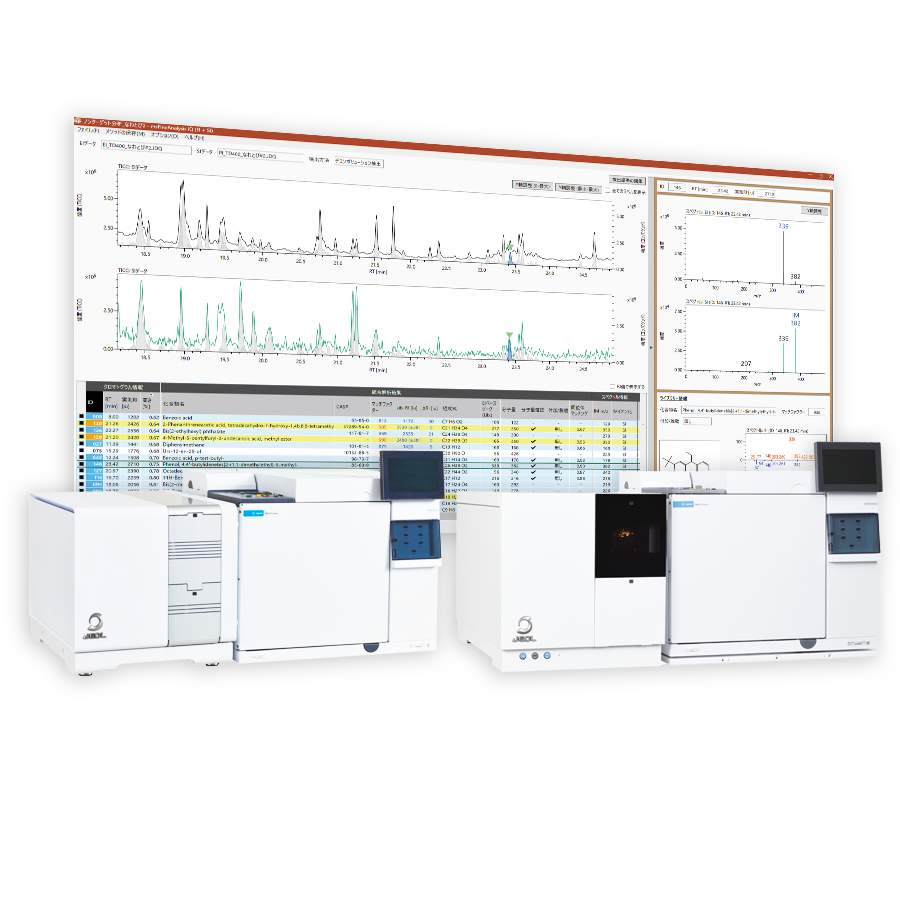
A Next‑Generation GC–QMS Qualitative Analysis Solution
Powered by Integrated Analysis and AI Structure Analysis!
Features
Soft Ionization and AI Transform GC‑MS Qualitative Analysis
From molecular ion acquisition to structure estimation, the entire workflow is fully automated.
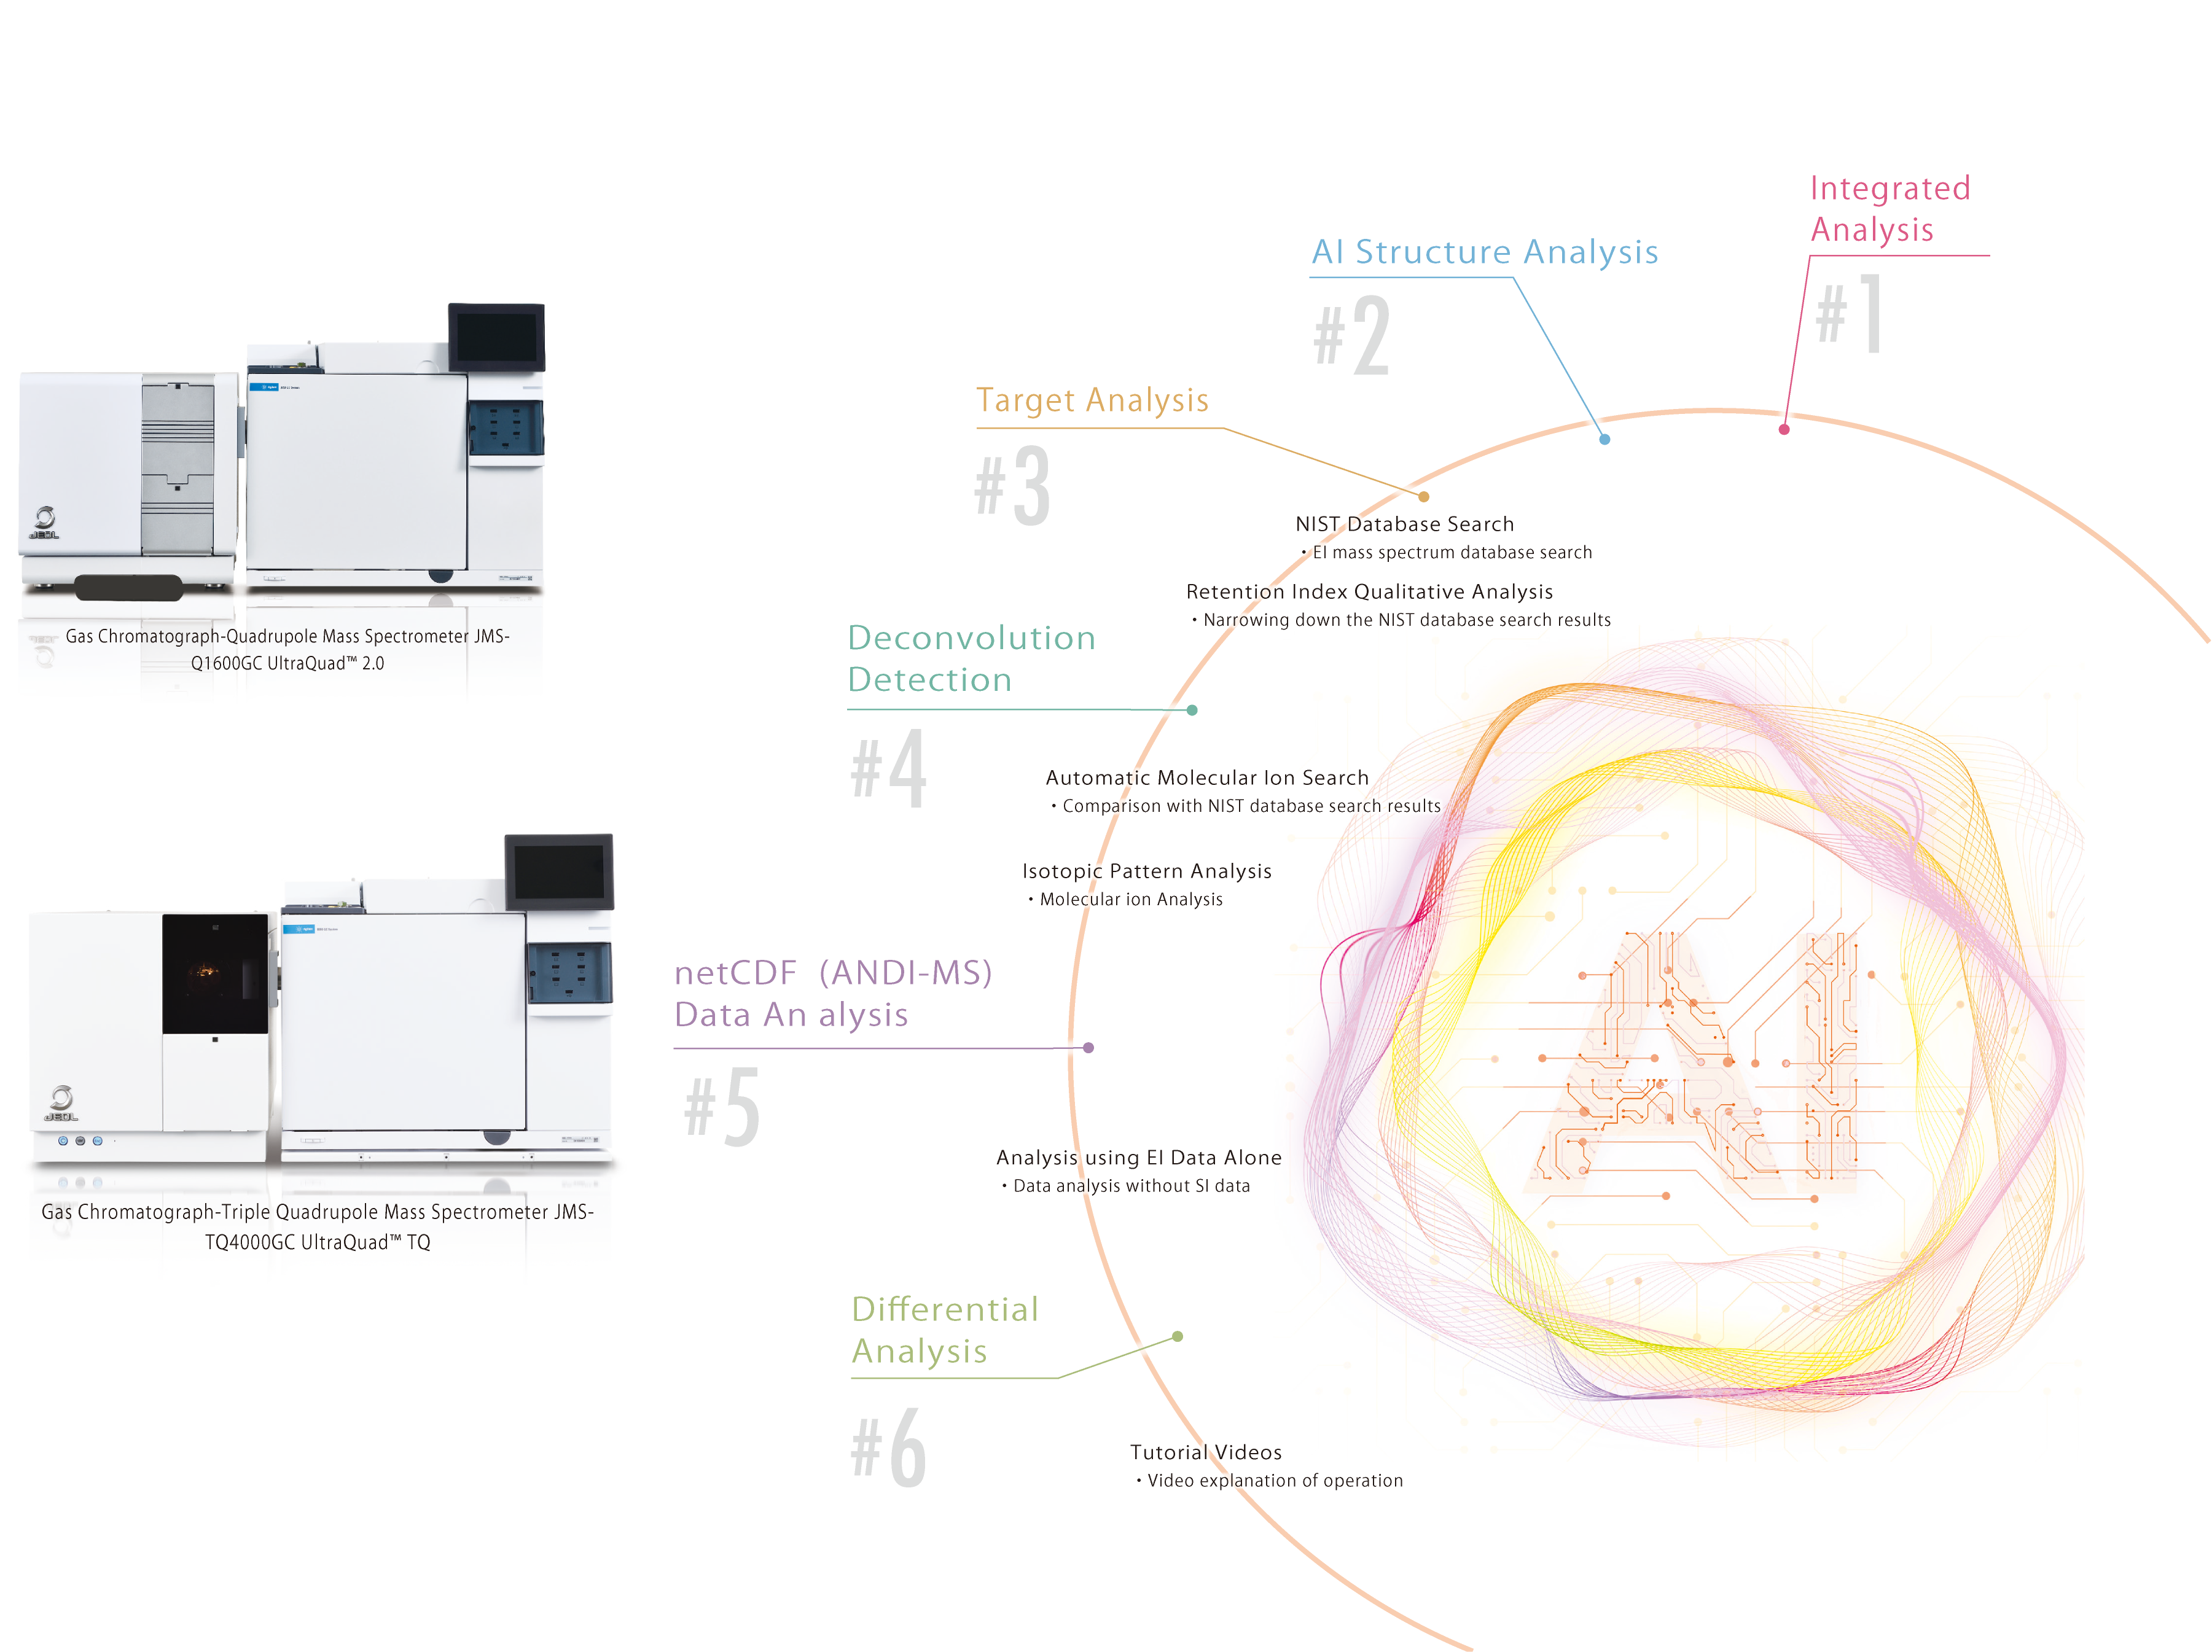
#1 Integrated Analysis
Break away from qualitative analysis based only on NIST database searches!
More reliable qualitative analysis is possible by “Integrated analysis”
We have consolidated the verification of soft ionization data, which previously required manual work and multiple software tools, into a single software platform and an integrated analysis workflow.
By automating the analysis process, the time required for qualitative analysis using soft ionization data is significantly reduced.
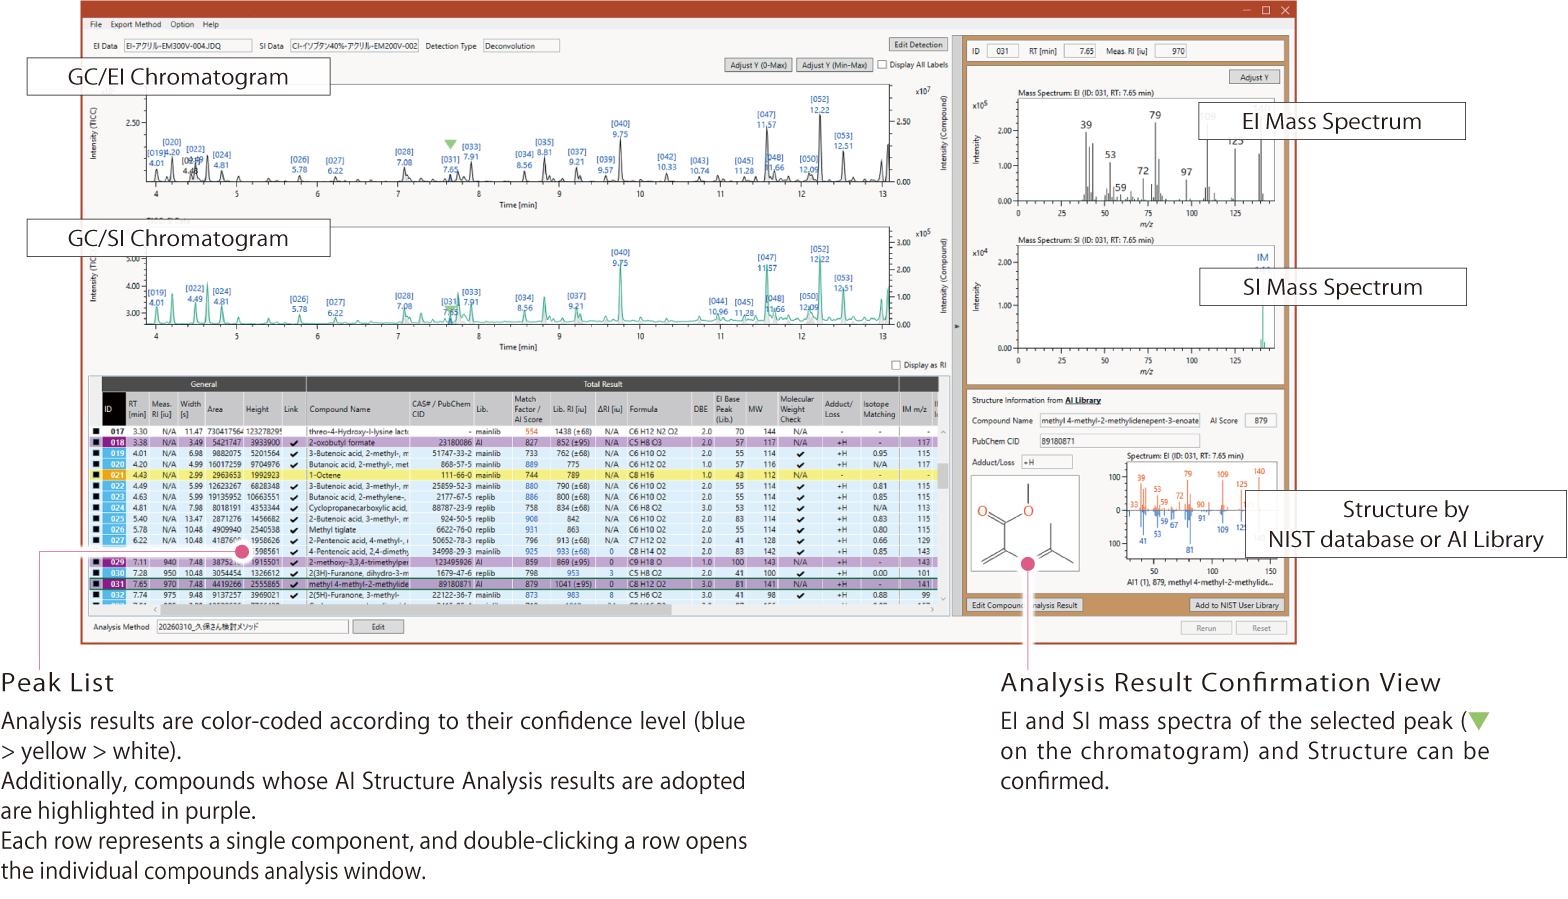
● Work Screen of Integrated Analysis Results
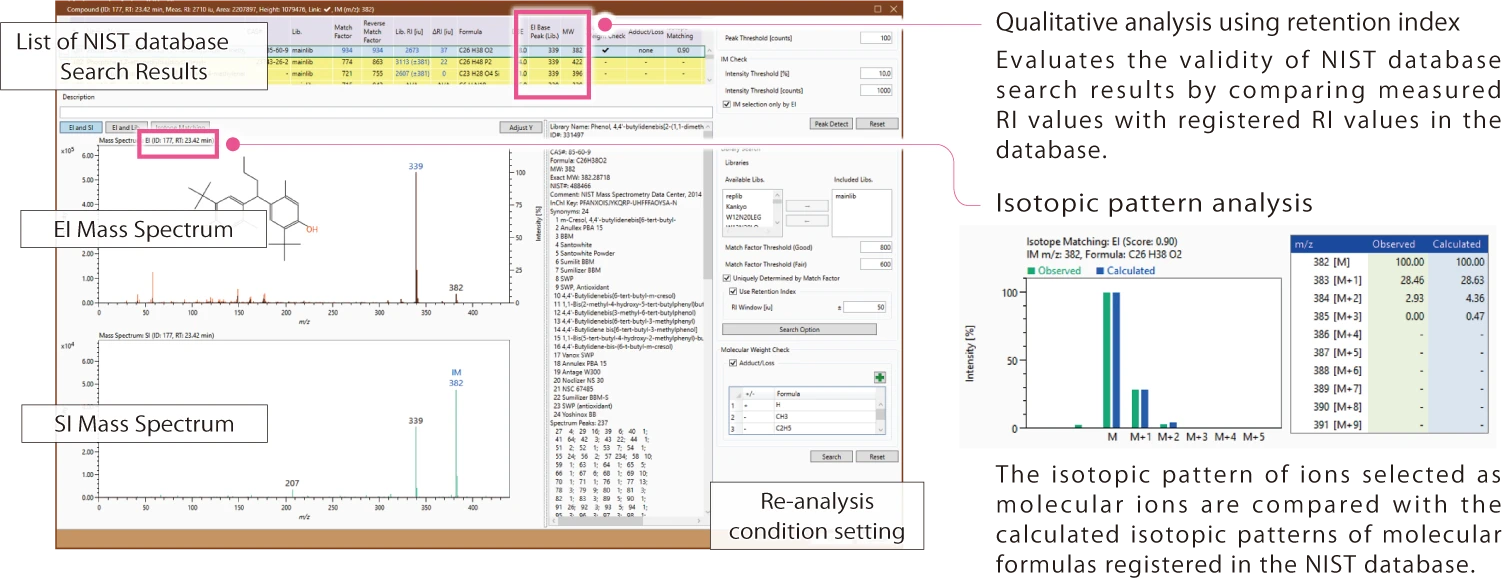
● Analysis Screen of Individual Compounds
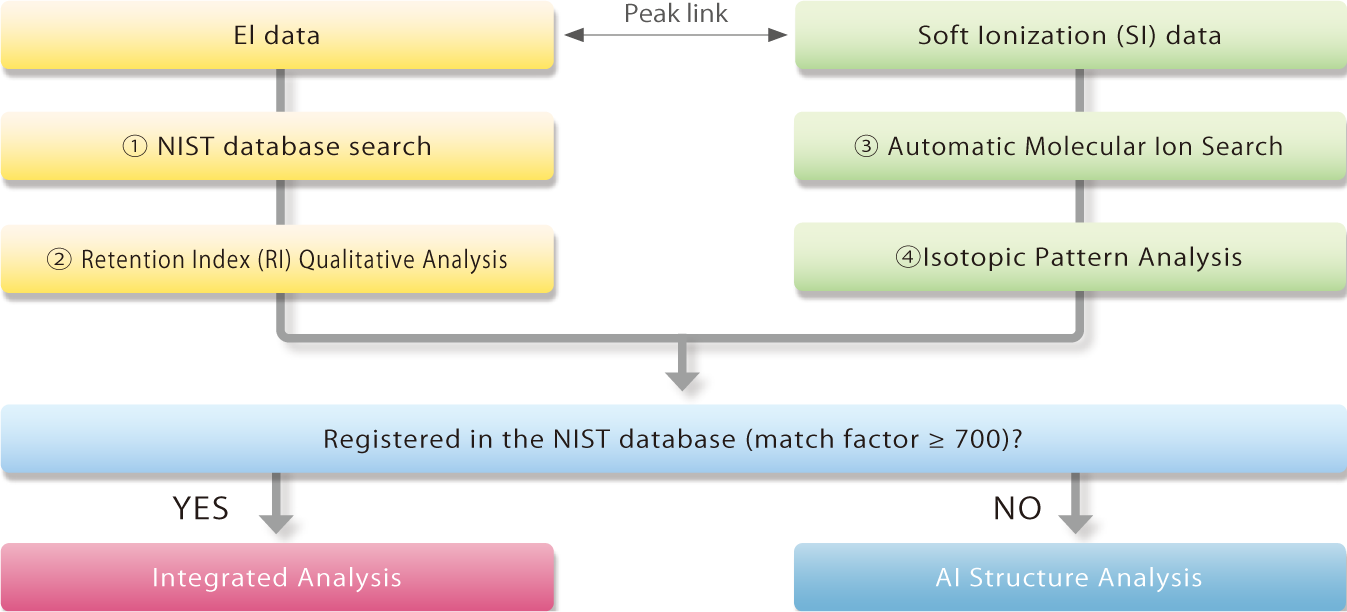
By combining retention index information with isotopic pattern analysis, the software provides qualitative analysis results with even higher confidence.
msFineAnalysis IQ Analysis Workflow
Integrated analysis provides more accurate results than qualitative analysis based solely on NIST database searches.
Even when NIST database searches do not yield strong candidates, AI structure analysis enables reliable structural estimation.
 Necessity of Soft-Ionization Data
The risk of qualitative analysis by EI library search alone…
Are you sure that the identification is correct?
In EI, the ionization energy is high, and molecular ions are sometimes not observed.
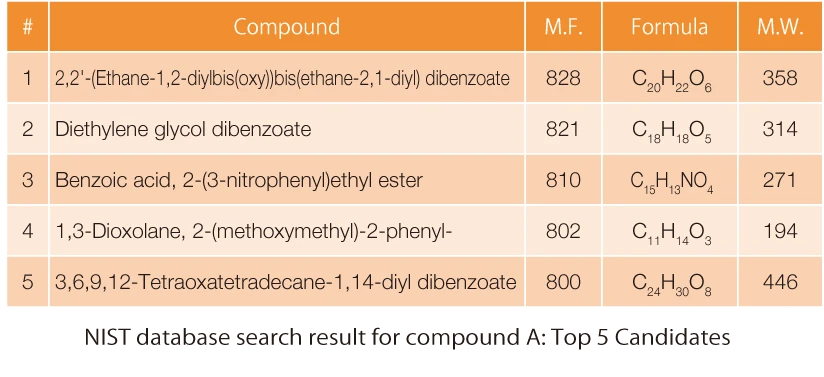
In the EI spectrum of component A (right figure), the molecular ion is also not detected.
Although multiple candidate compounds are obtained from the NIST database search, relying solely on EI data may lead to selecting the No. 1 candidate simply because it has the highest match factor.
In contrast, when component A is analyzed using a soft‑ionization (SI) method, a molecular ion at m/z 314 is clearly observed, indicating that the No. 2 candidate — with a molecular weight of 314 — is more plausible.
Qualitative analysis based only on EI data carries a risk of misidentification, whereas combining database searching with SI data analysis provides results with much higher confidence.
msFineAnalysis IQ automatically performs this type of qualitative analysis —“Integrated Analysis”— which combines EI and SI data.

#2 AI Structure Analysis
Qualitative analysis is possible even for compounds not registered in the NIST database!
AI structure analysis rapidly proposes structural candidates for unknown compounds.
We developed two types of AI models capable of predicting EI mass spectra and retention index values from chemical structures.
Using these models, we constructed a database (AI Library) containing approximately 200 million compounds, enabling qualitative analysis of compounds not registered in the NIST database
with an operation style similar to conventional NIST searches.
In msFineAnalysis IQ, AI structure analysis rapidly provides reliable structural candidates by narrowing down the possibilities using molecular‑weight information obtained from soft ionization data.
● Previous msFineAnalysis iQ
Soft ionization data provided qualitative information that complemented NIST database searches.

● Latest msFineAnalysis IQ
AI structure analysis makes it possible to estimate structures even for compounds not registered in the NIST database.
 High-Accuracy AI Model
The AI model used to predict mass spectra incorporates the technology developed through the creation of msFineAnalysis AI, a software for JEOL GC‑HRTOFMS, the JMS-T2000GC AccuTOFTM GC-Alpha 2.0.
The histogram below shows the cosine similarity between experimental and predicted mass spectra for 10,000 compounds used for evaluation.
In the previous AI model, the average cosine similarity was 0.72, whereas the latest model achieves an improved average of 0.86.

High-Accuracy AI Model for Structure Prediction
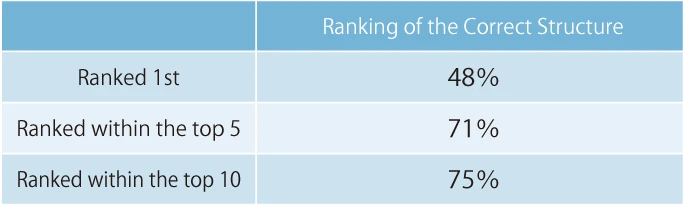
The table below shows the evaluation results for 10,000 compounds, assessing whether AI structure analysis presents the correct structure among the top candidates.
These results confirm that the method provides excellent structural prediction performance.
Qualitative Analysis of Pyrolysis Products of Acrylic Resin Using Py‑GC‑QMS
Obtaining reference standards for polymer pyrolysis products is often difficult, and dimers and trimers in particular are frequently not registered in the NIST database.
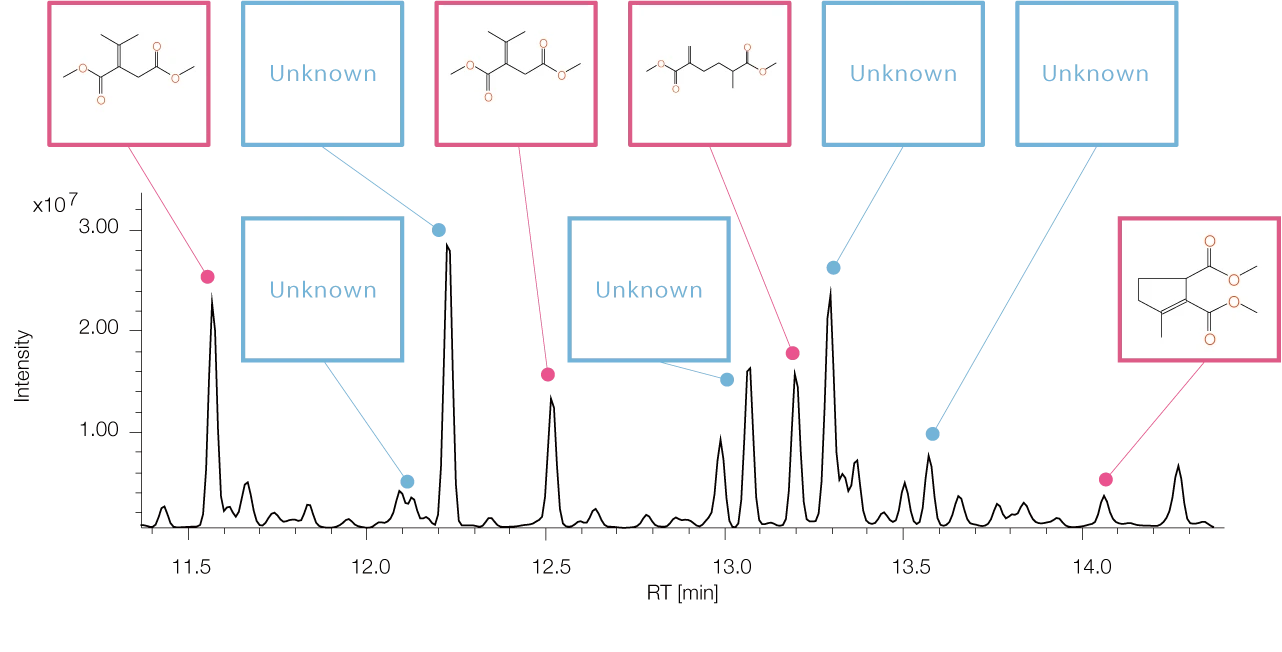
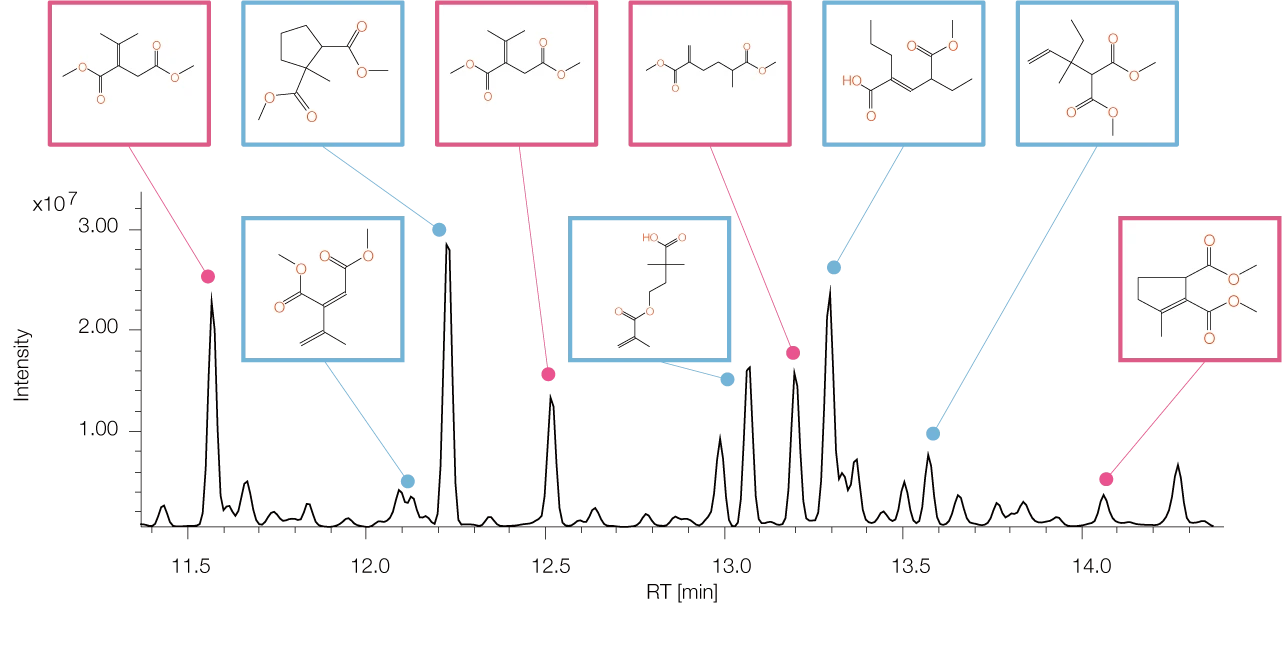
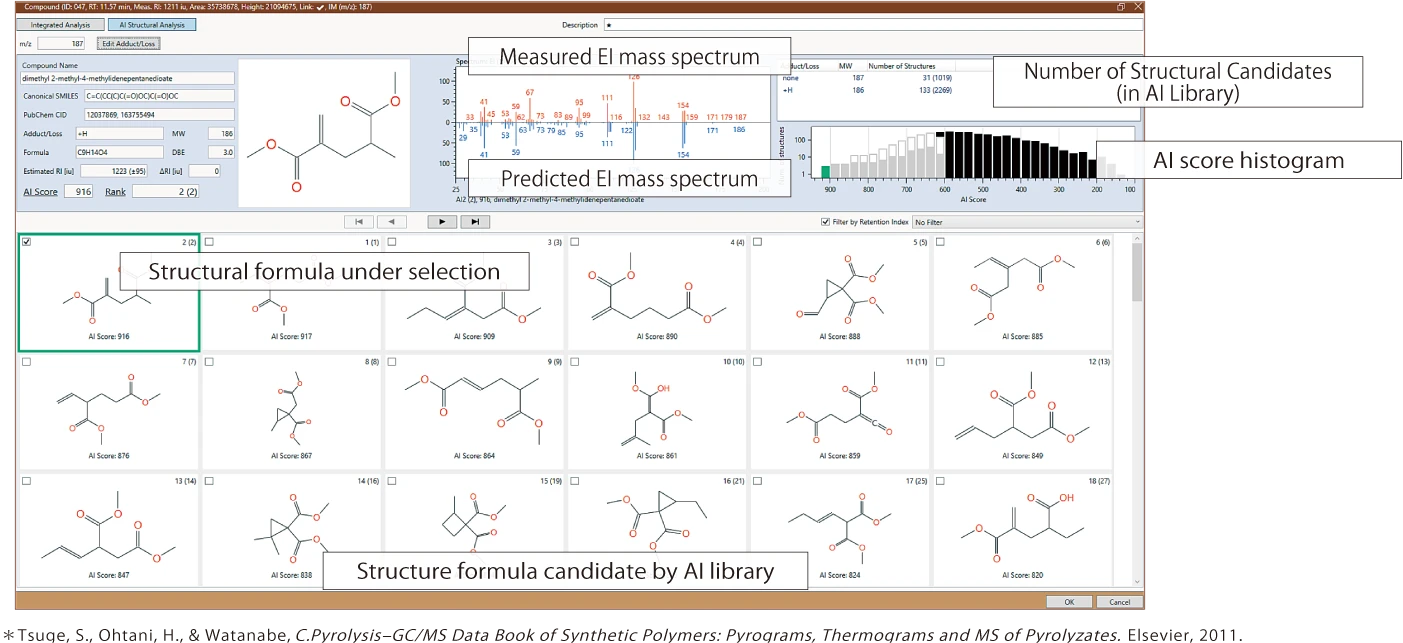
The example below shows the analysis of a dimer derived from an acrylic resin (a methyl methacrylate/methyl acrylate copolymer), which is not included in the NIST database.
We examined how highly the structure described in the literature* appears in the candidate list generated by AI structure analysis in msFineAnalysis IQ, and in this case, the correct structure was presented as the second‑ranked candidate.
#3 Target Analysis
Quickly search for target compounds such as odor compounds and additives!
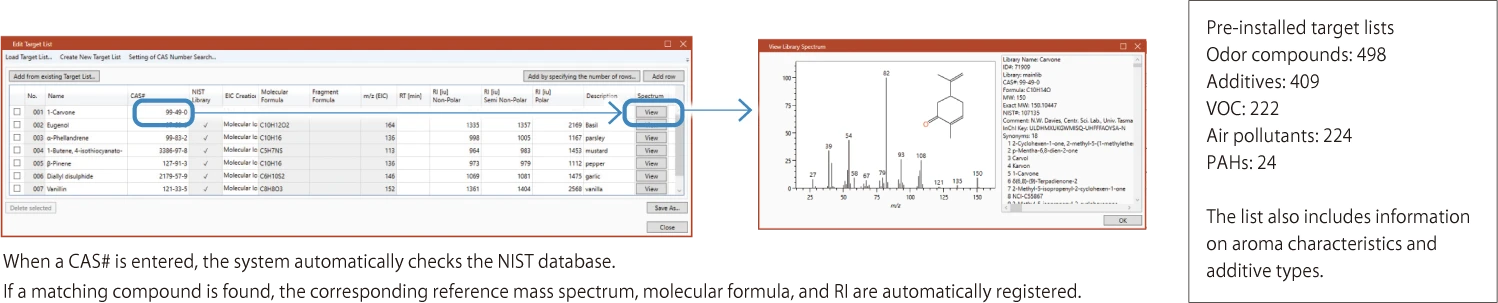
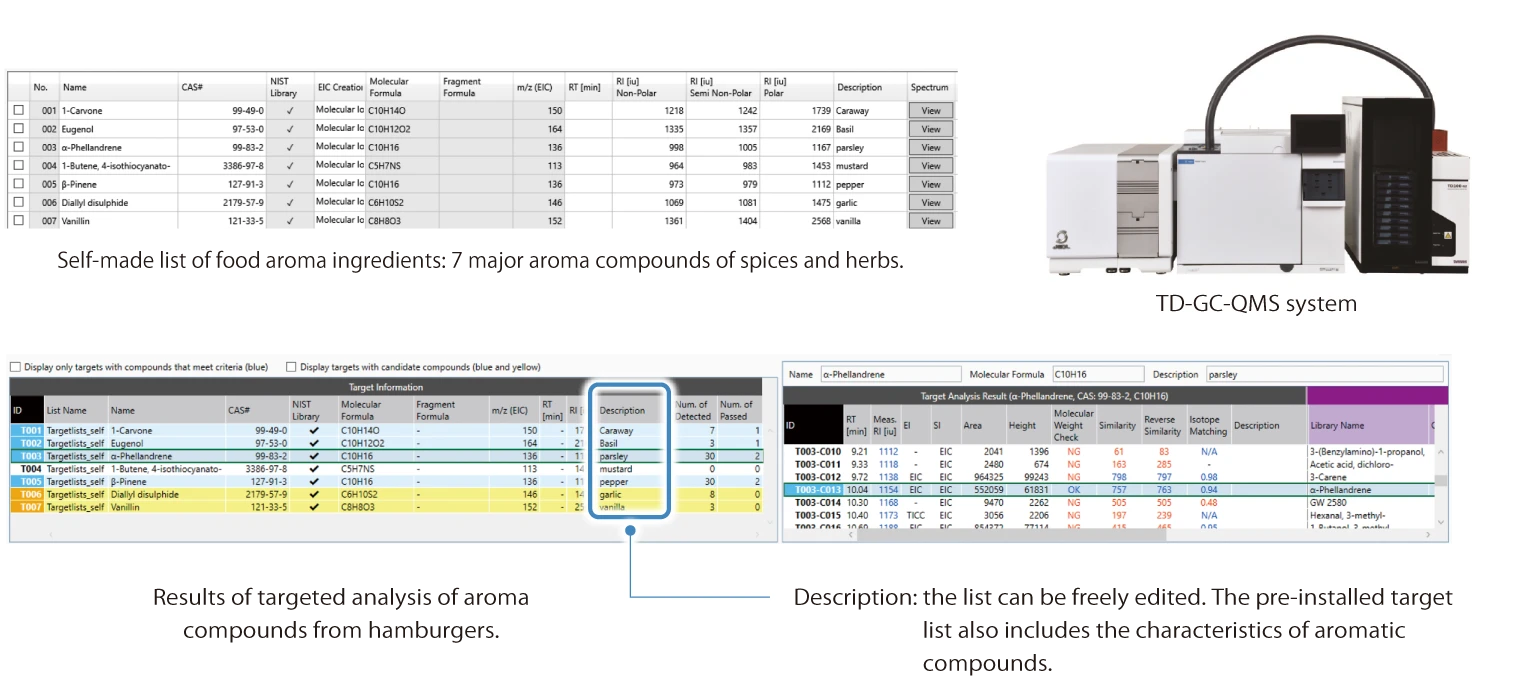
Target analysis automatically searches for compounds based on compositional formula, m/z value, and CAS#. Target lists can be freely created and edited, and several types of pre-made target lists are also installed. Integrated analysis of compounds detected by target analysis is available.
● Editing the target compound list
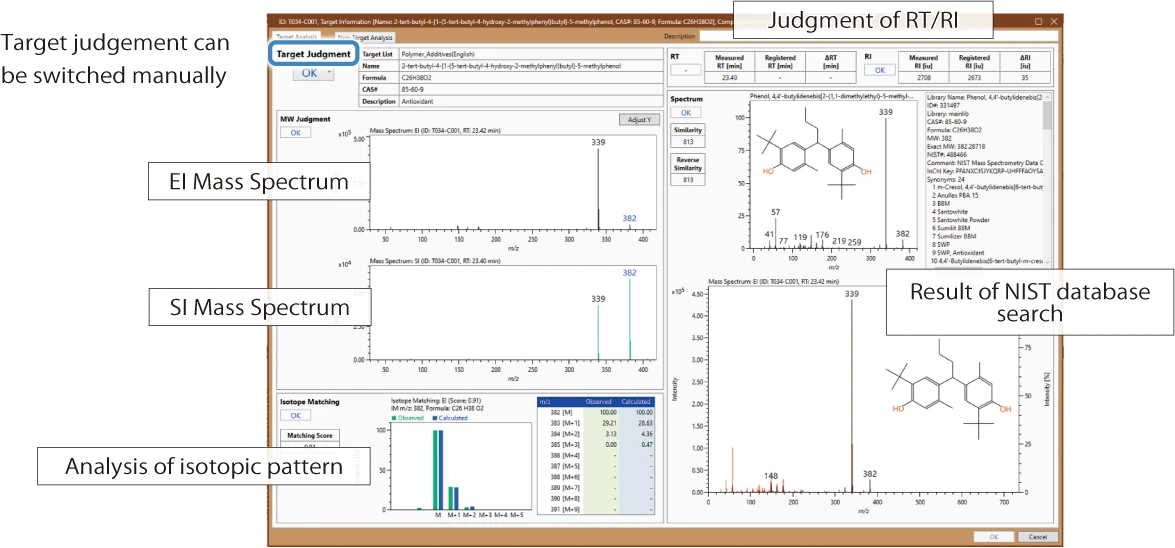
● Work Screen of Target Analysis Result
Analysis of Aroma Compounds in Hamburgers Using Microchamber/TD-GC-QMS (MSTips No.486)
Commercially available hamburgers were measured using microchamber/TD-GC-MS, and target analysis was performed using a selfmade list of food flavor compounds. As a result, 4 out of 7 compounds registered in the list met the criteria (background color: blue). It was possible to rapidly search for characteristic aroma compounds derived from hamburger spices and herbs.
#4 Deconvolution Detection
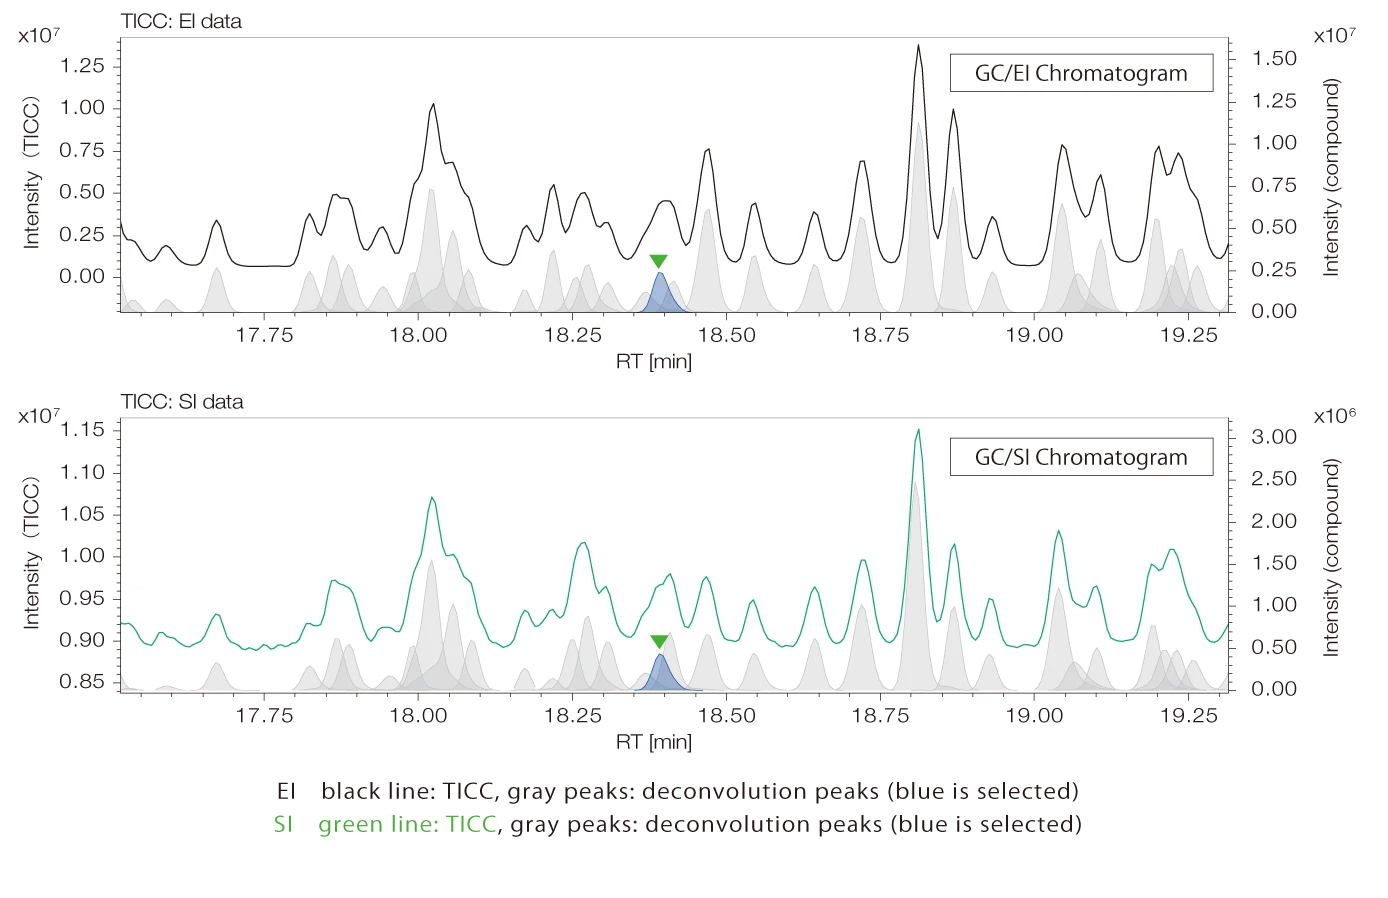
Co-eluting compounds that appear as a single peak on the TICC and trace compounds hidden by chemical noise are also detected!
#5 netCDF (ANDI-MS) Data An alysis
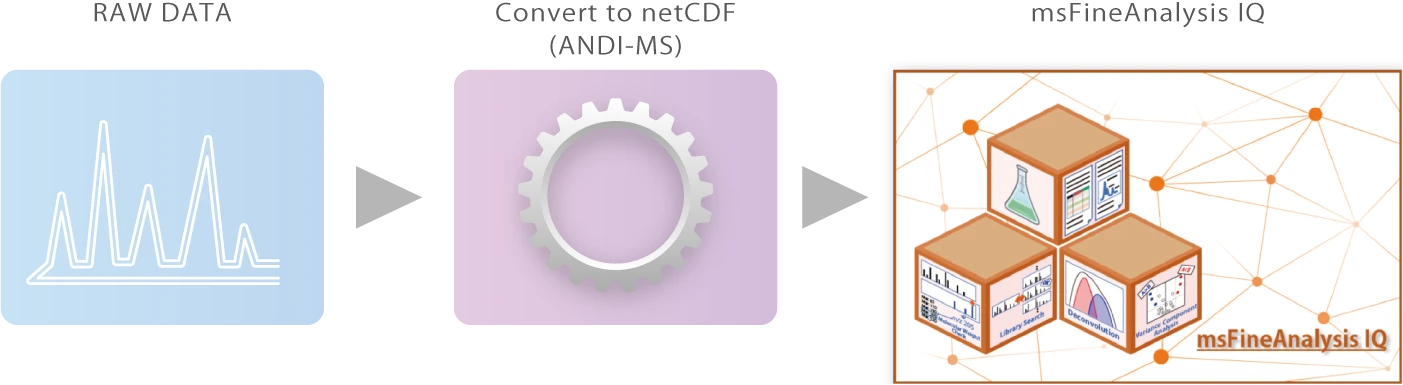
Analysis of netCDF (ANDI‑MS) data, the common data format for GC‑MS, is supported!
Data acquired on legacy JEOL GC‑QMS series instruments can also be analyzed, provided that the data are converted into the netCDF format.
#6 Differential Analysis
Quickly extract the differences between two samples, such as good or defective products, differences in origin, differences in manufacturing methods, etc!
● Work Screen for Difference Analysis Results
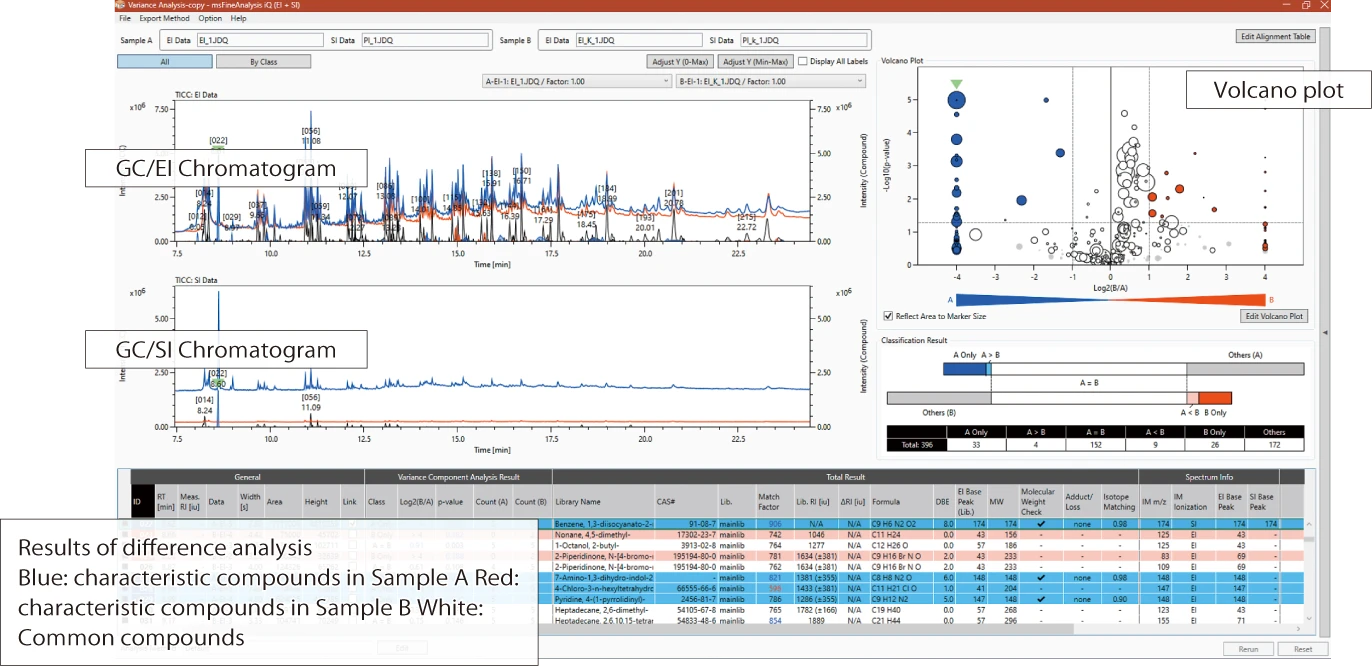
msFineAnalysis IQ performs difference analysis using statistical hypothesis testing. The statistical hypothesis test uses GC/EI data (two samples measured in replicates, e.g., n=3 or n=5) to determine if there is“repeatability”and“difference”in the detected compounds between the samples. After classification of compounds that are characteristic of each sample and those that are common to all samples, integrated analysis using GC/EI and SI data is performed automatically.
● Volcano plot
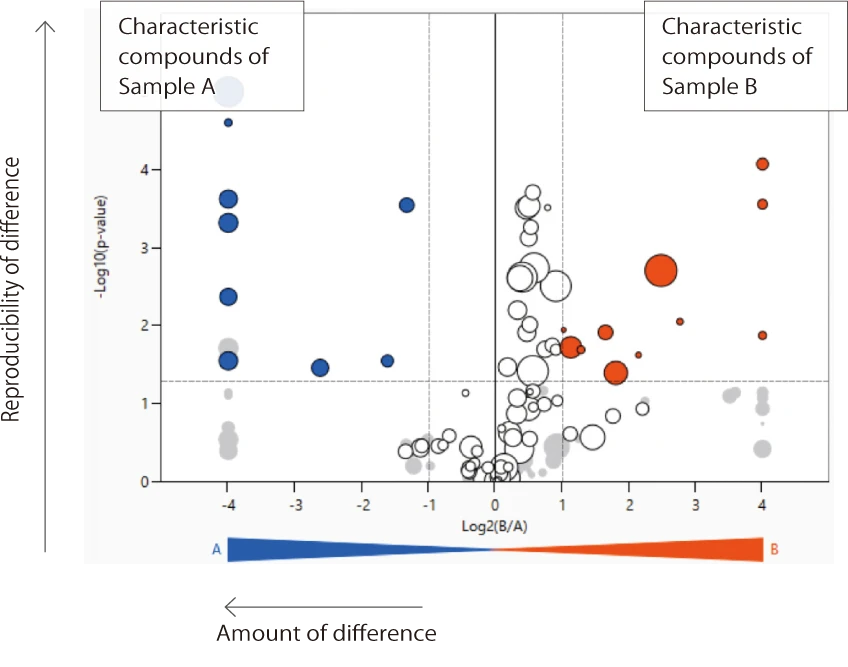
In the volcano plot, each circle corresponds to a single compound, and the size of the circle reflects the peak area. The horizontal and vertical axes are shown below:
【Horizontal axis】
Logarithm of the intensity ratio between two samples (Fold-change)
The larger the absolute value, the greater the intensity ratio between samples.
【Vertical axis】
Negative value of logarithm of p-value the larger the value, the higher the reproducibility.
A volcano plot enables intuitive visualization of both differential components between samples and their reproducibility.
Difference analysis of chocolates with different cacao content using HS-SPME-GC-QMS (MSTips No.438)
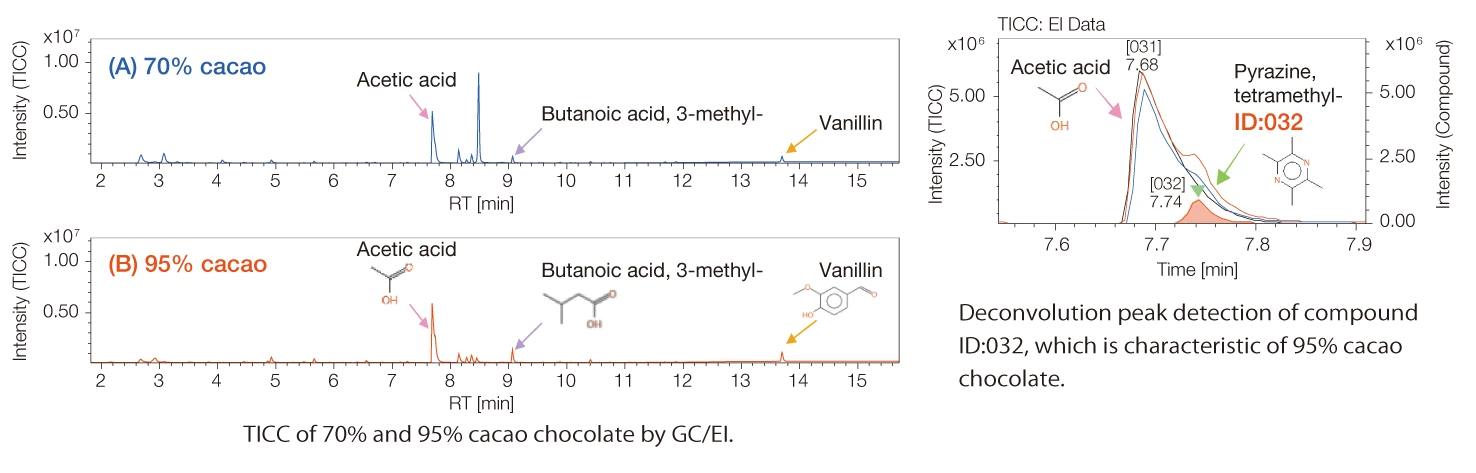
In each sample, compounds found in chocolate aroma, such as aldehydes, esters, carboxylic acids and nitrogen-containing pyrazines, were detected.
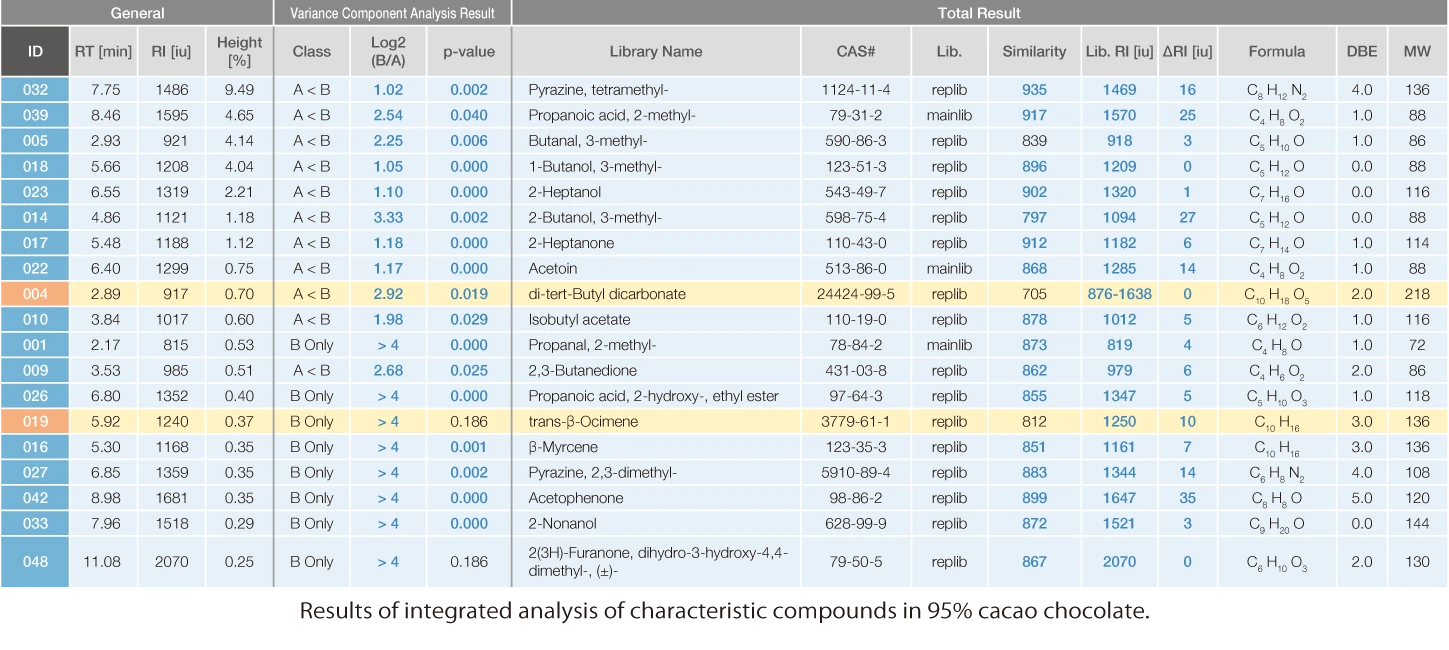
Compound ID:032 with the highest intensity at approximately 95% cacao content was estimated to be pyrazine, tetramethyl-. Pyrazine, tetramethyl- is an aroma produced by roasting cacao, and it is suggested that it is strongly detected in this sample with a higher cacao content. The compound eluted at a time close to that of a common component, acetic acid, between the two samples. However, it could be detected by deconvolution peak detection.
Difference analysis of water-based inks of different colors (cyan and magenta) (MSTips No.396)
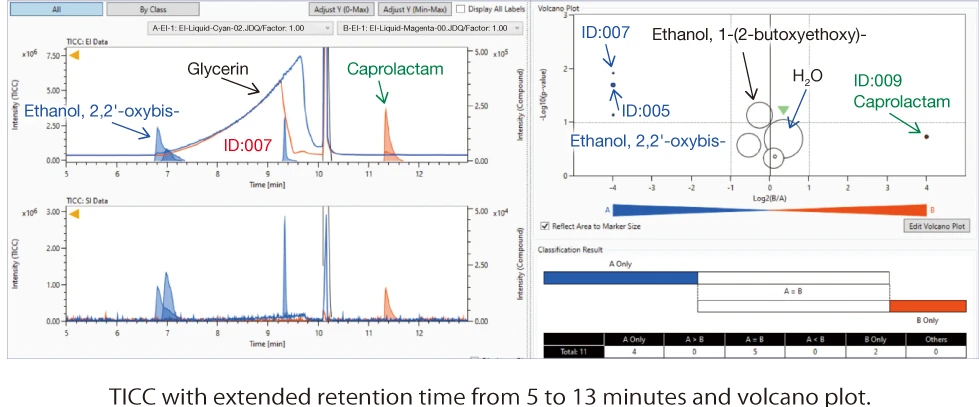
Compounds found specifically in the cyan and magenta are in the left and right regions, respectively, of the volcano plot. Although quantitatively smaller than common components such as water and isopropyl alcohol in the center, we found that ethanol, 2,2'-oxybis- (diethylene glycol) and four other compounds were specifically present in cyan, as opposed to caprolactam, which is specifically present in magenta.
Applicable models
JMS-Q1600GC UltraQuad™ 2.0 Gas Chromatograph Quadrupole Mass Spectrometer
JMS-TQ4000GC UltraQuad™ TQ Gas Chromatograph Triple Quadrupole Mass Spectrometer
Notes
The MS-06024N23(NIST23 database)is required.
This product operates on the PC with the Windows® 11 or later.
The display resolution must be 1920 x 1080 or higher.
AI structure analysis is available with the AI library which is an optional product.
Notice:
Windows® is either a registered trademark or a trademark of Microsoft Corporation in the United States and/or other countries.
Catalogue Download
Application
msFineAnalysis IQ applications
msFineAnalysis iQ Ver.2 Target Analysis Example I ~ Rapid Analysis of Food Aroma Components
msFineAnalysis iQ Ver.2 Target Analysis Example II ~ Rapid Analysis of Polymer additives
Qualitative Analysis of Grated Daikon Radish by using HS-SPME-GC-QMS and msFineAnalysis iQ
Integrated qualitative analysis of fatty acid methyl esters (FAMEs) by msFineAnalysis iQ
Differential analysis of coffee aroma compounds using HS GC-QMS and msFineAnalysis iQ
GC/EI and PI Integrated analysis of water-based inks using msFineAnalysis iQ
Differential analysis in two different types of water-based ink products using msFineAnalysis iQ
Related Products
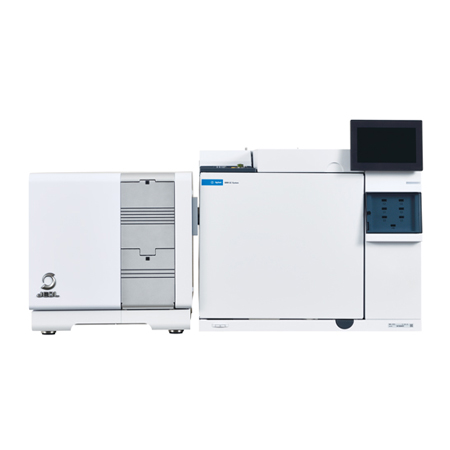
JMS-Q1600GC UltraQuad™ 2.0 Gas Chromatograph Quadrupole Mass Spectrometer
The JMS-Q1600GC UltraQuad™ 2.0 is a versatile, high-performance GC-QMS system for a wide range of qualitative and quantitative applications, from materials and aroma analysis to environmental, water quality, and agrochemical analysis. msFineAnalysis IQ with the AI Structure Analysis Program delivers powerful performance for the qualitative analysis of unknown compounds.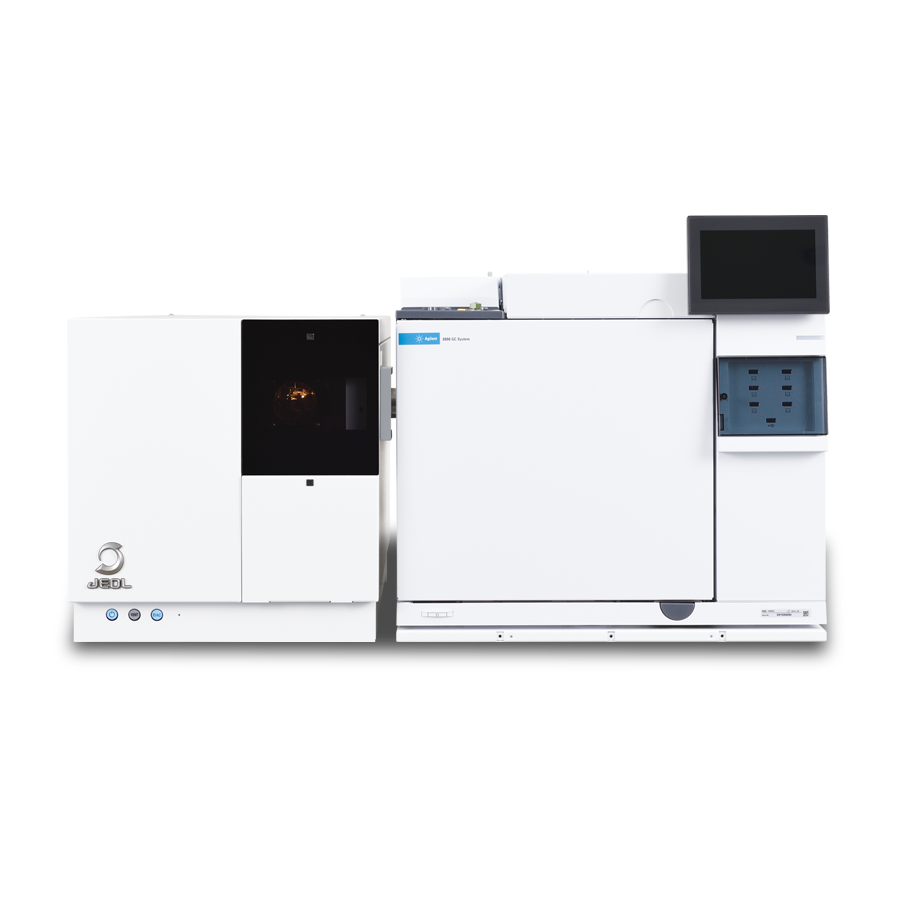
JMS-TQ4000GC Gas Chromatograph - Triple Quadrupole Mass Spectrometer
Equipped with a short collision cell and high-speed SRM capability (up to 1,000 channels/sec), the JMS-TQ4000GC delivers exceptional sensitivity and throughput for multi-component quantitative analysis in environmental, food, and chemical applications.More Info


Are you a medical professional or personnel engaged in medical care?
No
Please be reminded that these pages are not intended to provide the general public with information about the products.