Differential Analysis of Chocolates with Different Cacao Content by using a HS-SPME-GC-QMS and msFineAnalysis iQ
MSTips No. 438
Introduction
Food flavor components are known to be an important element of good taste, and off-flavor components, such as rancid odors, are also an important element of food quality. Gas chromatography-mass spectrometry (GC-MS) is often used to analyze these food flavor components due to the high volatility of flavor components and the complex composition of many components. Qualitative analysis by GC-QMS is generally performed by searching the library database (DB) using the measurement data of the Electron Ionization (EI). However, if qualitative analysis is performed using only the similarity with the library spectrum as an index, several significant candidates may be obtained depending on the compound, or erroneous candidates may be selected as the identification result. In such cases, confirmation of molecular ions by the soft ionization (SI) such as the photoionization (PI) is effective. In 2021, we released msFineAnalysis iQ, an integrated qualitative analysis software that automatically combines the analysis results of EI and SI methods measured by GC-QMS. The details of this software are introduced in MSTips No. 347 and 348. In this MSTips, we will introduce an analysis example of differential analysis of chocolates with different cacao content using msFineAnalysis iQ.
Experimental
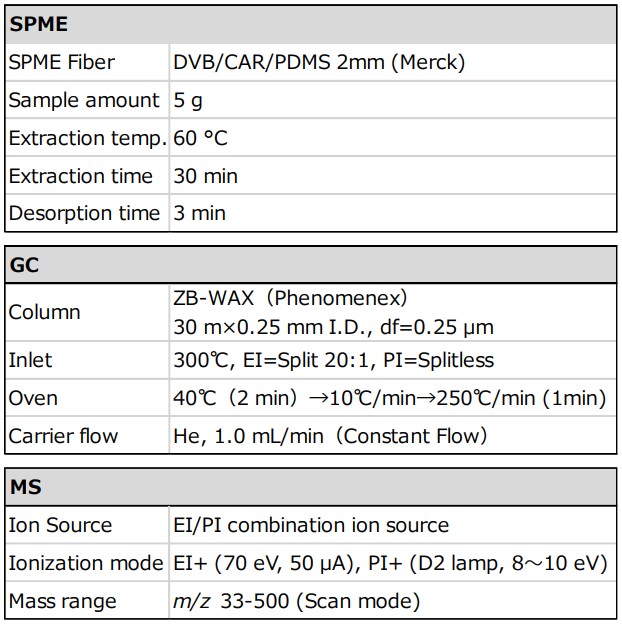
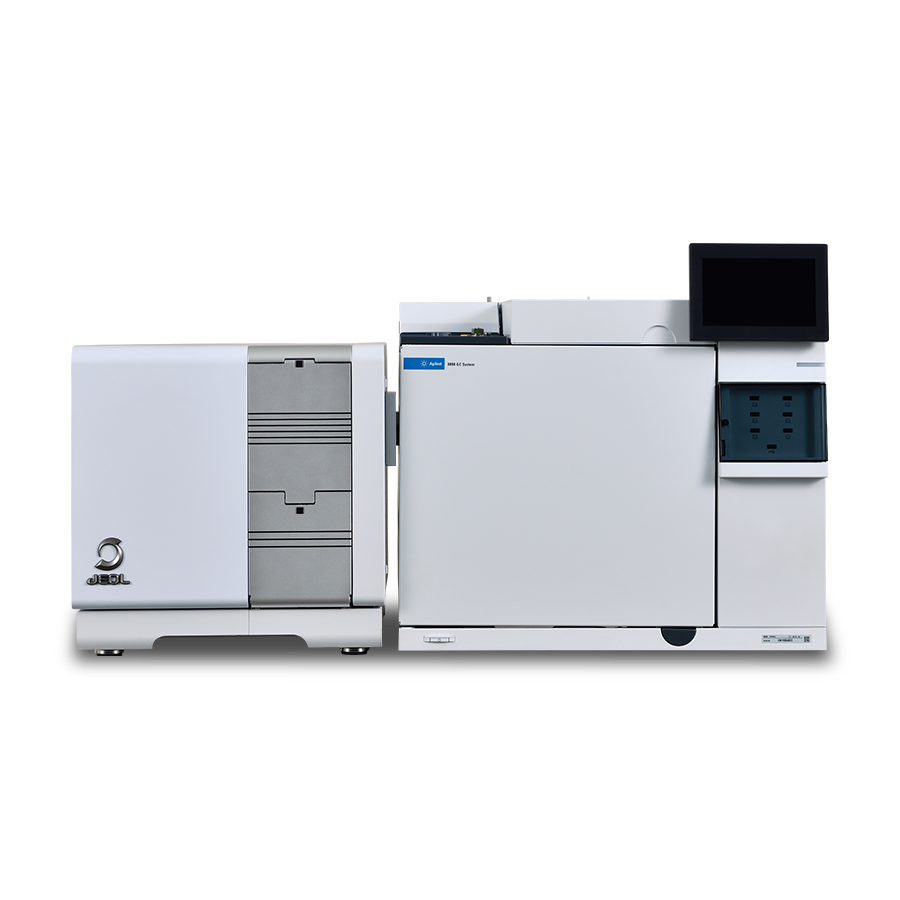
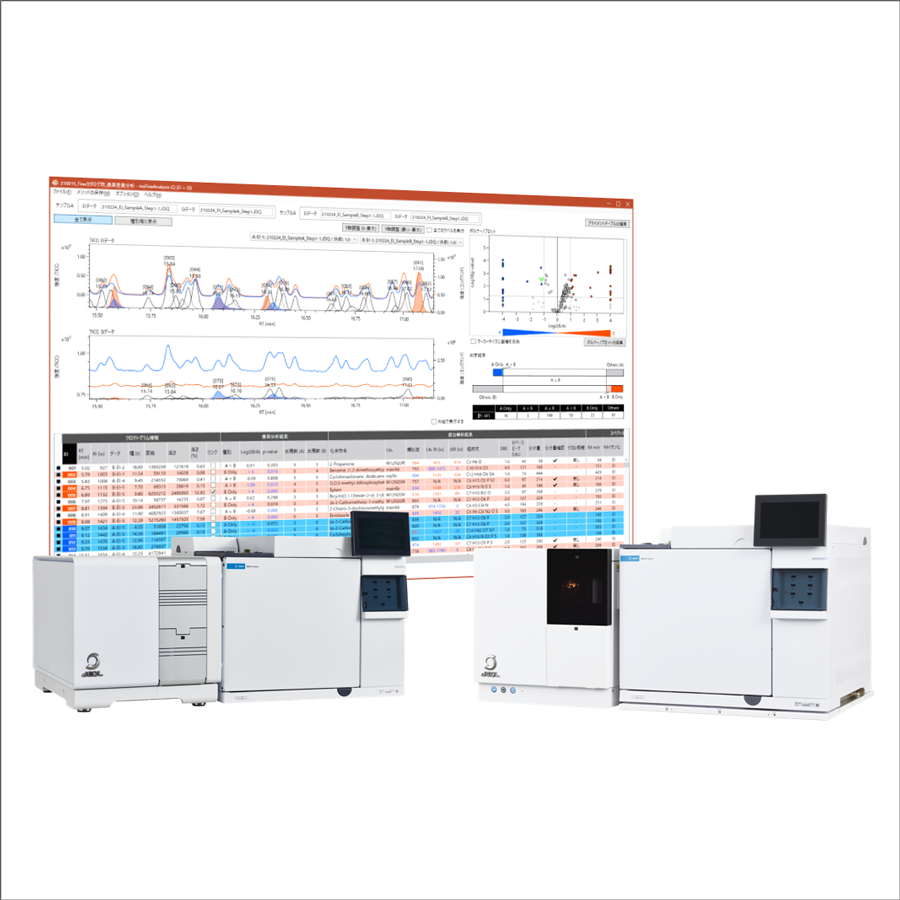
Two types of chocolates (approximately 70% and 95% cacao content) were used as samples, and the sample weight was 5 g. A GC-QMS (JMS-Q1600GC UltraQuad™ SQ-Zeta, JEOL Ltd.) was used for the measurement. The SPME mode of the HT2850T autosampler (HTA S.R.L.) was used as the sample pretreatment device, and volatile components in the headspace area of the vials were targeted for the measurement. We performed HS-SPME-GC-QMS measurements using both EI and photoionization (PI) modes with a combination EI/PI ion source. The qualitative data processing was performed with msFineAnalysis iQ (JEOL Ltd.). Detailed measurement conditions are shown in Table 1.
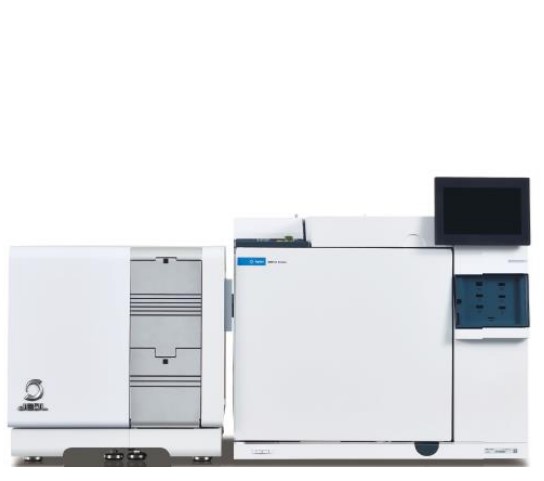
JMS-Q1600GC UltraQuadTM SQ-Zeta
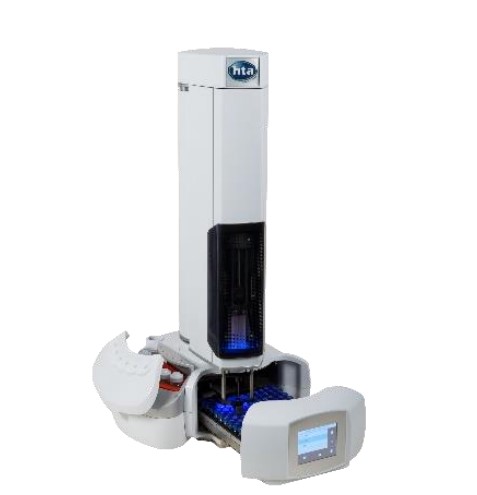
HT2850T
Table 1 Measurement condition
Results and Discussion
TICC and differential analysis result
Figure 1 shows TICC of EI data and Figure 2 shows volcano plot of differential analysis result (Blue: 70% cacao, Red: 95% cacao). Volcano plots made it possible to visualize common and different components in each sample. We were able to extract 11 components characteristic of 70% cacao, 19 components characteristic of 95% cacao, and 21 common components. Compounds known as chocolate flavor such as Acetic acid , Butanoic acid, 3-methyl- and Vanillin ware detected as the common components of each sample (Figure 1). The results of the integrated qualitative analysis of the characteristic components of each sample are described in the next section.
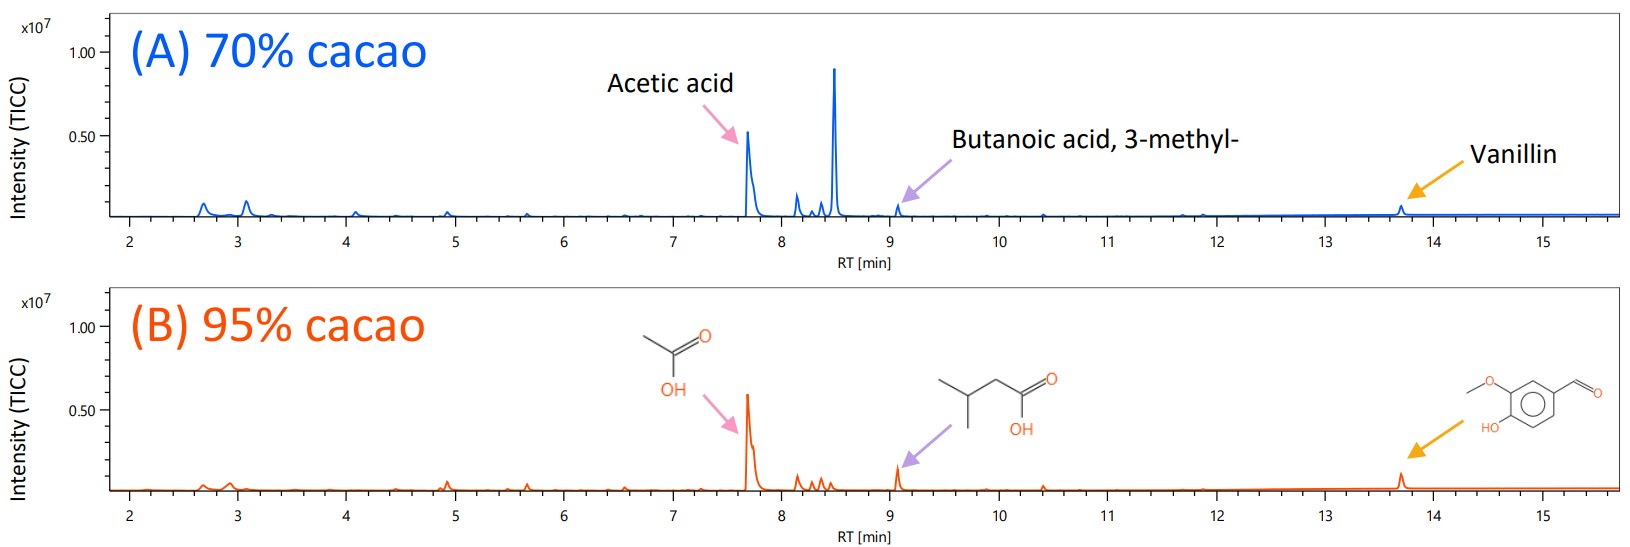
Figure 1 Total ion current chromatograms of EI
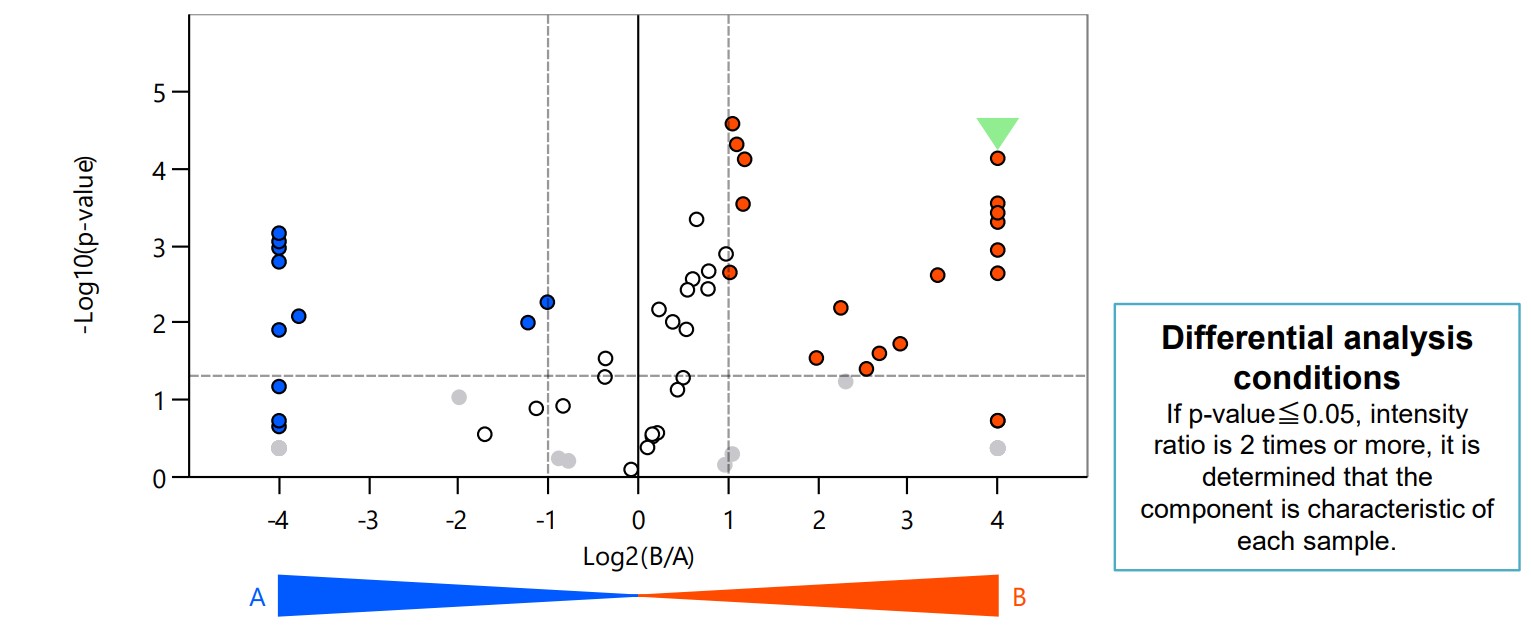
Figure 2 Volcano plot of variance component analysis result
Integrated qualitative analysis result of characteristic components of each sample
Table 2 and Table3 shows the integrated qualitative analysis result of each sample (Table 2: 70% cacao, Table 3: 95% cacao). In integrated qualitative analysis, the quality of the qualitative results can be confirmed by the background color of the table.
Blue level: high-level library matching and verifying information
Yellow level: medium-level library matching; missing or poor verifying information
In this study, most of the qualitative results showed blue levels and a high degree of accuracy. In each sample, components that could be derived from chocolate flavor components, such as aldehydes, esters, carboxylic acids and pyrazines, were detected.
The mass spectra of the component with the highest relative intensity for each sample is shown in Figure 3. The ID 040 with the highest relative intensity in the 70% cacao was estimated to be Propylene glycol. Propylene glycol is a component used as a solvent and emulsifier for food flavors and colorants. The low cacao content of this sample suggests that Propylene glycol is used as a flavoring solvent. The ID 032 with the highest relative intensity in the 95% cacao was estimated to be Pyrazine, tetramethyl-. Pyrazine, tetramethyl- is an aroma produced by roasting cacao, and is thought to be strongly detected in this sample with the high cacao content. Although this component eluted at a similar time to the common component Acetic acid in both samples, the peak could be detected using the deconvolution peak detection function of msFineAnalysis iQ (Figure 4).
Using msFineAnalysis iQ, it was possible to easily extract and qualify the characteristic components of each sample.
Table 2 Characteristic compounds in 70% cacao
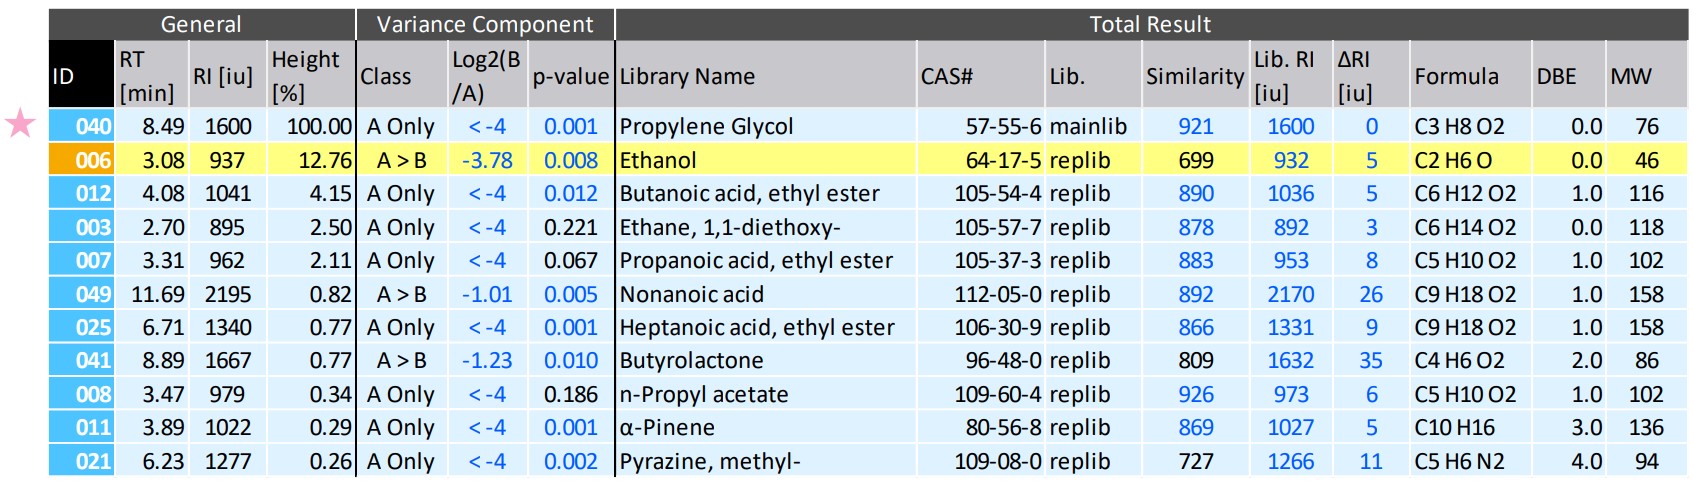
Table 3 Characteristic compounds in 95% cacao
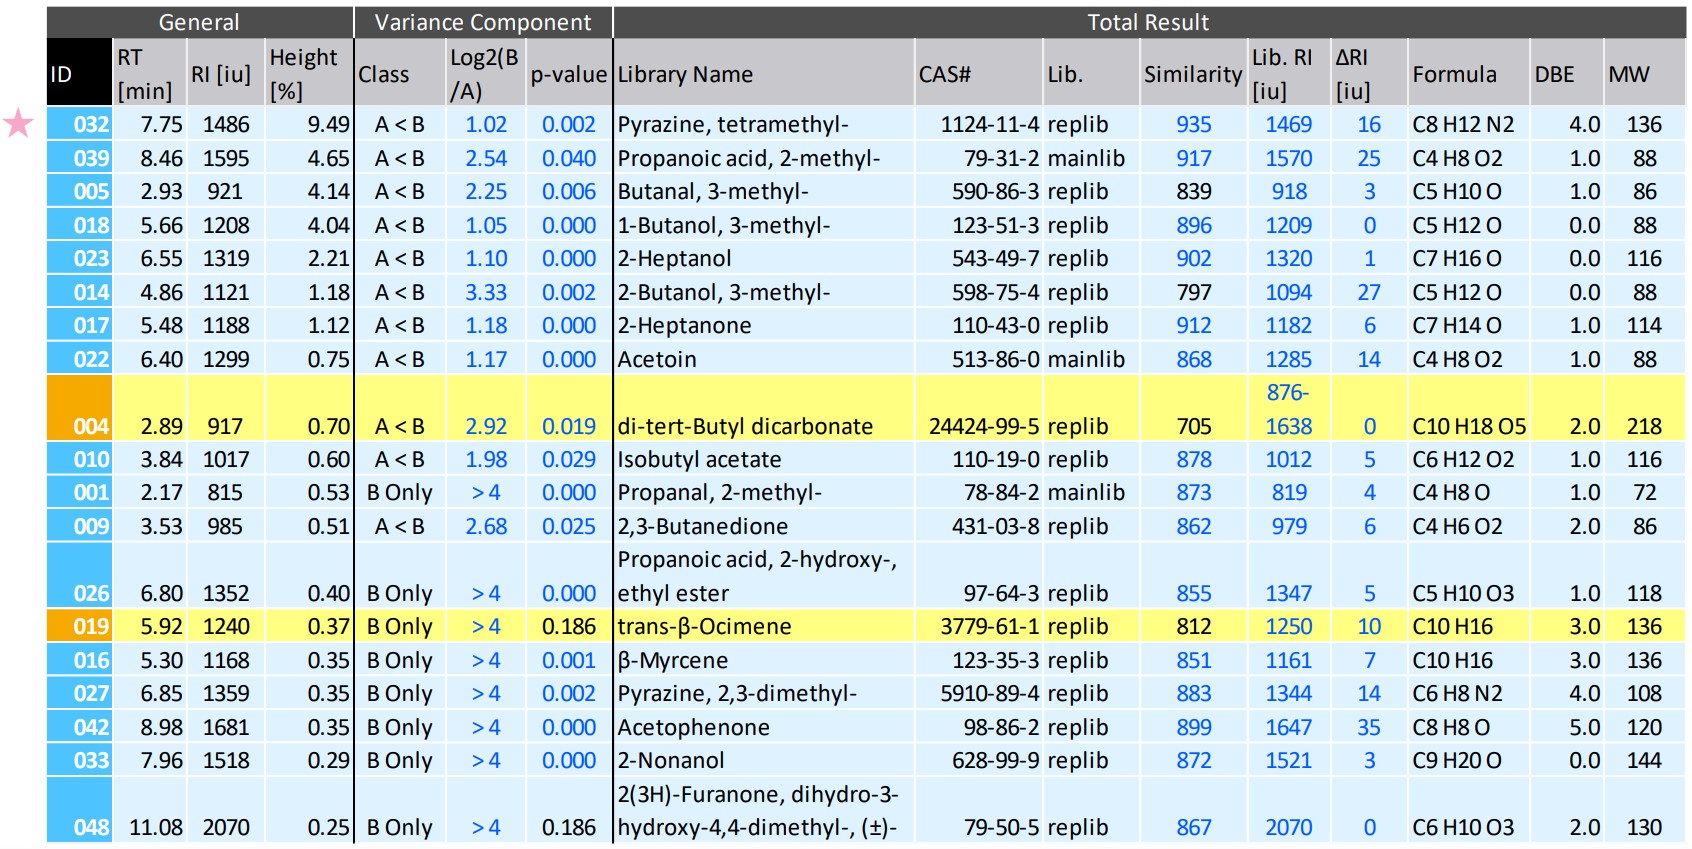
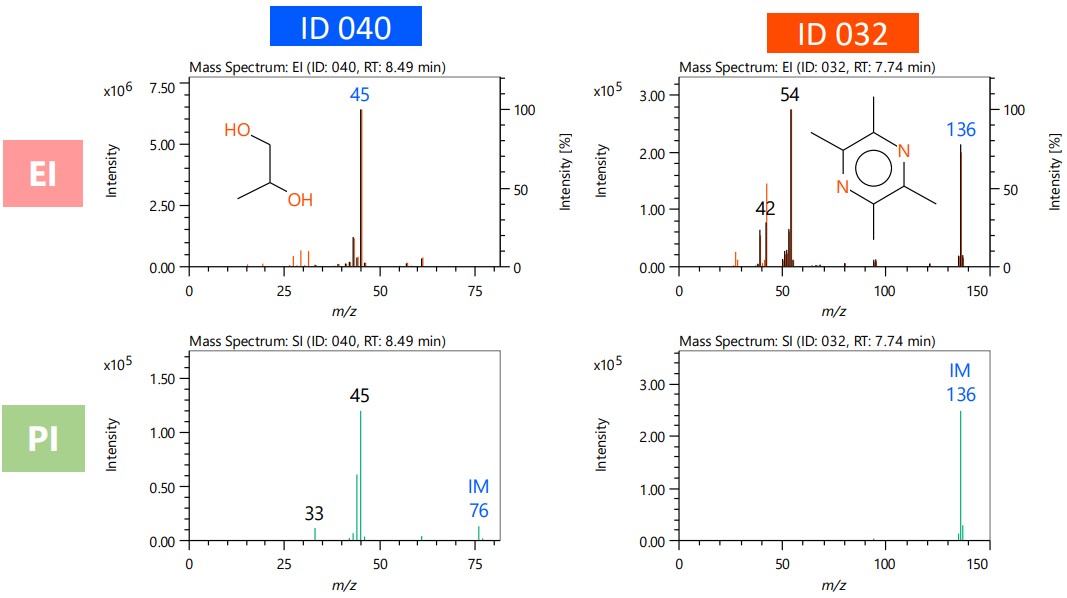
Figure 3 Mass spectra of ID 040 and ID 032
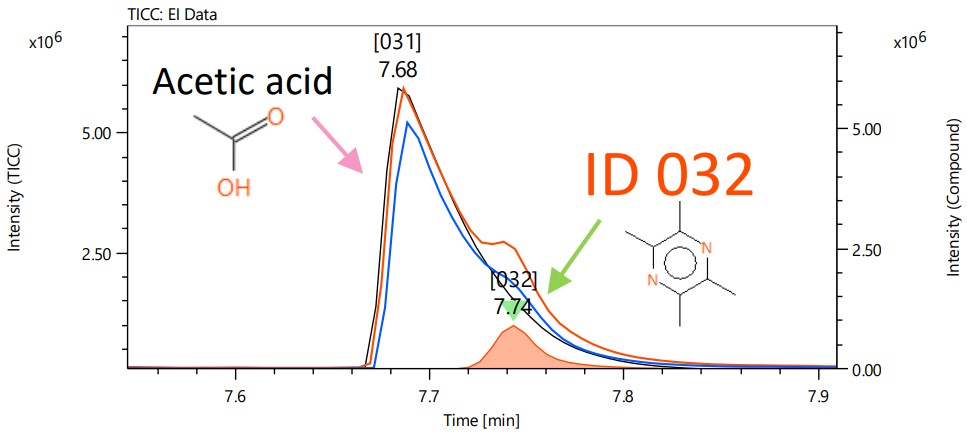
Figure 4 Deconvolution chromatogram of ID 032
Conclusions
In this MSTips, we introduced an example of difference analysis of chocolates with different cacao content using the differential analysis function of msFineAnalysis iQ. This function made it possible to easily extract differential and common components among samples and to easily qualify each component. This software is expected to improve the qualitative accuracy and efficiency of qualitative analysis using GC-QMS.
Solutions by field
Related products
Are you a medical professional or personnel engaged in medical care?
No
Please be reminded that these pages are not intended to provide the general public with information about the products.