msFineAnalysis iQ
integrated qualitative analysis software
You no longer have to only rely on library DB searches for qualitative analysis!
msFineAnalysis iQ
Features
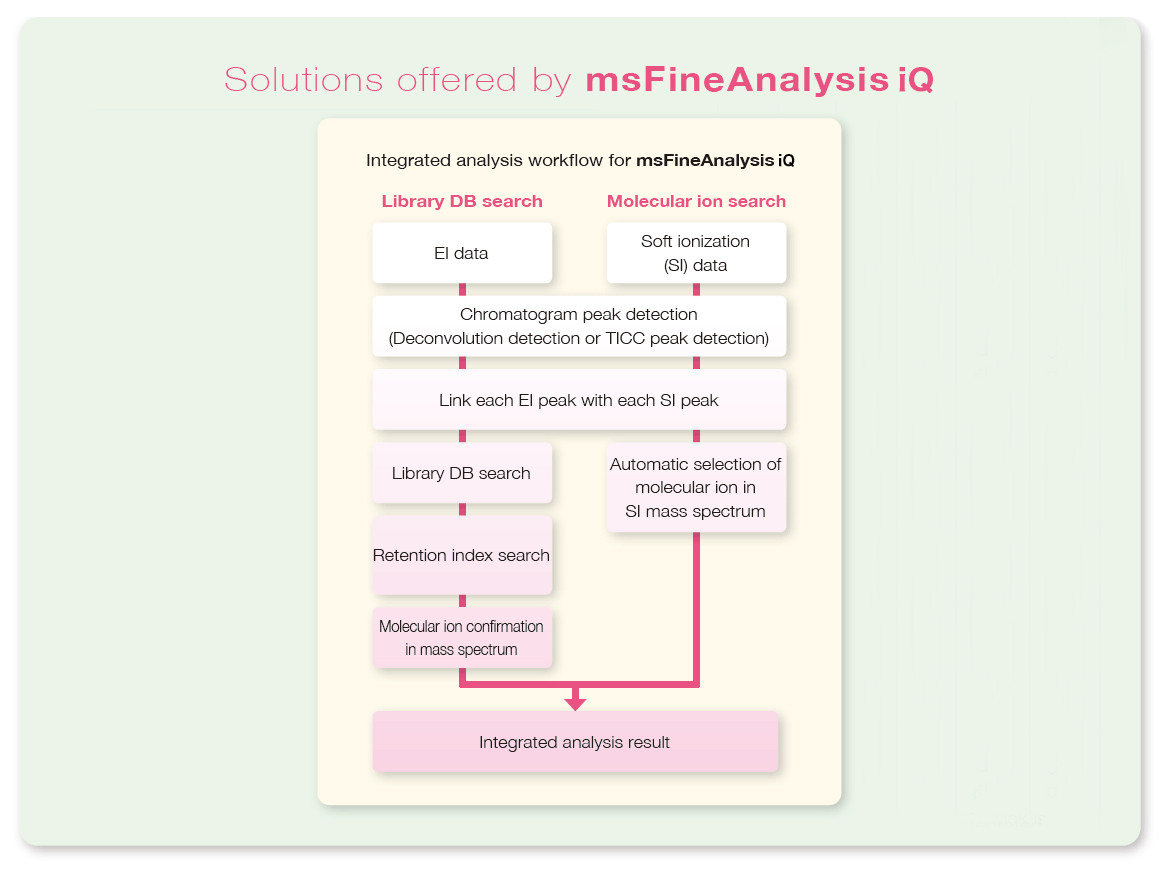
The msFineAnalysis iQ is an automatic qualitative analysis software that enables "integrated analysis" by combining the library database (DB) search using EI data and molecular weight confirmation using soft ionization data.
msFineAnalysis iQ improves analysis accuracy, shortens work hours, and improves work efficiency.
Usefulness of integrated qualitative analysis
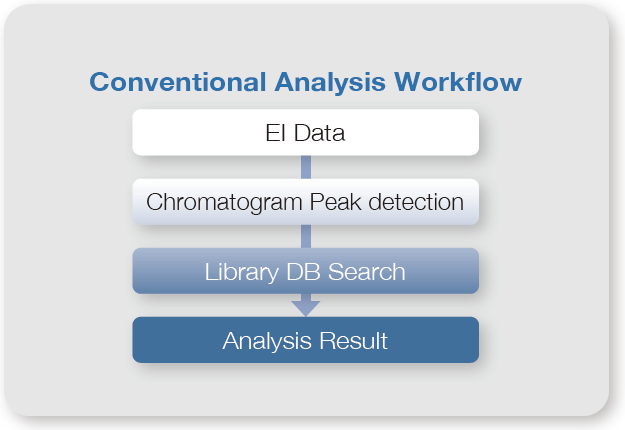
In qualitative analysis by GC-MS, it is common to perform a library DB search using mass spectra obtained by the Electron Ionization (EI) method.
The following figures and table show the EI and Soft Ionization (SI) mass spectra of component A, and the results of the library DB search using the EI mass spectrum. The library DB search results show that all of the candidates have a high similarity score of more than 800. In most cases, component A will be determined to be the first candidate with the highest similarity score in the library DB search when qualitative analysis is performed using only the EI mass spectrum. However, m/z 314, which is presumed to be a molecular ion, has been detected in the SI mass spectrum. Therefore, component A can be presumed to be the second candidate "Diethylene glycol dibenzoate".
In JEOL Ltd., we call the combination of library DB search using EI mass spectrum and analysis of molecular ions in the SI mass spectrum as "integrated qualitative analysis".
The msFineAnalysis iQ is a software that can perform this integrated qualitative analysis automatically.
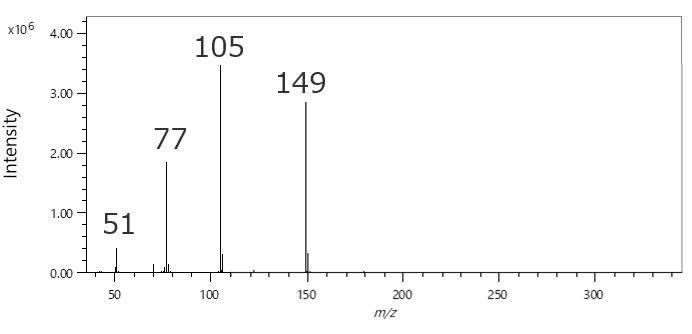
EI mass spectrum of component A
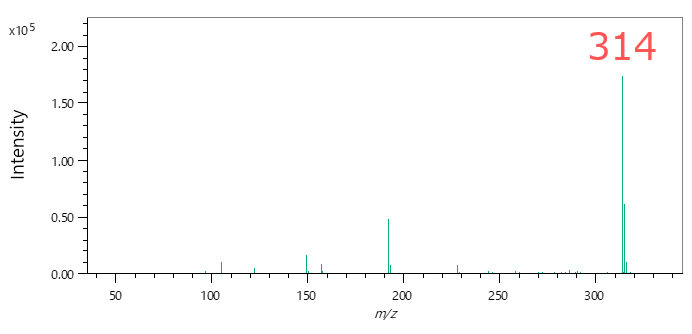
SI mass spectrum of component A
| No. | Library Name | Similarity | Formula | MW |
|---|---|---|---|---|
| 1 | 2,2'-(Ethane-1,2-diylbis(oxy))bis(ethane-2,1-diyl) dibenzoate | 828 | C20 H22 O6 | 358 |
| 2 | Diethylene glycol dibenzoate | 821 | C18 H18 O5 | 314 |
| 3 | Benzoic acid, 2-(3-nitrophenyl)ethyl ester | 810 | C15 H13 N O4 | 271 |
| 4 | 1,3-Dioxolane, 2-(methoxymethyl)-2-phenyl- | 802 | C11 H14 O3 | 194 |
| 5 | 3,6,9,12-Tetraoxatetradecane-1,14-diyl dibenzoate | 800 | C24 H30 O8 | 446 |
The library DB search results of component A (Top 5 candidates)
GC-MS qualitative analysis solution
Problems for Conventional Qualitative Analysis
Library DB search results produce multiple similar candidates, not a single candidate.
Unregistered compounds cannot be identified by library DB search.
More sophisticated analyses take time.

Quickly narrows down candidates by integrated analysis by combining EI data and soft ionization (SI) data.
After the data is selected, only a single-click is required to generate the automatic integrated report.
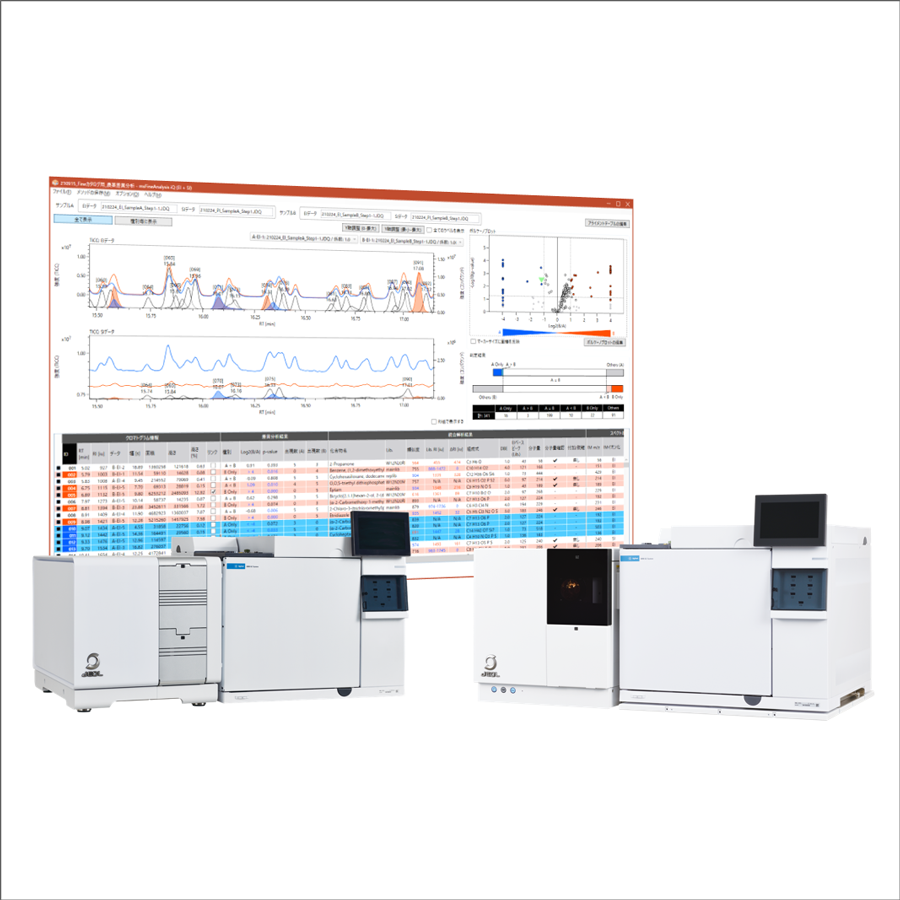
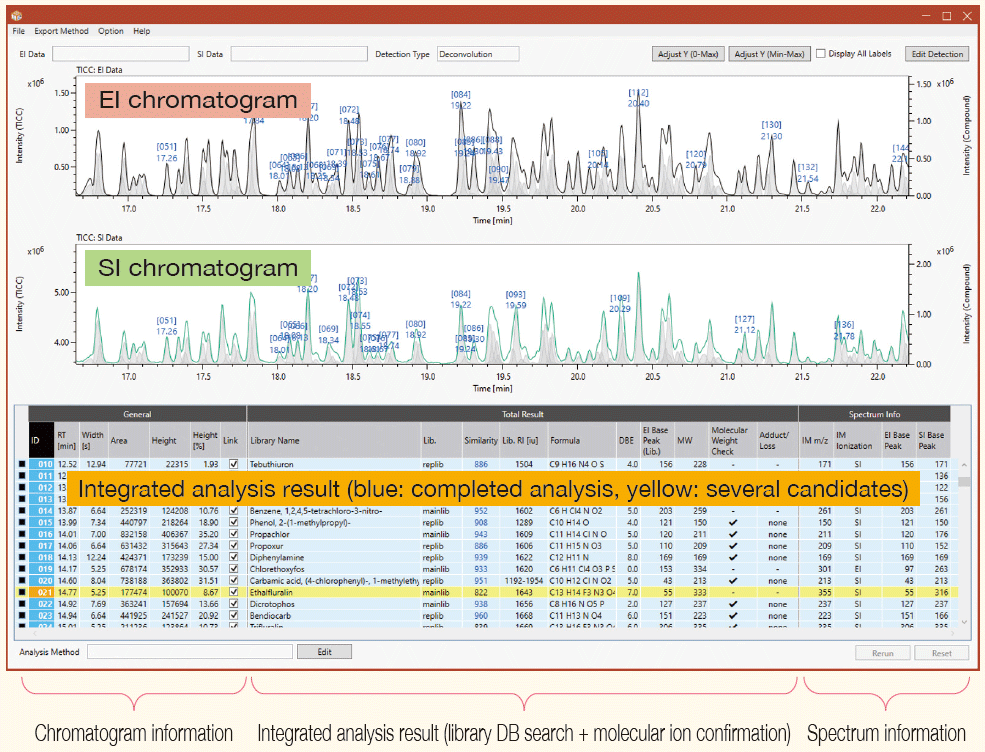
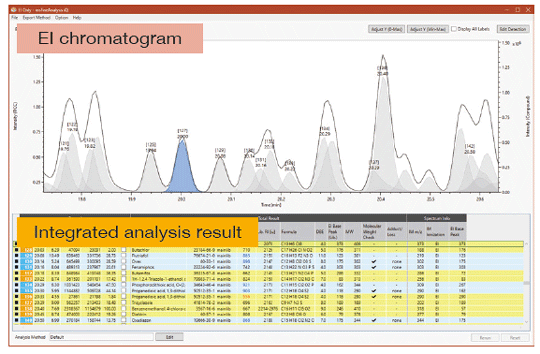
Integrated Analysis Result Window
In the Integrated Analysis Result window, the user confirms the results for the integrated analysis. This window shows the EI and soft ionization (SI) chromatograms, chromatogram information, spectrum information, library DB search, and molecular ion analysis results. When the user double-clicks the desired line in the analysis result list, a separate mass spectrum analysis window appears that allows the user to confirm the search result and molecular ion analysis result. The user can also update the results or perform the analysis again.
Full Functionality of the msFineAnalysis Series
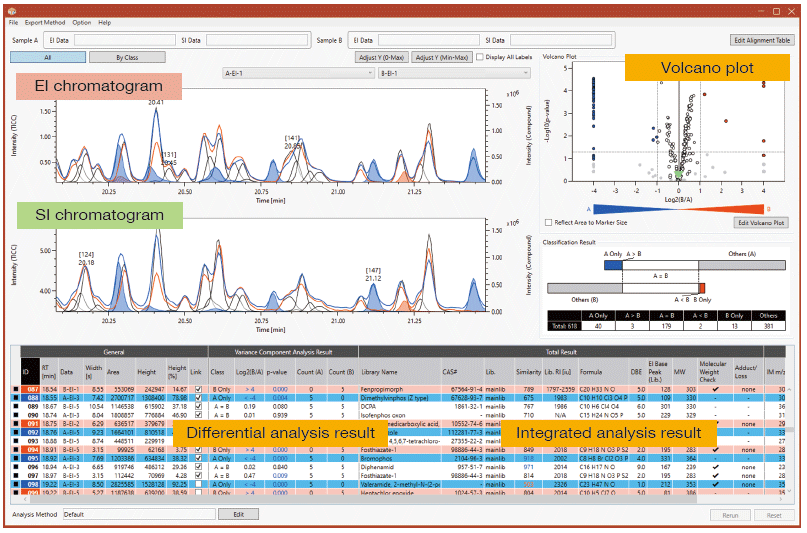
Two Sample Comparison Function (Differential Analysis)
The two sample comparison function uses reproducibility of the p-value on the vertical axis and a volcano plot which indicates the intensity ratio between two samples on the horizontal axis. This information enables a visual confirmation of the differing components between two samples. For example, it is possible to confirm the component that increases or decreases by comparing the reference product and defective product, or to confirm the components that are characteristic in a new material by comparing it with an existing material.
After differential analysis between samples, the normal msFineAnalysis integrated analysis is performed for all components.
For a two sample comparison function, it is possible to set n=1, 3, 5, for the number of measurements for each sample. In the case of n=1, it is not possible to evaluate the statistical reproducibility. However, it is possible to confirm which components are different. This function allows the user to do sample comparisons even when it is not possible to acquire more than one measurement for each sample.
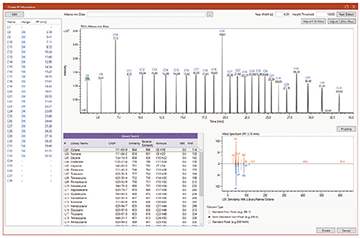
Deconvolution Detection
Deconvolution detection can detect trace components that may not be obvious in the TICC as a result of several component peaks overlapping and/or coelute as a single peak.
As a result, it is not necessary to create an extracted ion chromatogram (EIC) one-by-one manually, as was previously necessary.
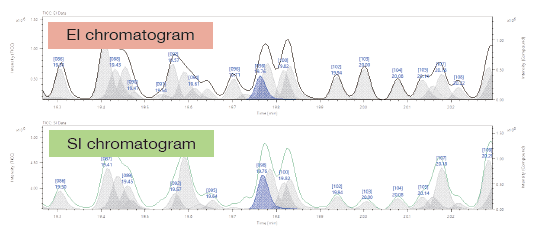
EI: black solid line: TICC, gray peaks: deconvolution peak (blue: currently selected)
SI: green solid line: TICC, gray peaks: deconvolution peak (blue: currently selected)
Analysis by EI Data Alone
Analysis using EI data alone is also possible.
When soft ionization sample data is not available, msFineAnalysis can produce an integrated analysis report in which the EI data is used for both the library DB search and the molecular ion search.
Retention index creation screen: GC/EI data of n-alkane mixture
Retention Index Qualitative Analysis
Retention index (RI) is a relative index value based on the retention time (RT) of an n-alkane standard mixture. This qualitative analysis function is performed by converting the retention time of the target component into a retention index and then comparing it with the retention index value in the database, etc.
With the msFineAnalysis series, it is possible to narrow down the qualitative analysis result further by using the retention index.
Applicable models
JMS-Q1600GC UltraQuad™ SQ-Zeta Gas Chromatograph Quadrupole Mass Spectrometer
JMS-TQ4000GC UltraQuad™ TQ GC Triple Quadrupole Mass Spectrometer
Notes
The MS-06023N20 (NIST20 database) is required.
This product operates on the PC with the Windows® 10 operating system (64-bit version) installed.
This product must be used with a display monitor with a resolution of 1,920 × 1,080 pixel or better.
To run this product, a PC equivalent to or better than the MS-67078PCJ is recommended.
This product supports only the following data types:
MS-66060MPR (Main Program):
Scan data
Scan data in SIM/Scan mode
MS-66090MPR (Main Program):
Scan data in single Q mode
Scan data in single Q/SIM/Scan mode
Scan data in SRM/Scan mode
Notice:
Windows® is either a registered trademark or a trademark of Microsoft Corporation in the United States and/or other countries.
Catalogue Download
msFineAnalysis iQ integrated qualitative analysis software
Application
msFineAnalysis iQ applications
GC-TOFMS Application: Qualitative Analysis of Chemical Components in an Herbal Medicine
GC-QMS Application: Analysis of additives in polypropylene products using thermal desorption-GC-MS
GC-TOFMS Application: Variance analysis of whisky components by JMS-T2000GC and msFineAnalysis
GC-TOFMS Application: Differential Analysis Function in msFineAnalysis Ver 3 (1)
GC-TOFMS Application: Differential Analysis Function in msFineAnalysis Ver 3 (3)
GC-TOFMS Application: Differential Analysis Function in msFineAnalysis Ver 3 (2)
Related Products
JMS-Q1600GC UltraQuad™ SQ-Zeta Gas Chromatograph Quadrupole Mass Spectrometer "Zeta"
The 6th generation high-end GC-QMS is finally here!
The new JMS-Q1600GC UltraQuad™ SQ-Zeta of JEOL is our 6th generation high-end Gas Chromatograph Quadrupole Mass Spectrometer (GC-QMS) based on JEOL's 50 years of MS technologies and experience.<br><br>From quantitative applications such as environmental samples, water quality control and agrochemicals, to qualitative applications such as materials and aroma analyses, the SQ-Zeta is the ultimate general-purpose GC-MS with high-performance capabilities for a wide variety of measurement and analysis needs.
JMS-TQ4000GC Gas Chromatograph - Triple Quadrupole Mass Spectrometer
Equipped with a short collision cell and high-speed SRM capability (up to 1,000 channels/sec), the JMS-TQ4000GC delivers exceptional sensitivity and throughput for multi-component quantitative analysis in environmental, food, and chemical applications.
More Info
Are you a medical professional or personnel engaged in medical care?
No
Please be reminded that these pages are not intended to provide the general public with information about the products.