Differential Analysis Function in msFineAnalysis Ver 3 (3)
MSTips No.329: Analysis of Vinyl Acetate Resin by Using Pyrolysis-GC-TOFMS
Introduction
As the performance of mass spectrometers has improved, the demand for differential analysis of trace components in materials has increased. To address this trend, we have added a new differential analysis function to msFineAnalysis, our automated qualitative analysis software specifically designed for GC-HRTOFMS data. In this work we used msFineAnalysis to compare Vinyl Acetate Resins that were measured by using Pyrolysis (Py)-GC-MS.
Analysis detail
Two commercially available Vinyl Acetate Resins (adhesives) (A, B) were used as samples. In order to conduct statistical analysis, GC/EI measurements were performed for n=5. As the condition for differential classification, p-value (an index: the smaller the p-value, the higher the statistical reproducibility) ≦5% and fold change (intensity ratio between samples ) ≧1.5 were used to perform differential analysis by using msFineAnalysis. The Table 1 shows the measurements condition details.
Table 1. Measurement and analysis conditions
| Py-GC-MS | |
|---|---|
| Pyrolyzer | EGA/PY-3030D (Frontier Laboratories Ltd) |
| Mode | Single shot |
| Furnace | 600°C |
| Gas Chromatograph | 7890A GC (Agilent Technologies, Inc.) |
| Mode | Split mode (100:1) |
| Column | DB-5msUI (Agilent Technologies, Inc.) 15m x 0.25mm, 0.25μm |
| Oven Temperature | 50°C(1min)-30°C/min -330°C(1.7min) |
| Carrier flow | He: 1.0mL/min |
| TOFMS | JMS-T200GC(JEOL) |
| Ionization | EI+:70eV, 300μA FI+:-10kV, 6A Carbotec-5μm (CarboTech) |
| Mass Range | m/z 35-600 |
| msFineAnalysis | (JEOL) |
| Mode | Variance component analysis |
| Number of data | n=5 |
| p-value | ≦5% |
| Fold change | ≧1.5 |
Results
Figure 1 shows a screenshot of the differential analysis results for the vinyl acetate resins by using msFineAnalysis. In total, 125 peaks were detected. The breakdown of the differential peaks are: 10 peaks that are characteristic of Sample A (peak ID [024] Diethylene Glycol Dibenzoate, etc.), 15 peaks that are characteristic of Sample B ([016] 2,2,4-Trimethyl-1,3-pentadioldiolMonoisobutyrate, etc.), and 42 peaks did not show a difference between sample A and B. Additionally, there were 58 peaks that were judged to have no statistical reproducibility (gray in volcano plot, “other” in classification results).
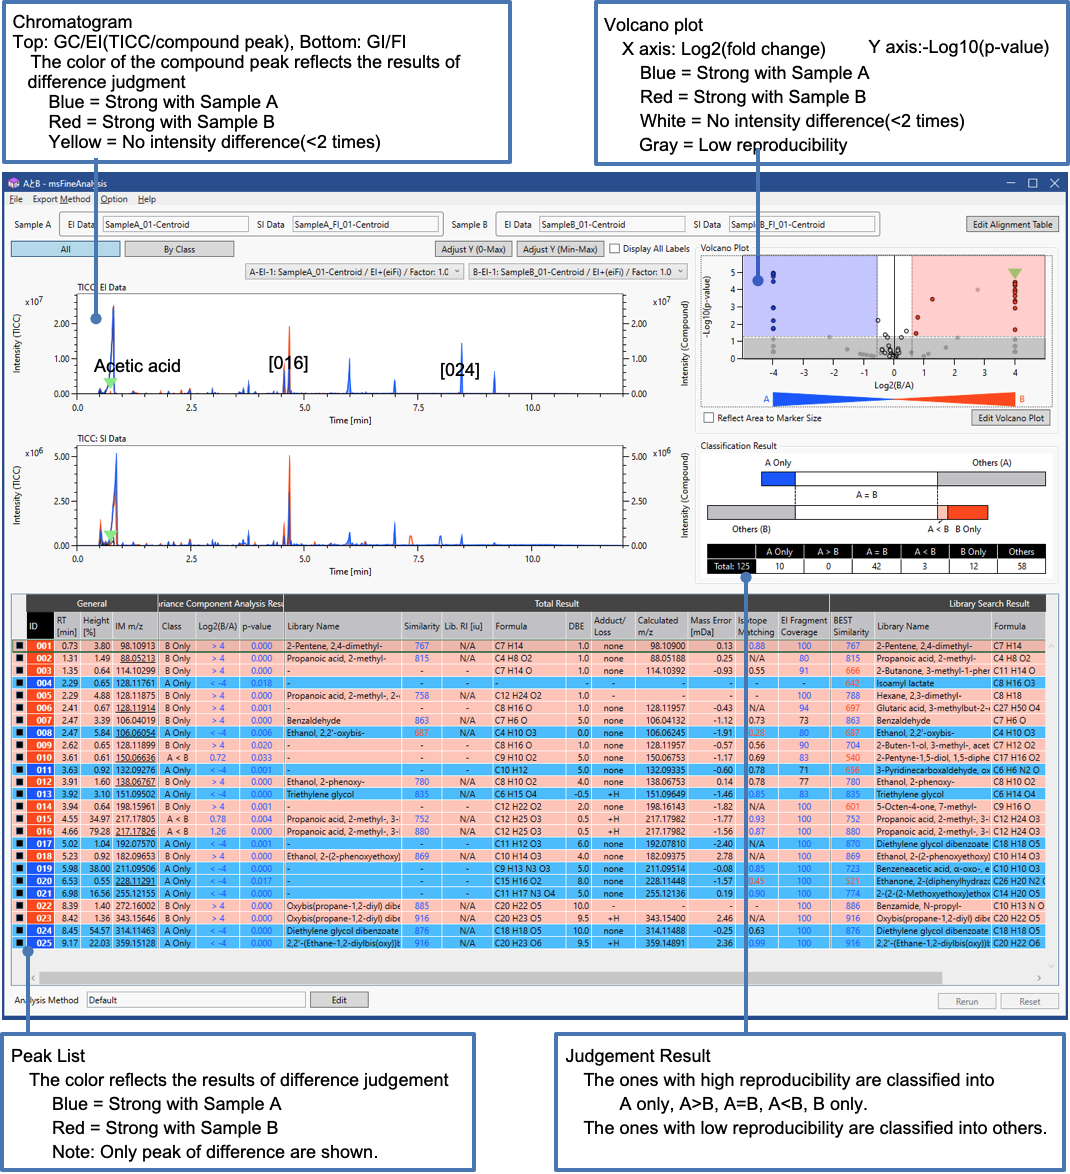
Figure 1. Screenshot of msFineAnalysis
Figure 2 shows a screen shot of individual compound analysis result for peak ID [015]. The first library search candidate (similarity 857) indicated 2,2,4-trimethyl-1,3-pentadioldiisobutyrate (C16H30O4:molecular weight 286). However, since m/z 217 was detected as the base peak in the FI mass spectrum, it was decided that it is more likely the protonated molecule [M+H]+ for the second candidate (similarity 755) of 2,2,4-trimethyl-1,3-pentadiol Monoisobutyrate (C12H24O3:molecular weight 216).
Consequently, the second candidate was selected as the result appropriate choice for the integrated analysis. This example shows that using EI/SI data together, msFineAnalysis makes it possible to obtain highly reliable results.
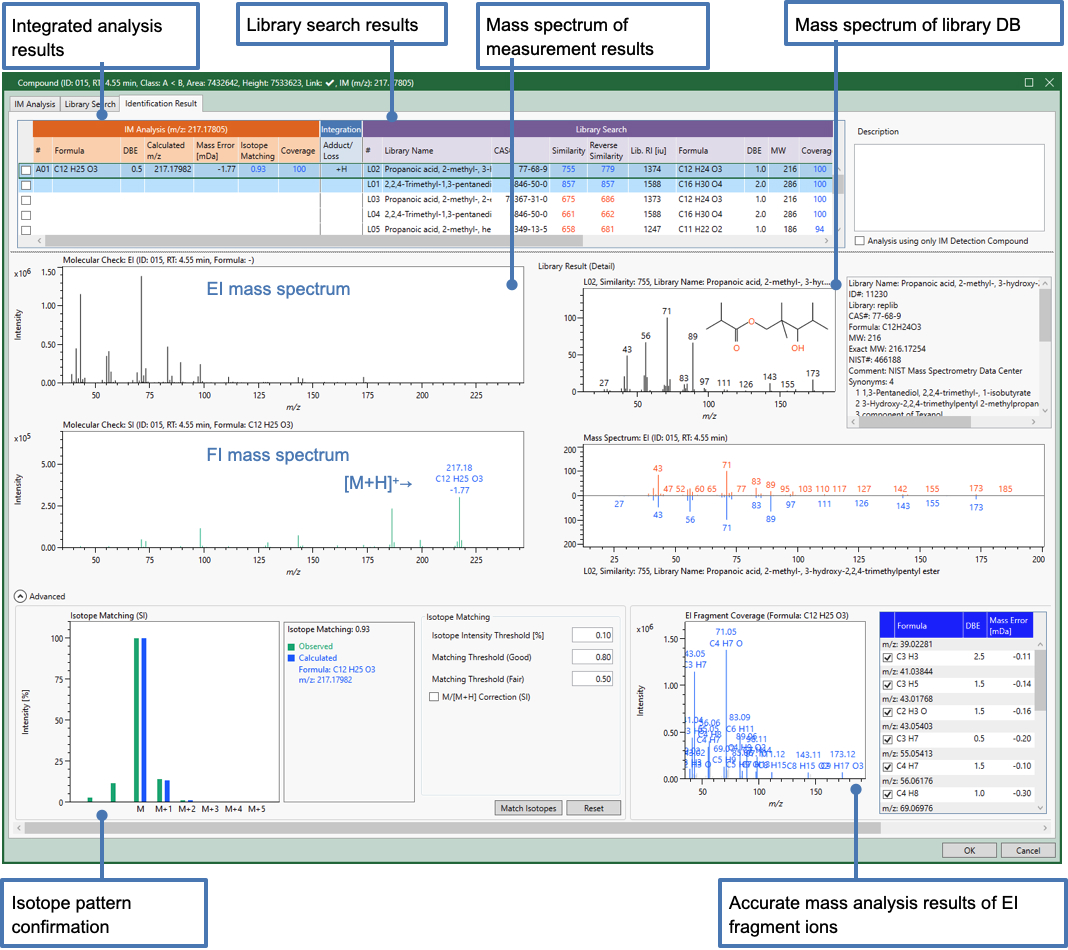
Figure 2. Screenshot of compound window
Summary
The differential analysis function of msFineAnalysis Ver3 enabled us to easily obtain the differential information between two Vinyl Acetate samples. Also, because EI and SI data are analyzed together, msFineAnalysis produces highly reliable qualitative analysis results that can be quickly evaluated by the analyst. And finally, this software in combination with GC-HRTOFMS is especially effective for pyrolysis methods in which many of the compounds produced are not registered in library databases.
- Please see the PDF file for the additional information.
Another window opens when you click. 
PDF 679.3KB
Related Products
Are you a medical professional or personnel engaged in medical care?
No
Please be reminded that these pages are not intended to provide the general public with information about the products.