Differential Analysis Function in msFineAnalysis Ver 3 (1)
MSTips No.327: Analysis of Epoxy Resin by using Headspace and Pyrolysis-GC-TOFMS
Introduction
As the performance of mass spectrometers has improved, the demand for differential analysis of trace components in materials has increased. To address this trend, we have added a new differential analysis function to msFineAnalysis, our automated qualitative analysis software specifically designed for GC-HRTOFMS data. This application note describes the workflow used by msFineAnalysis for differential analysis by analyzing epoxy adhesives data measured by headspace(HS)-GC-TOFMS and pyrolysis(Py)-GC-TOFMS.
Differential Analysis Workflow
The differential analysis workflow is shown at the very top of Figure 1. When measuring samples for a simple comparison (n=1), each sample is measured twice: once by GC/EI, once by GC/SI for a total of 4 GC measurements. For statistical analysis (n=3, 5), GC/EI measurements are performed for each sample more than once and the GC/SI measurement is performed only once for each (for two samples, n=5, then the total number of GC measurements would be 12). Afterwards, the GC/EI and GC/SI data are loaded into msFineAnalysis, and then following the GUI instructions, the integrated analysis result are output as a color coded report. The final step requires the analyst to confirm the results.
The msFineAnalysis integrated analysis work flow is shown in the bottom section of Figure 1. The first step for this workflow is chromatogram peak detection (peak deconvolution) for the measured data. During this process, minor peaks are detected that may not be obvious in the TICC.
Next, data alignment and variance component analysis are performed for the detected EI peaks based on their retention times (R.T.) as well as the similarity of their mass spectra. The differences are compared using intensity ratios between samples and reproducibility. Afterwards, both the EI and SI data are analyzed by using the integrated analysis workflow used for previous versions of msFineAnalysis. This analysis workflow consists of EI library database searches, molecular ion searches in the SI data, and accurate mass analysis of both EI and SI data. For a detailed explanation of this EI/SI integrated analysis workflow, please see MSTips No. 275. An example of the msFineAnalysis Ver3 differential analysis results will be examined in the following pages.
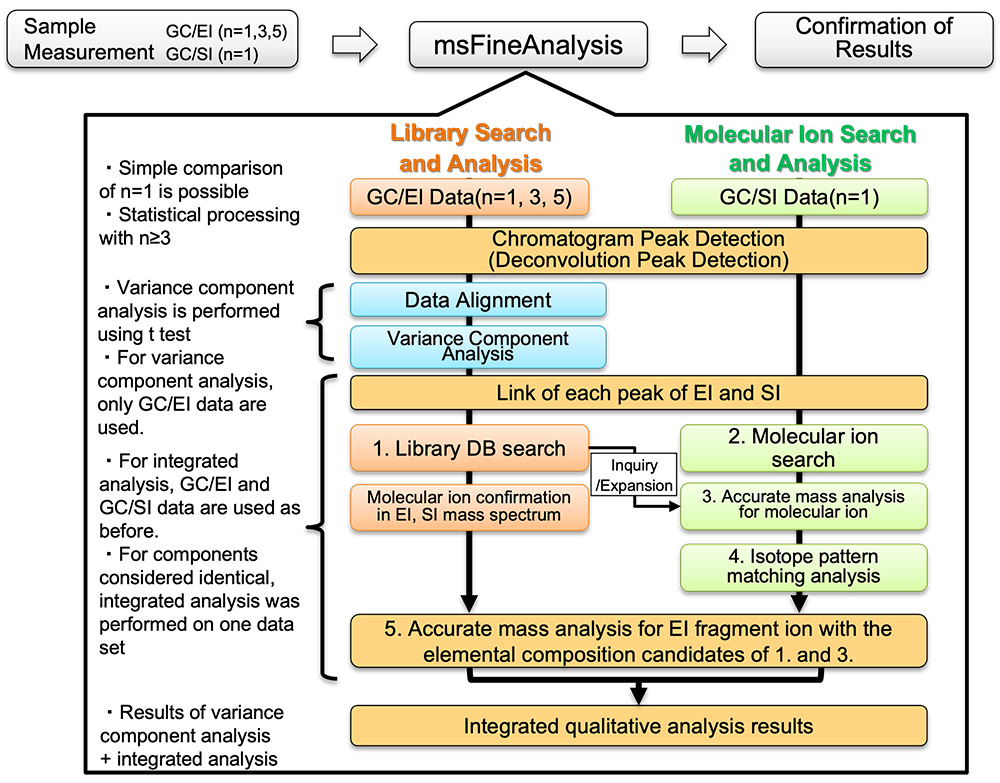
Figure 1. Analysis flow using msFineAnalysis
Measurement
Two different commercially available epoxy adhesives (A, B) were used as samples. These samples were cured prior to analysis. HS-GC-MS and Py-GC-MS were used for the measurements. For HS-GC-MS, the samples were heated at 50°C, and the thermally-desorbed volatile components were analyzed. For Py-GC-MS, the samples were heated at 600°C and the pyrolysis products were analyzed. The ionization methods used for these measurements were EI and FI (Field Ionization) as hard and soft ionization, respectively. In order to conduct statistical analysis, the GC/EI measurements were performed with n=5. The parameters used to perform differential analysis were the p-value (an index: the smaller the p-value, the higher the statistical reproducibility) ≦5% and fold change (intensity ratio between samples) ≧2. The detailed measurement conditions are shown in Table 1.
Table 1. Measurement and analysis conditions
| HS-GC-MS | |
|---|---|
| Headspace sampler | MS62070STRAP (JEOL) |
| Sample amount | 500mg |
| Mode | Trap |
| Sample heating | 50°C, 30min |
| Gas Chromatograph | 7890A GC (Agilent Technologies, Inc.) |
| Mode | Split20:1 |
| Column | InertCap-WAX 60m x 0.32mm, 0.5μm (GL Sciences Inc) |
| Oven | 40°C(3min)→10°C/min →200°C(5min) |
| Carrier gas | He, 1.5mL/min |
| TOFMS | JMS-T200GC |
| Ionization | EI+:70eV, 300μA FI+:-10kV, 40mA |
| Monitor ion range | m/z 35-800 |
| msFineAnalysis | (JEOL) |
| Mode | Variance component analysis |
| Number of data | n=5 |
| p-value | ≦5% |
| Fold change | ≧2 |
| Py-GC-MS | |
|---|---|
| Pyrolyzer | EGA/PY-3030D (Frontier Laboratories Ltd) |
| Sample amount | 0.2mg |
| Mode | Single shot |
| Furnace | 600°C |
| Gas Chromatograph | 7890A GC (Agilent Technologies, Inc.) |
| Mode | Split100:1 |
| Column | ZB-5MSi 30m x 0.25mm, 0.25μm (Phenomenex Inc) |
| Oven | 40°C(2min)→10°C/min →320°C(15min) |
| Carrier gas | He, 1mL/min |
| TOFMS | JMS-T200GC |
| Ionization | EI+:70eV, 300μA FI+:-10kV, 40mA |
| Monitor ion range | m/z 35-800 |
| msFineAnalysis | (JEOL) |
| Mode | Variance component analysis |
| Number of data | n=5 |
| p-value | ≦5% |
| Fold change | ≧2 |
HS-GC-MS Measurement Result
Figure 2 shows a screenshot of the differential analysis results for the headspace samples using msFineAnalysis. The top left of the screen shows the TICC chromatograms as well as the compound peaks detected by deconvolution. The color of the compound peak reflects the result from the difference analysis. The blue color indicates that this particular analyte is strongly associated with Sample A while a red color indicates a strong association with Sample B. The volcano plot at the right top of the screen indicates the intensity difference between samples in the X axis and the statistical reproducibility in the Y axis, enabling comprehensive confirmation of the detected peaks. The right center of the screen shows the classification results, thus allowing for a concrete understanding of the total number of detected peaks as well as a breakdown of how the peaks relate to each sample. The peak list at the bottom shows a color coded table with the integrated analysis results for the detected peaks, thus allowing the analyst to easily correlate which analyte is more strongly associated with a particular sample.
The table at the bottom shows that 15 peaks were detected in total. A breakdown of the peak differences shows that 2 peaks (peak ID [003] butyl ether and [009] butanol) are characteristic of Sample A, 11 peaks are characteristic of Sample B ([001,002] low molecular weight cyclic siloxanes, etc.), and two peaks that have no intensity difference between Sample A and B ([004] toluene and [013] cyclohexasiloxane). Among these differences, the low molecular weight cyclic siloxanes are known to cause problems such as contact faults when used in electric products because of its high volatility and ability to create an oxide insulator film.
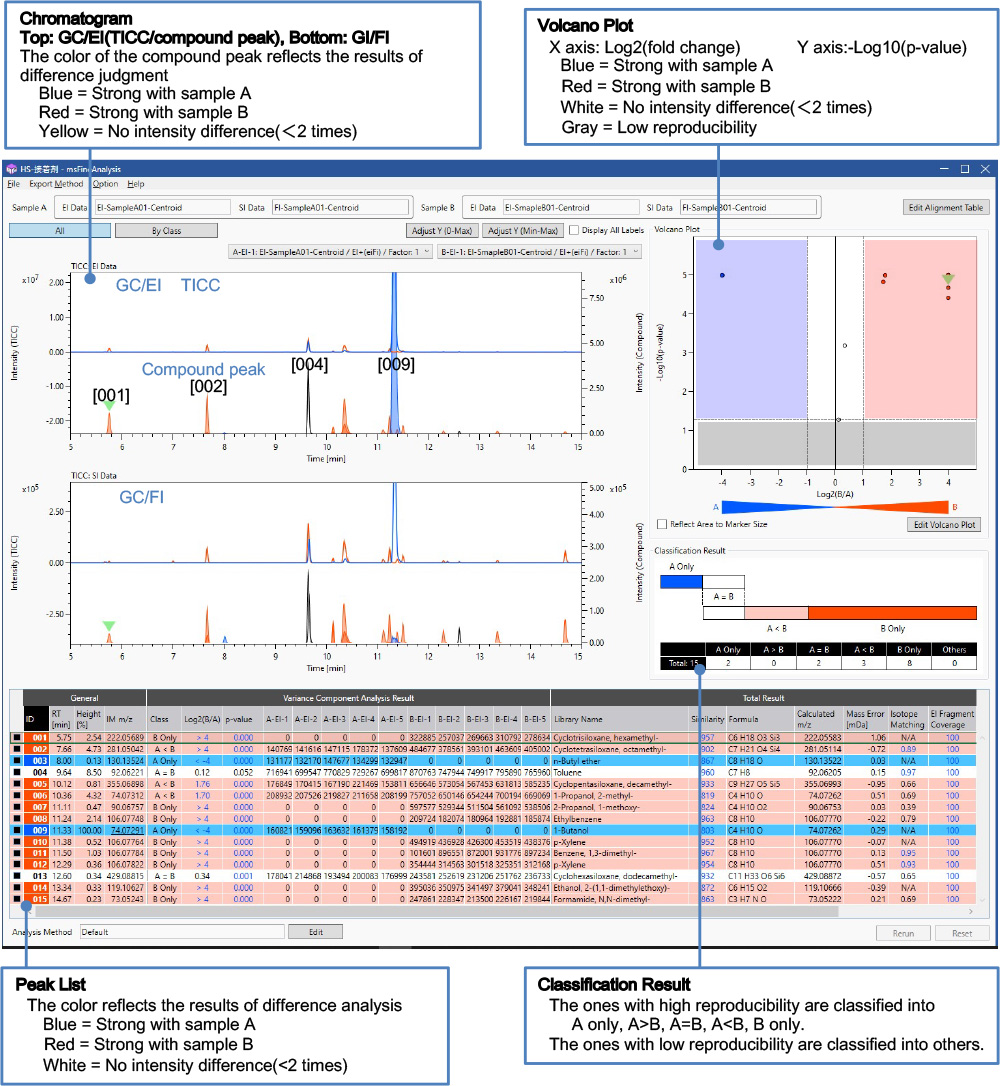
Figure 2. Screenshot of msFineAnalysis (HS-GC-MS)
Py-GC-MS Measurement Result
Figure 3 shows a screenshot of the differential analysis results for the pyrolyzed samples using msFineAnalysis. In total, 120 peaks were detected for these samples. A breakdown of the peak differences shows that 28 peaks were characteristic of Sample A (peak ID [044] Dibutylphthalate, etc.), 23 peaks were characteristic of Sample B ([030] p-isopropenylphenol, [048] Bisphenol A, etc.), and 20 peaks that showed no intensity differences between Sample A and Sample B ([018] phenol, etc.). Additionally, there were 49 peaks observed that were judged to have no statistical reproducibility (gray in volcano plot, “other” in classification results). Dibutylphthalate(DBP) is a phthalate ester that is under a RoHS directive. Bisphenol A was detected in both samples and is a base compound for an epoxy adhesive. However, because it was detected in Sample B at two times stronger intensity than Sample A, it was classified as a peak of difference between the samples.
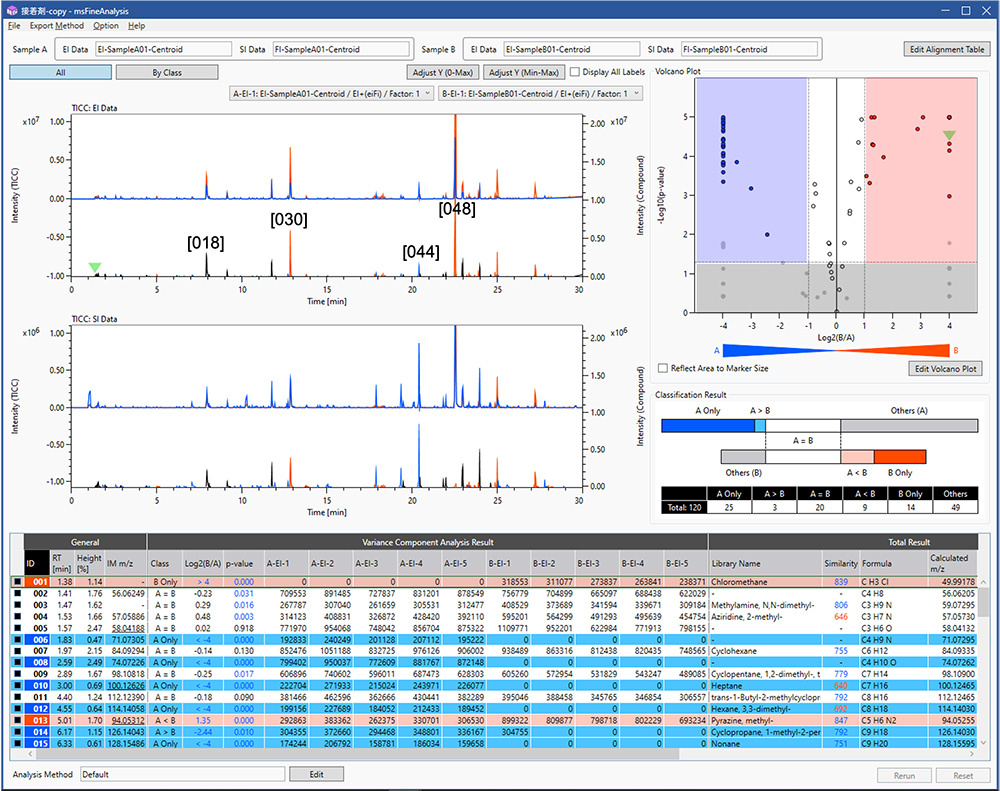
Figure 3. Screenshot of msFineAnalysis (Py-GC-MS)
Summary
The differential analysis function in MsFineAnalysis Ver3 enabled us to easily acquire information on the difference between two epoxy adhesive samples. Furthermore, these results show that msFineAnalysis enables not only reduces analysis time due to automation, but also produces highly-reliable qualitative analysis resulting from peak deconvolution, statistical analysis, and EI/SI integrated analysis.
- Please see the PDF file for the additional information.
Another window opens when you click. 
PDF 554.2KB
Related Products
Are you a medical professional or personnel engaged in medical care?
No
Please be reminded that these pages are not intended to provide the general public with information about the products.