Qualitative Analysis of Chemical Components in an Herbal Medicine
MS Tips No. 433
Introduction
Herbal medicines contain multiple effective ingredients, making it difficult to study them systematically compared to Western drugs. Initial steps in examining effective ingredients of an herbal medicine include qualitative analysis of chemical components contained in its raw material.
For this application, gas chromatography - mass spectrometer (GC-MS) is widely used. However, typical database search based on GC-MS often fails to fully identify such chemical components.
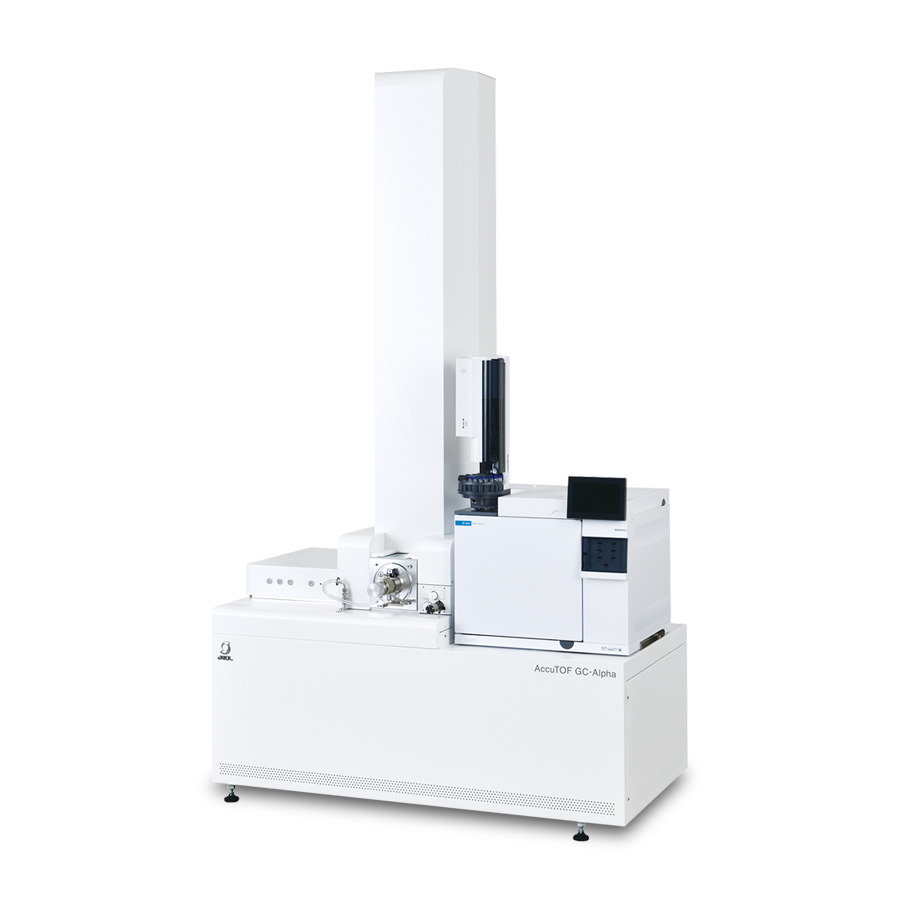
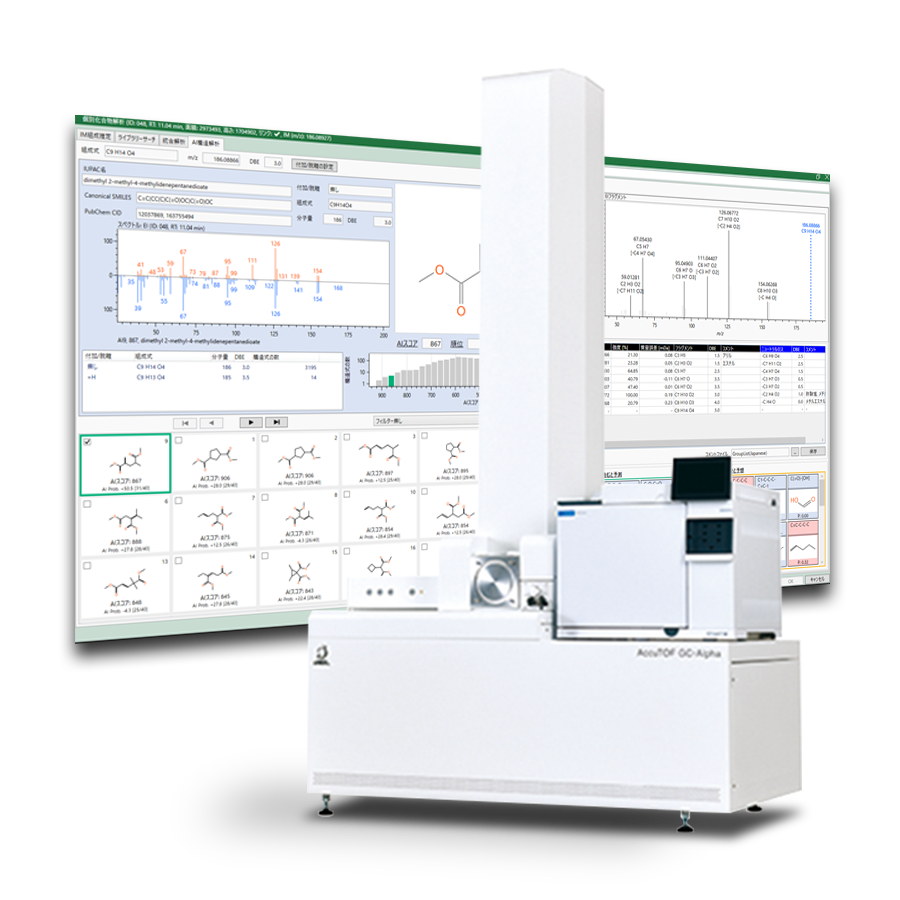
JEOL’s GC-high resolution mass spectrometer (GC-HRMS), JMS-T2000GC, is capable of: 1) high precision mass analysis; 2) detection of molecular and fragment ions through electron ionization (EI) and soft ionization (SI); and 3) auto analysis of acquired data by msFineAnalysis AI to determine chemical formulas and predict chemical structures. In this work, we identified the chemical components contained in an herbal medicine using a JMS-T2000GC and msFineAnalysis AI.
Measurement
Dry wild chrysanthemum flowers (Flos Chrysanthemi Indici),
a commercial herbal medicine, was used as a sample. Following the steps shown in Figure 1, 1.1 g of the sample was immersed in 10 mL of ethanol (≥99.5%) and subjected to ultrasonic extraction at room temperature for 30 minutes.
The supernatant of the extracted liquid was collected, added anhydrous sodium sulfate, and let stand for 30 minutes.
The resulting solution was injected to the GC-HRTOFMS. EI and FI (Field Ionization) were used as ionization methods for GC-HRTOFMS measurement, and msFineAnalysis AI was subsequently used for analysis of the acquired data. Table 1 shows the measurement conditions.
Results and Discussion
Figure 2 shows the total ion current chromatograms (TICCs) of EI and FI. A total of 141 components were detected, including eucalyptol, camphor, borneol, and bornyl acetate marked by ● in the figure.
These 4 components are reported to be active compounds(1).
For 81 components, their chemical formulas predicted from the molecular ions did not agree with the results of NIST database search.
However, msFineAnalysis AI contains an AI database of EI mass spectra estimated from the chemical structures in addition to the NIST database. The 81 components, when examined against the AI database, turned out to be the compounds, which were in good agreement with EI fragment ions patterns and had the chemical formulas predicted by molecular ions. Figure 4 shows the results. These peaks were identified primarily as terpenes, terpenoids, fatty acids, alkanes, and sterols. The figure shows their groups and detection ranges.
Table 1. Measurement conditions
| GC-HRMS | |
|---|---|
| Gas Chromatograph | 8890 GC (Agilent Technologies, Inc.) |
| Mode | Splitless |
| Inlet temperature | 280 °C |
| Column | DB-5MS, 30 m x 0.25 mm, 0.25
μm (Agilent Technologies, Inc.) |
| Oven | 50 °C (1 min) → 10 °C/min → 320°C (10 min) |
| Carrier gas | He, 1.0 mL/min |
| Injection volume | 1 μL |
| TOFMS | JMS-T2000GC (JEOL Ltd.) |
| Ionization | EI+: 70 eV, 300 μA |
| FI+: -10 kV, 40 mA | |
| Monitor ion range | m/z 10-800 |
| Analysis software | msFineAnalysis AI (JEOL Ltd.) |
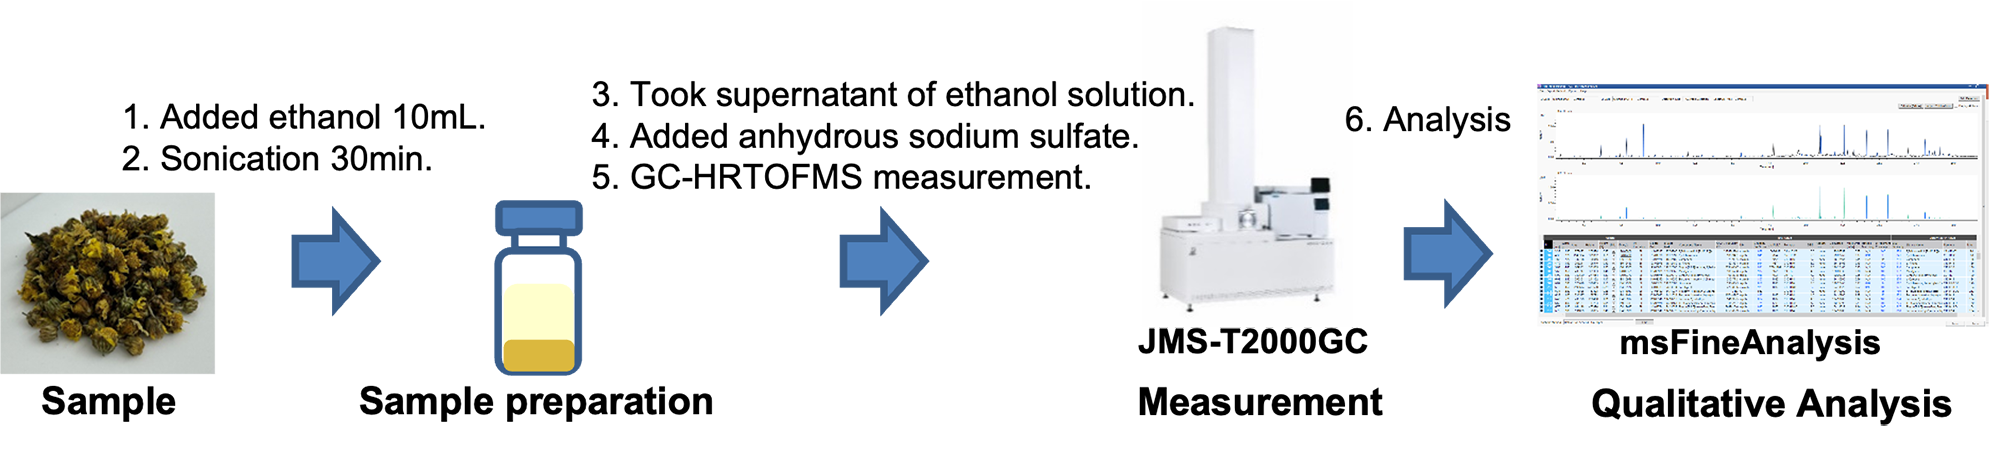
Figure 1. Experimental process
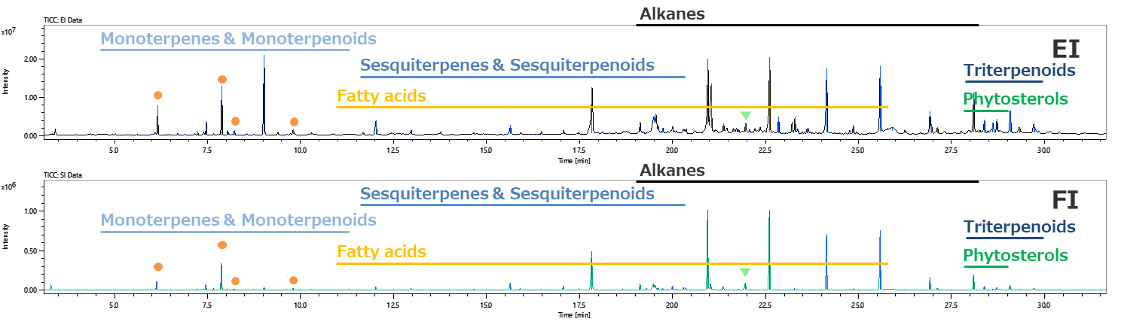
Figure 2. EI and FI TICCs of Flos Chrysanthemi Indici ethanol extract.
Figures 3 and 4 respectively show the mass spectra and predicted chemical structure of the peak marked by ▼ in Figure 2, which was detected at a retention time of 21.96 minutes.
Its chemical formula was estimated to be C17H18O5 from the exact mass verified in the FI mass spectrum in Figure 3. NIST database search for the EI mass spectrum did not result in any compounds showing a similarity of 700 or more.
Meanwhile, Figure 4 shows the results of msFineAnalysis AI structural analysis of (2R)-4,7-dimethyl-1-propan-2-yl-1,2,3,5,6,8a-hexahydronaphthalen-2-ol. The AI-predicted mass spectrum and measured mass spectrum of the compound have high levels of AI score and AI probability, providing effective structural information.
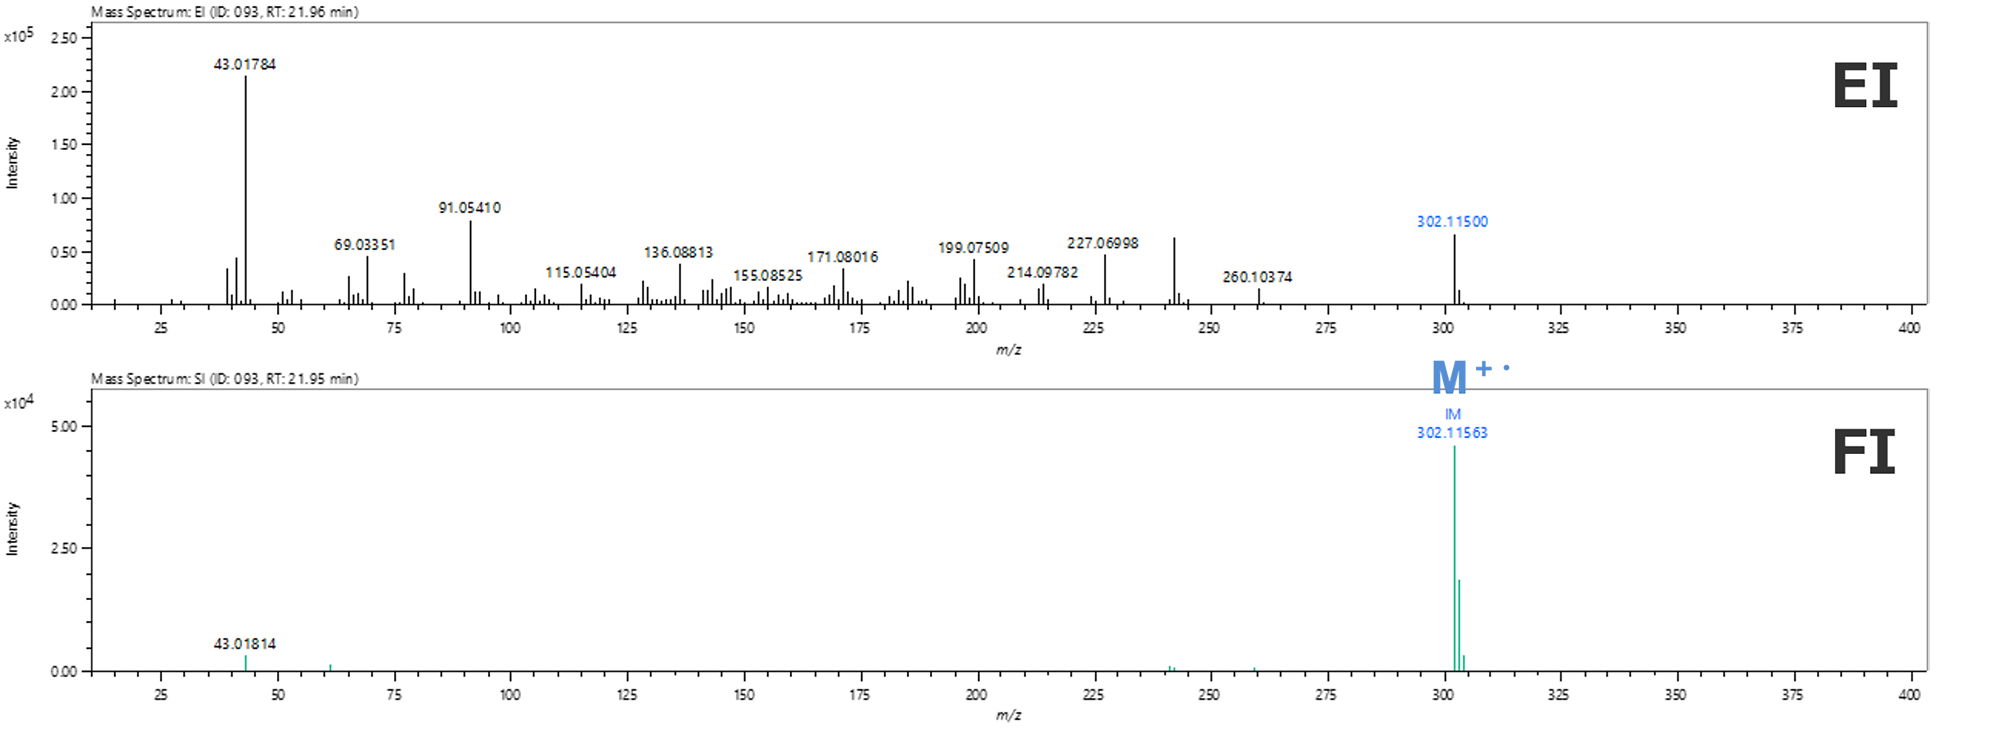
Figure 3. EI and FI mass spectra of the component at a retention time of 21.96 minutes in FlosChrysanthemi Indici ethanol extract.
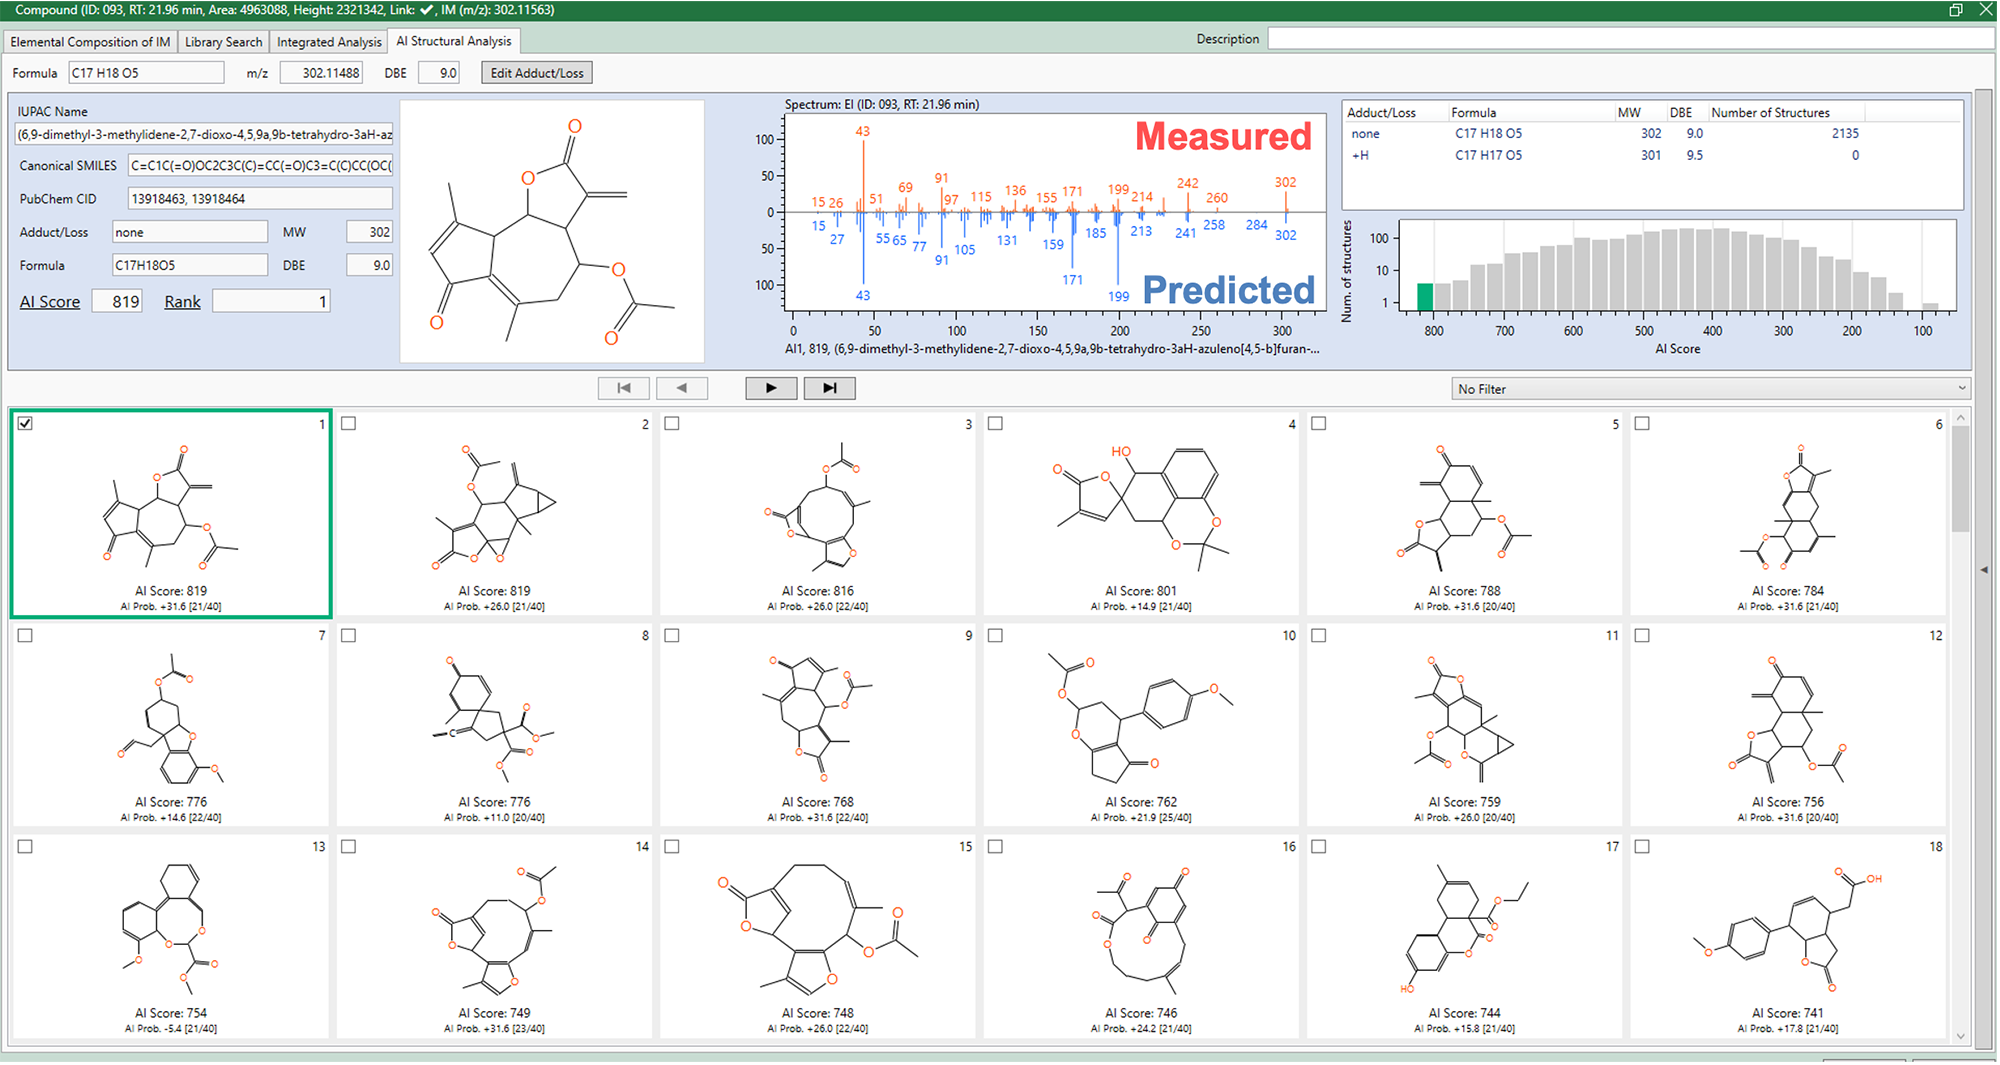
Figure 4. Structural Analysis results of the component at a retention time of 21.96 minutes by msFineAnlaysis AI.
Summary
The results of this work demonstrates the effectiveness of msFineAnalysis AI. It is a powerful and efficient tool for qualitative analysis, saving time and labor in chemical formula determination and chemical structure prediction. Accurate qualitative analysis of herbal components is useful for discovery and quality control in the field of herbal medicine. The GC-HRMS system with msFineAnalysis AI is expected to be used for wide-ranging qualitative analysis of chemical components in natural resources including herbal medicines.
References
[1] Jiesheng Ye,. Chemical Papers, 2009, 63, 5, 506-511. DOI: 10.2478:-009 to -0056:-0
Solutions by field
Related products
Are you a medical professional or personnel engaged in medical care?
No
Please be reminded that these pages are not intended to provide the general public with information about the products.