Differential analysis in two different types of water-based ink products using msFineAnalysis iQ
MSTips No.396
Introduction
Usually, qualitative analysis by GC-QMS is generally performed by library database (DB) search in the measurement data of electron ionization (EI) method. However, when qualitative analysis is performed using only the similarity index with the library spectrum, a plurality of significant candidates may be obtained depending on the compound, or an erroneous candidate may be selected as the identification result. Therefore, it is effective to confirm molecular ions by soft ionization (SI) method including photoionization (PI) method.
In this case, two types of measurement data, the EI method and the SI method, are obtained for a single sample, making data analysis more complicated. Therefore, an integrated qualitative analysis software that can quickly and automatically analyze the two types of data is desired. This is the reason why we have developed msFineAnalysis iQ.
In our previous report, MSTips No. 395, we reported an example of integrated qualitative analysis using msFineAnalysis iQ for major constituents in water-based ink. Furthermore, in this report, we report an example of difference analysis in two different types of water-based ink products.
Experimental
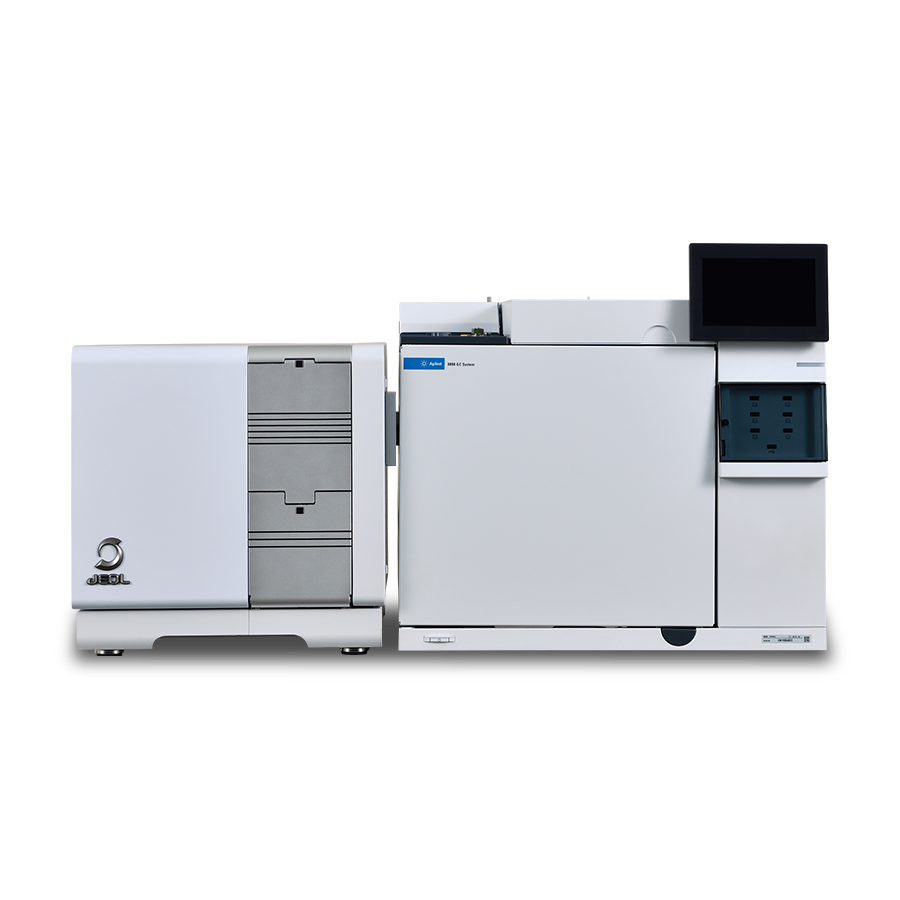
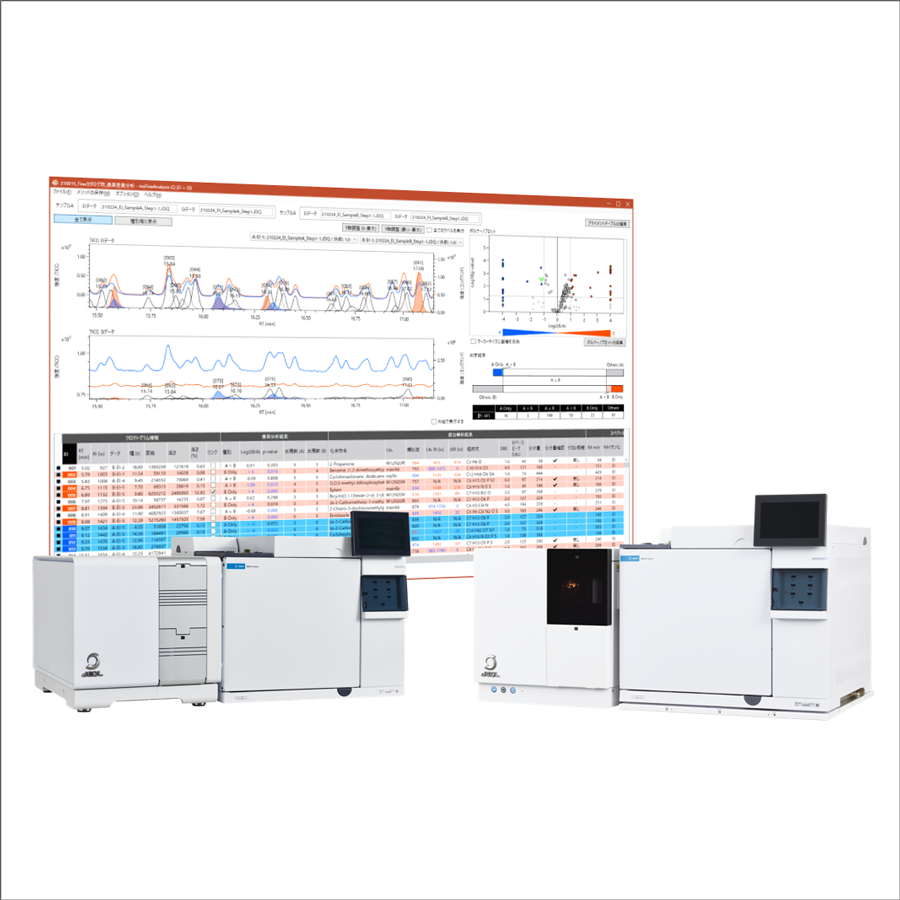
Two water-based inks for inkjet printers, magenta and cyan, were used as samples. A GC-QMS (JMS-Q1600GC UltraQuad™ SQ-Zeta, manufactured by JEOL Ltd.) was used for the measurement. 1 μL of the undiluted sample was injected into the GC, and the EI method and the PI method were used as ionization methods. Table 1 shows the detailed measurement conditions. Analysis was performed using the difference analysis function of msFineAnalysis iQ (manufactured by JEOL Ltd.), an integrated qualitative analysis software dedicated to GC-QMS.
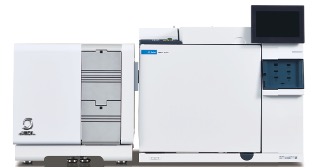
JMS-Q1600GC UltraQuadTM SQ-Zeta
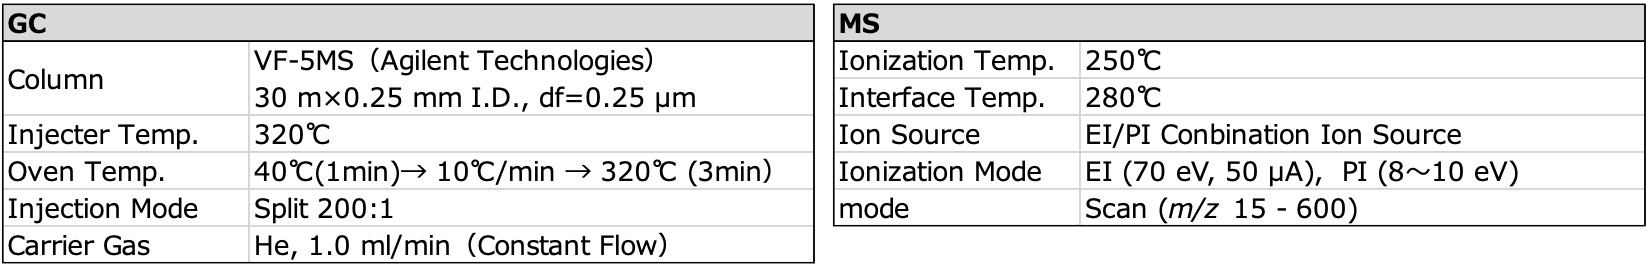
Table 1 Measurement condition
Result and Discussion
Figure 1 shows the GC/MS measurement results of water-based inks (magenta and cyan). The upper row is the total ion current chromatogram (TICC) of magenta and the lower row of cyan. For both aqueous inks, the two peaks with early elution times were presumed to be water as solvent and isopropyl alcohol (IPA) as penetrant. In addition, the broad peak detected around 9 minutes retention time was glycerin as a drying inhibitor. And then, ''Surfynol 104'', a type of surfactant intended for wetting/penetrating, foaming/defoaming functions in water-based ink, was also detected.
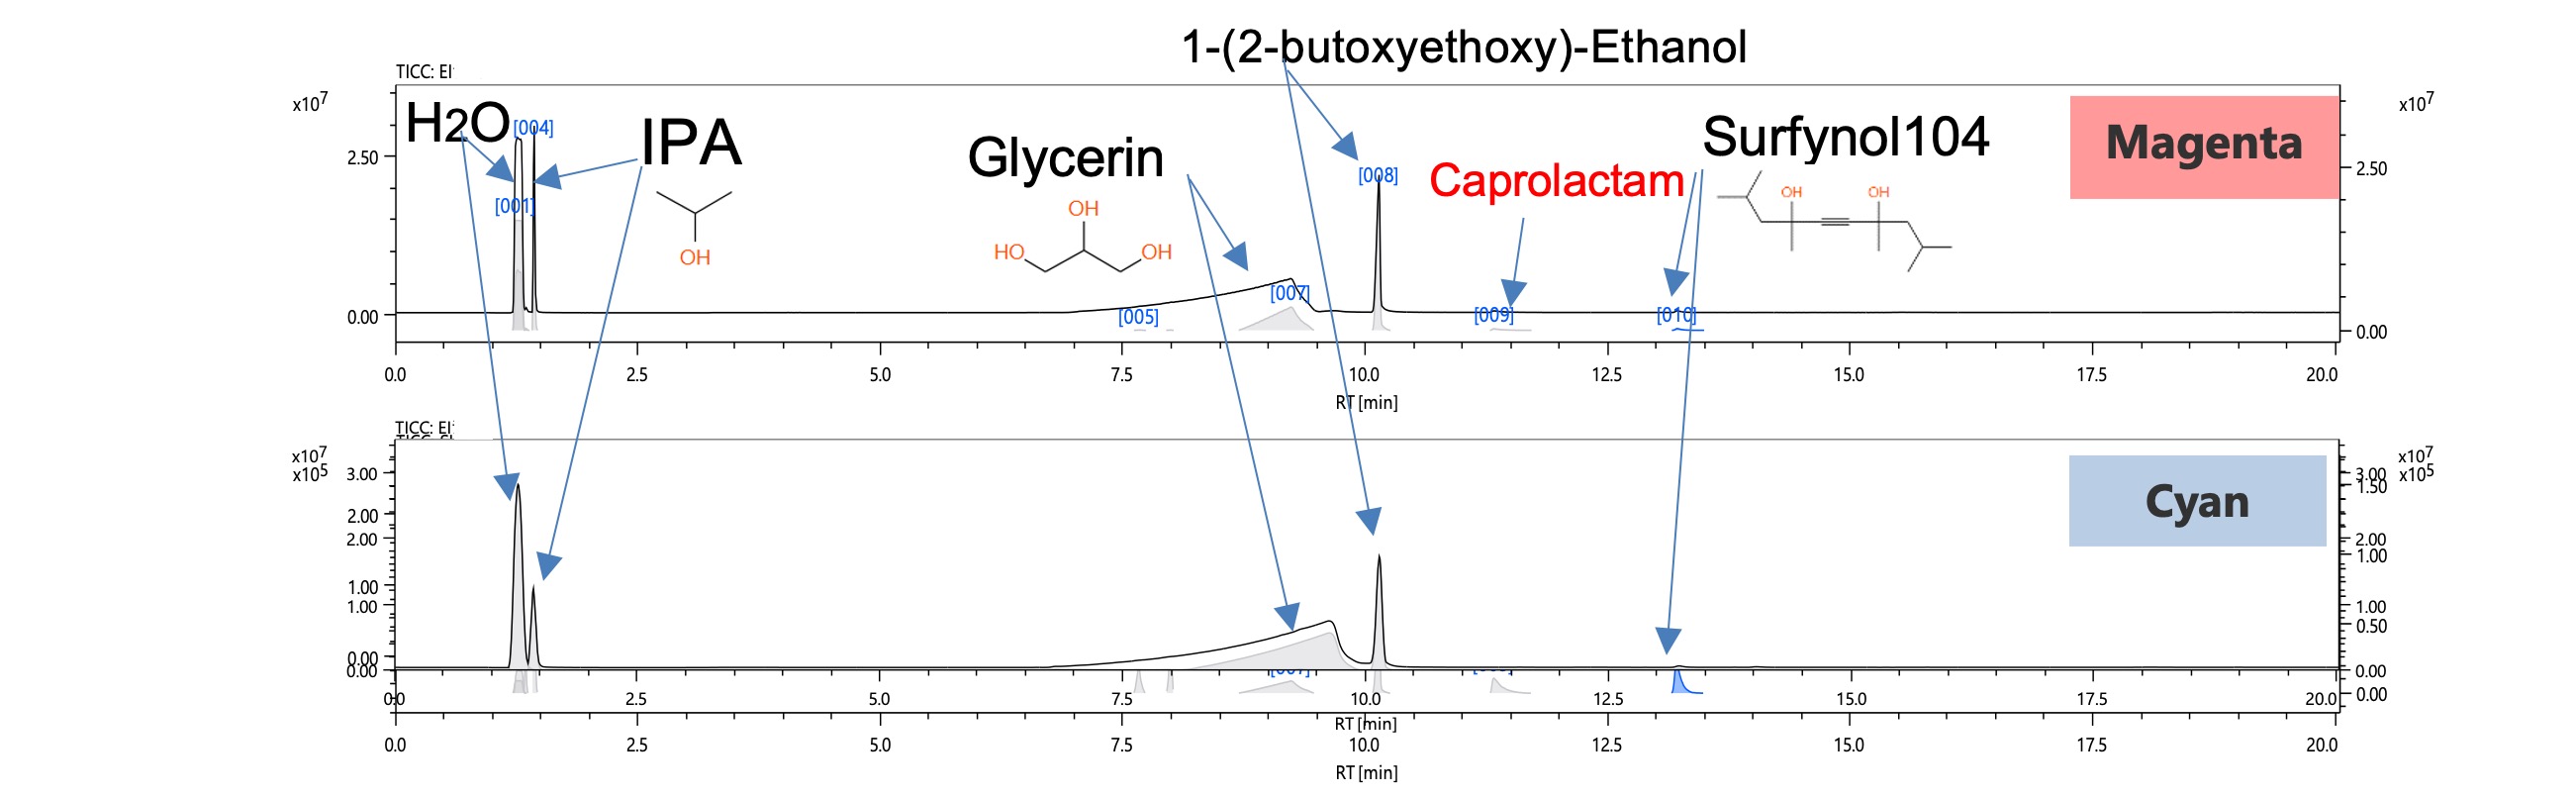
Figure 1 Total ion current chromatograms
Figure 2 shows TICC enlargements and volcano plots for retention times from 5 to 13 minutes obtained by the difference analysis function of msFineAnalysis iQ. A number of minute peaks were detected overlapping with the broad peak of glycerol at a retention time of around 9 minutes. Table 2 shows the integrated analysis result list. From these results, 11 kinds of compounds were qualitatively obtained through both samples.
A volcano plot is a scatter plot that can visualize characteristic compounds between samples, with the intensity ratio (Log2(B/A)) on the horizontal axis and the statistical reproducibility (-Log10(p-value) on the vertical axis ) respectively. This time, the left area of the volcano plot shows the compounds specifically included in cyan and the right area in magenta. The compounds specifically contained in each sample were caprolactam for magenta, and four compounds for cyan, including ID: 005 "Ethanol, 2,2'-oxybis- (diethylene glycol)".
Figure 3 shows the mass spectrum of the peak of [ID:007]. An ion of m/z 121, presumed to be a molecular ion, could be detected on both EI and PI mass spectra. Table 3 shows the integrated analysis result list (top 5 candidates) by msFineAnalysis iQ. From this result, the peak [ID:007] was presumed to be "Benzenamine, N-ethyl- ". This compound was presumed to be a kind of solvent contained in water-based ink.
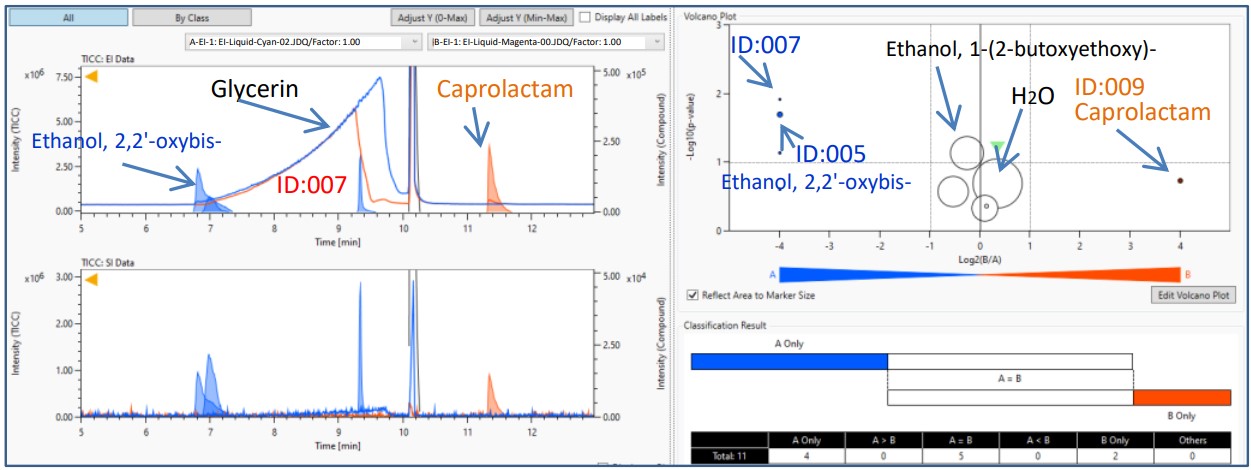
Figure 2 Volcano plot of variance compound analysis result
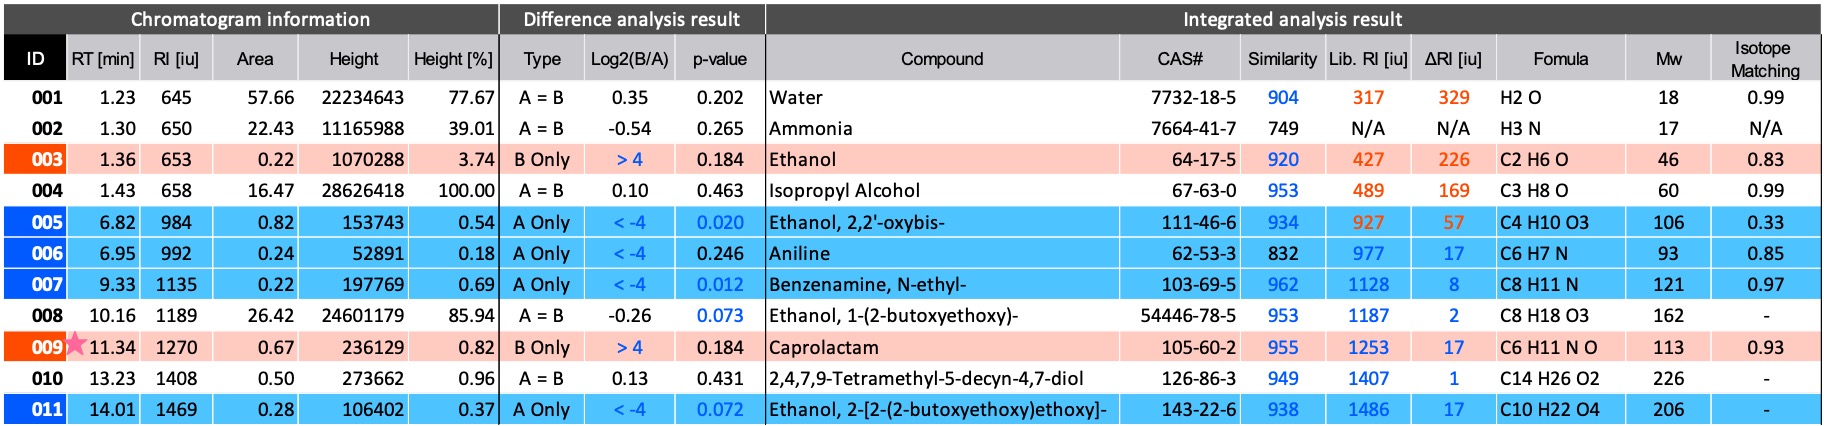
Table 2 Integrated qualitative analysis result of peak
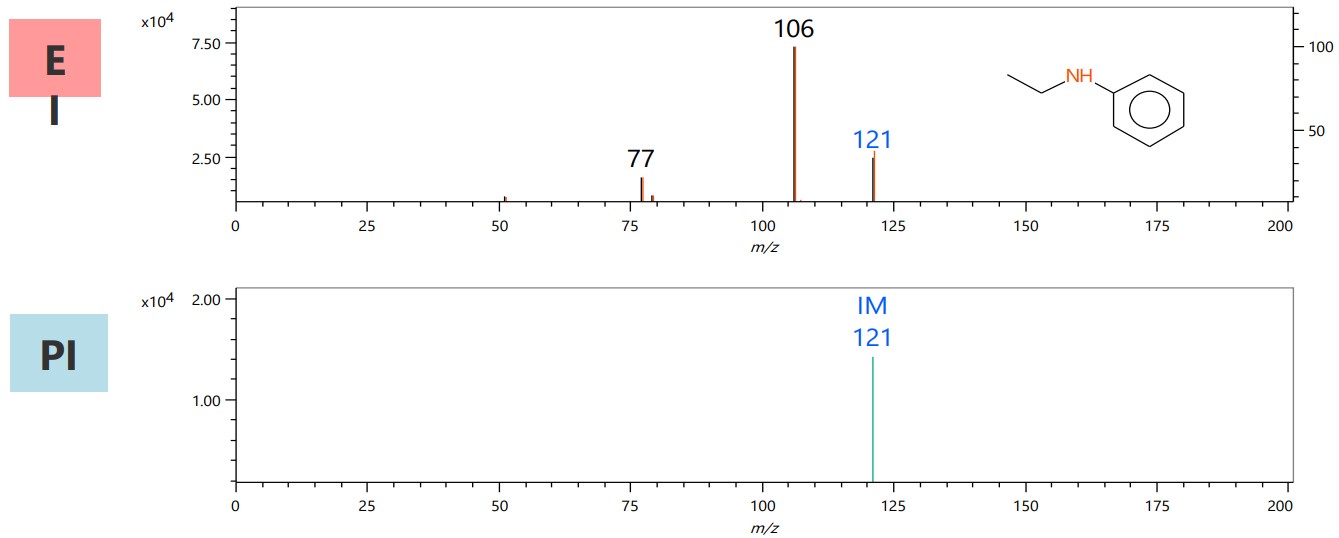
Figure 3 Mass spectra of peak [007]
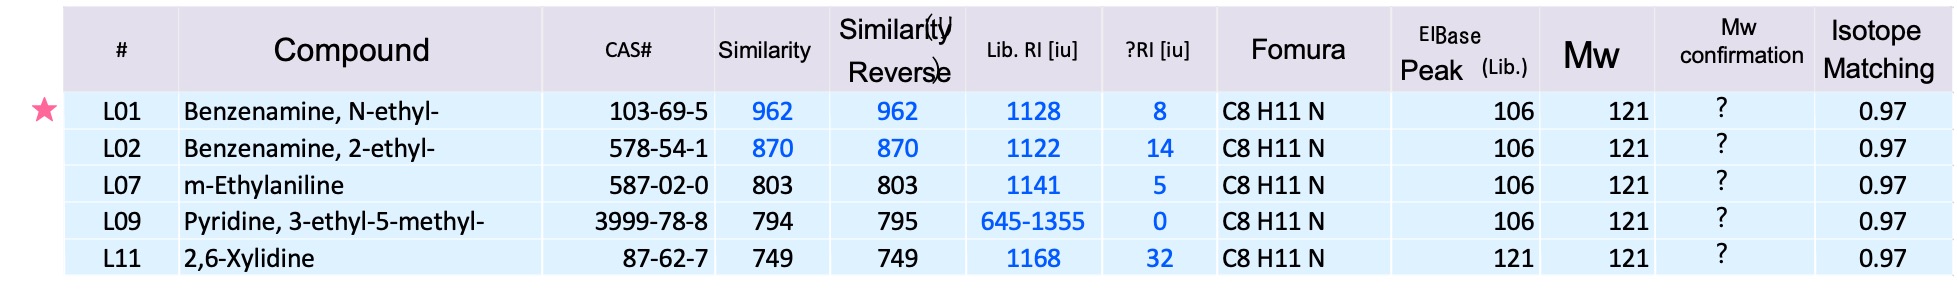
Table 3 Integrated qualitative analysis result of peak [007]
Conclusion
In this report, we reported an example of difference analysis by msFineAnalysis iQ for major constituents in two colors (cyan and magenta) of water-based inks. msFineAnalysis iQ uses not only library DB search but also multiple identification functions such as retention index and isotope matching, so highly accurate qualitative analysis is possible. This software is expected to improve qualitative accuracy and efficient analysis work in GC-QMS analysis.
Solutions by field
Related products
Are you a medical professional or personnel engaged in medical care?
No
Please be reminded that these pages are not intended to provide the general public with information about the products.