Integrated Qualitative Analysis of Additive Components in Adhesive by using a Py-GC-QMS and msFineAnalysis iQ
MSTips No.421
Introduction
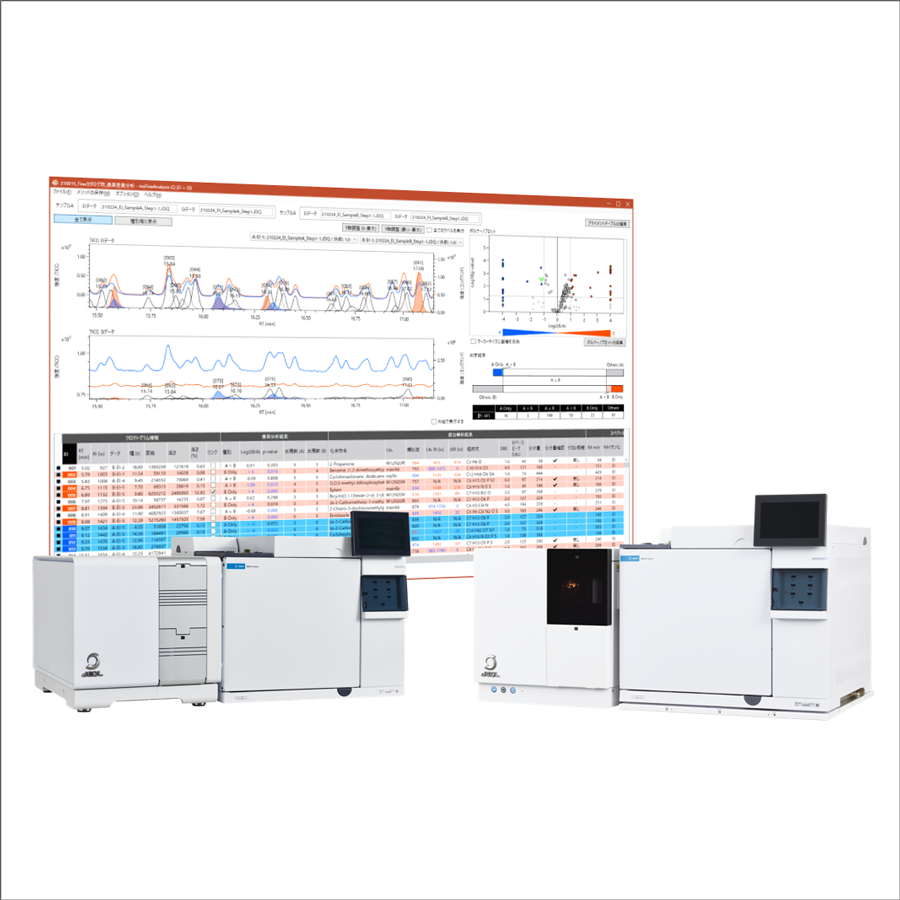
The gas chromatograph-quadrupole mass spectrometer (GC-QMS) is widely used as a qualitative / quantitative analyzer for volatile compounds. Qualitative analysis by GC-QMS is generally performed by searching the library database (DB) using the measurement data of the Electron Ionization (EI) . However, if qualitative analysis is performed using only the similarity with the library spectrum as an index, several significant candidates may be obtained depending on the compound, or erroneous candidates may be selected as the identification result. In such cases, confirmation of molecular ions by the soft ionization (SI) such as the photoionization (PI) is effective. In 2021, we released msFineAnalysis iQ, an integrated qualitative analysis software that automatically combines the analysis results of EI and SI methods measured by GC-QMS. The details of this software are introduced in MSTips No. 347 and 348. In this MSTips, we will introduce an analysis example of GC-MS measurement results for additive components in vinyl acetate adhesive using msFineAnalysis iQ.
Experimental
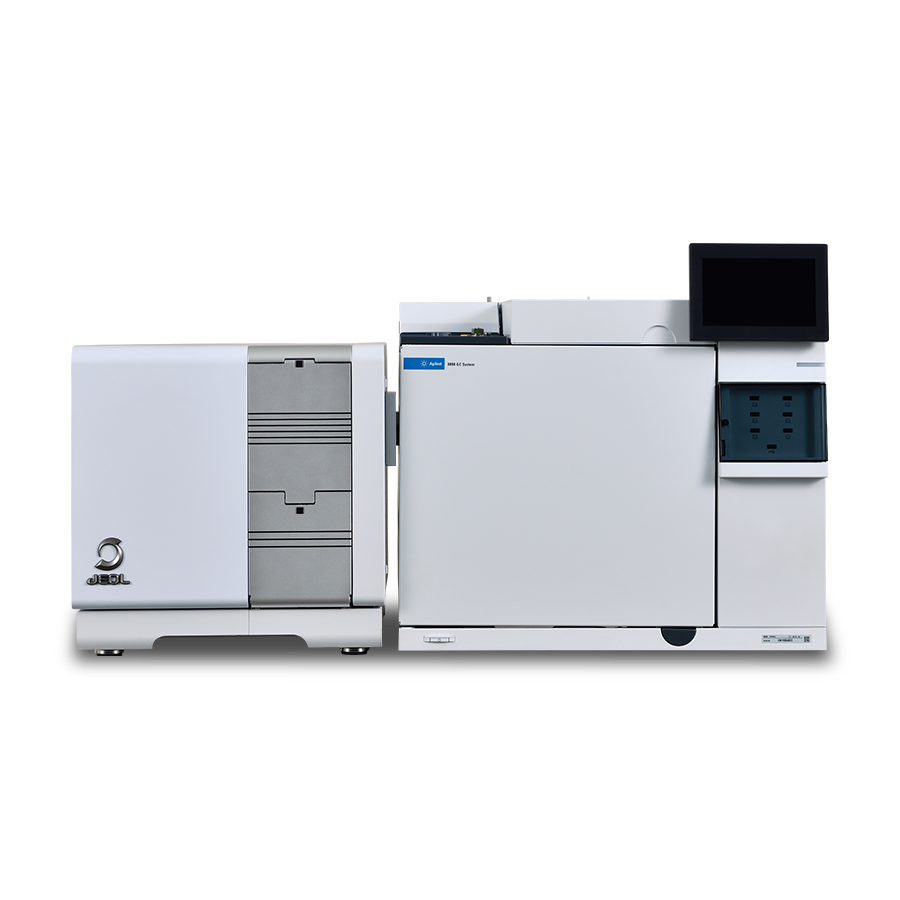
A commercially-available vinyl acetate adhesive was used as a test sample in this study. A GC-QMS (JMS-Q1600GC UltraQuad™ SQ-Zeta, JEOL Ltd.) was used for the measurement. We performed Py-GC-QMS measurements using both EI and photoionization (PI) modes with a combination EI/PI ion source. The qualitative data processing was performed with msFineAnalysis iQ (JEOL Ltd.). Detailed measurement conditions are shown in Table 1.
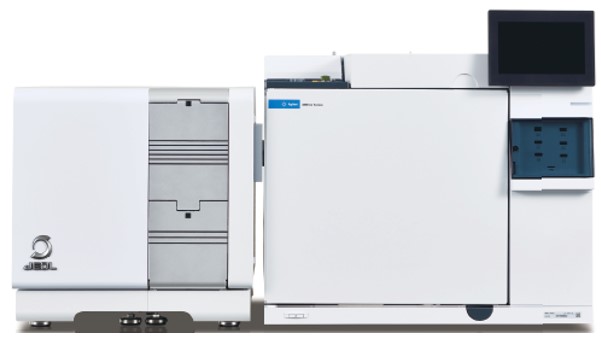
JMS-Q1600GC UltraQuadTM SQ-Zeta
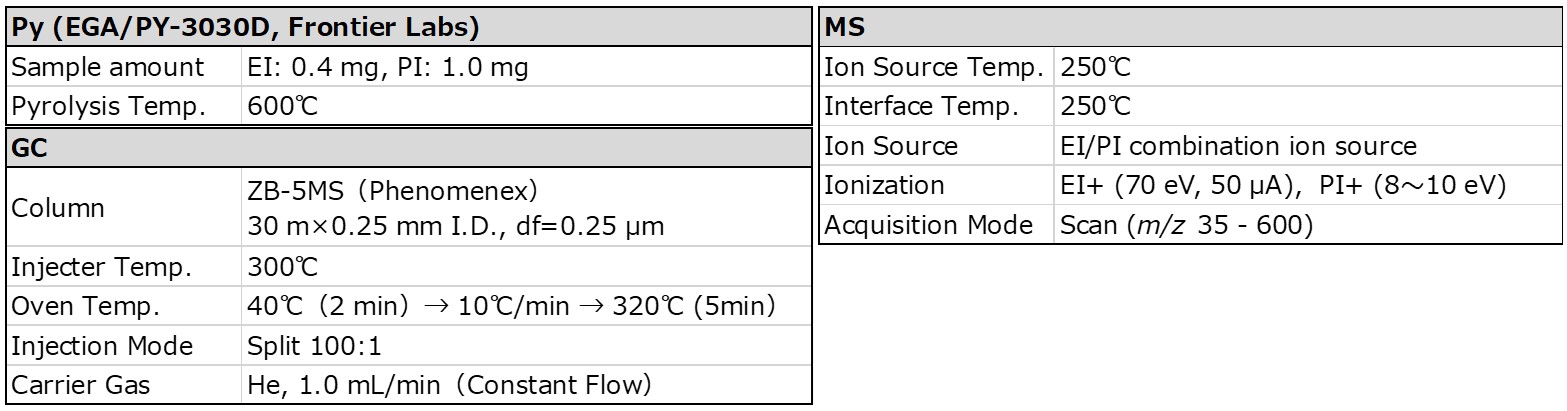
Table 1 Measurement condition
Results and Discussion
Figure 1 shows TICC of Py-GC/EI and Py-GC/PI measurement results. Strong peaks derived from Benzene, Acetic acid, Toluene, Indene, Naphthalene etc. were observed. In addition, components presumed to be additive components were also detected (components A, B and C). Detailed analysis results for components A, B and C are shown in the next section.
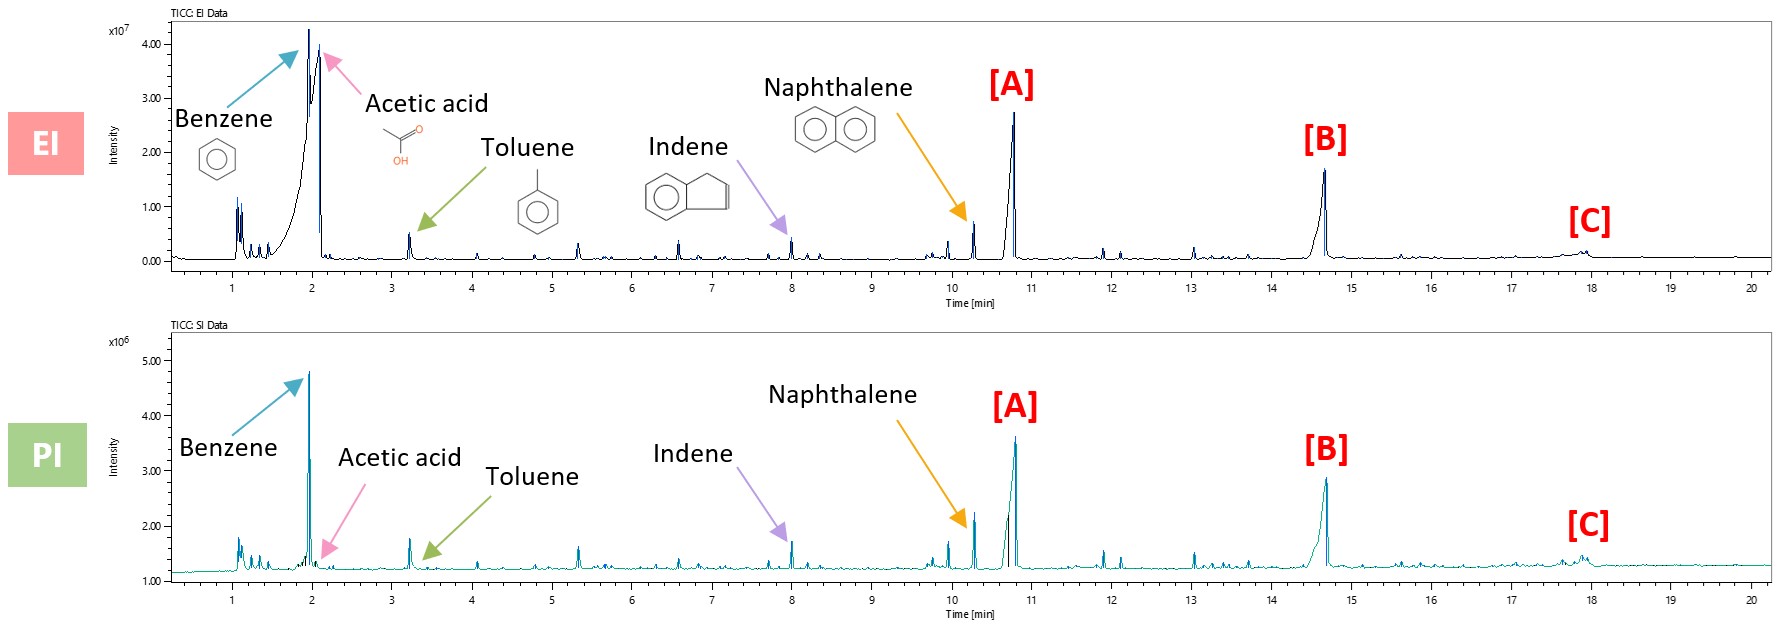
Figure 1 Py-GC/EI and Py-GC/PI total ion current chromatograms
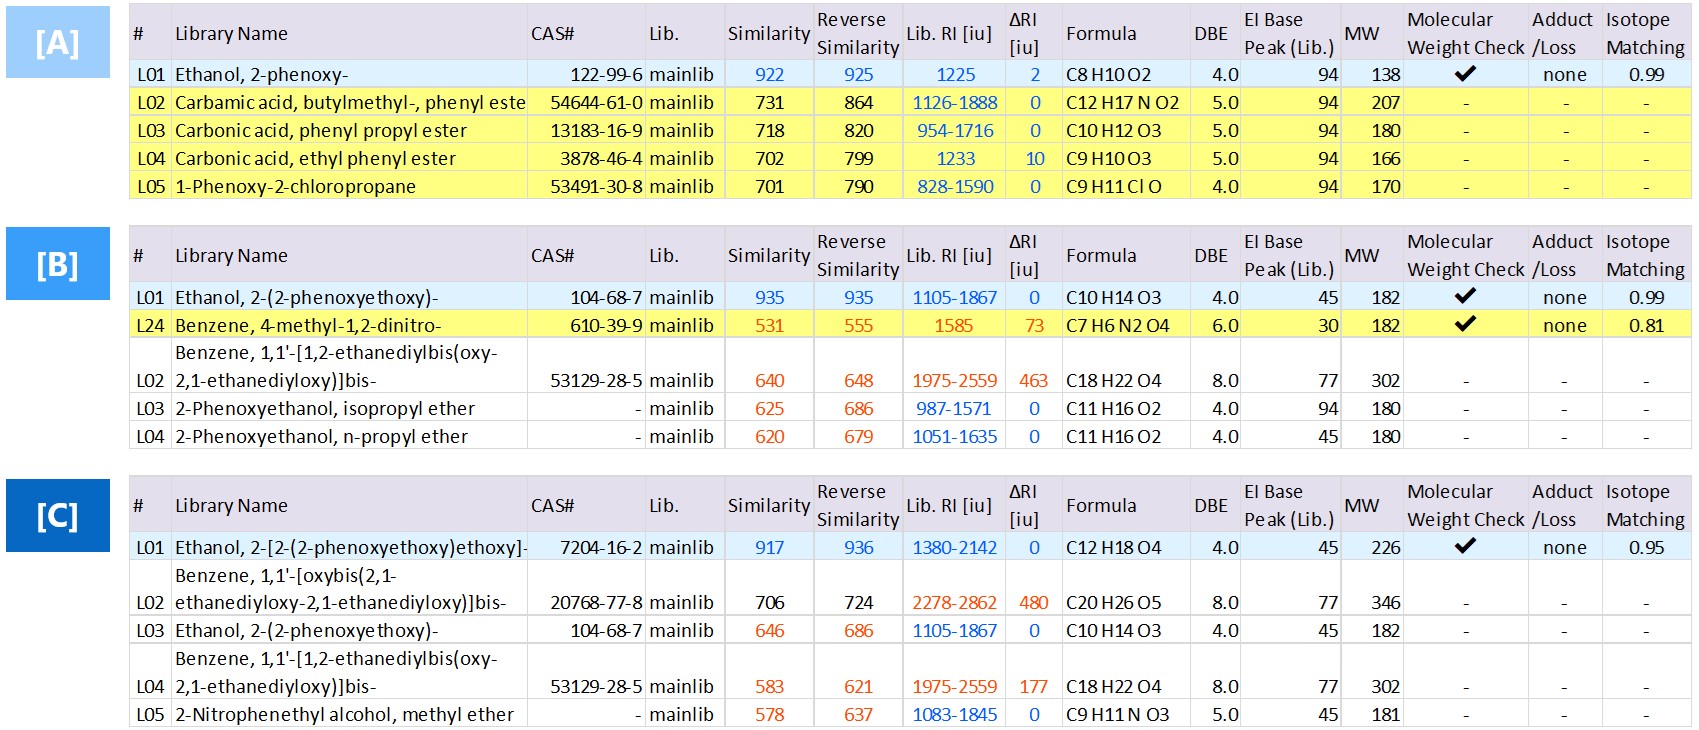
Figure 2 shows mass spectra of components A, B and C (in EI mass spectrum, black line: measured spectrum, red line: library spectrum). For these components, molecular ions were detected in the mass spectra of both the EI and PI data (IM indicate molecular ion in Figure 2). However, the relative intensities of molecular ions were higher in the PI method. The integrated qualitative analysis result lists of the top 3 candidates each components is shown in Table 2. Component A was estimated as "Ethanol, 2-phenoxy-" because the similarity score calculated with the library DB was 922. The retention index value was ΔRI 2iu, which was a good value. This is a representative component used as a preservative in cosmetics and pharmaceuticals. In resins, it is used as a plasticizer and a film formation assistant. From the above results, it was found that additives were contained in the vinyl acetate adhesive. Component B was estimated as "Ethanol, 2-(2-phenoxyethoxy)-" because the similarity score calculated with the library DB was 935. The structural formula in Figure 2 shows that component B has the structure of the ethylene glycol moiety of component A (OCH2CH2OH) + ethylene oxide (OCH2CH2). And component C was estimated as "Ethanol, 2-[2-(2-phenoxyethoxy)ethoxy]-" because the similarity score calculated with the library DB was 917. The structural formula of component C was component B + ethylene oxide (OCH2CH2).
These results indicate that components B and C are similar in structure to the additive component A. The similarity in structure suggests that the properties of the compounds may also be similar.
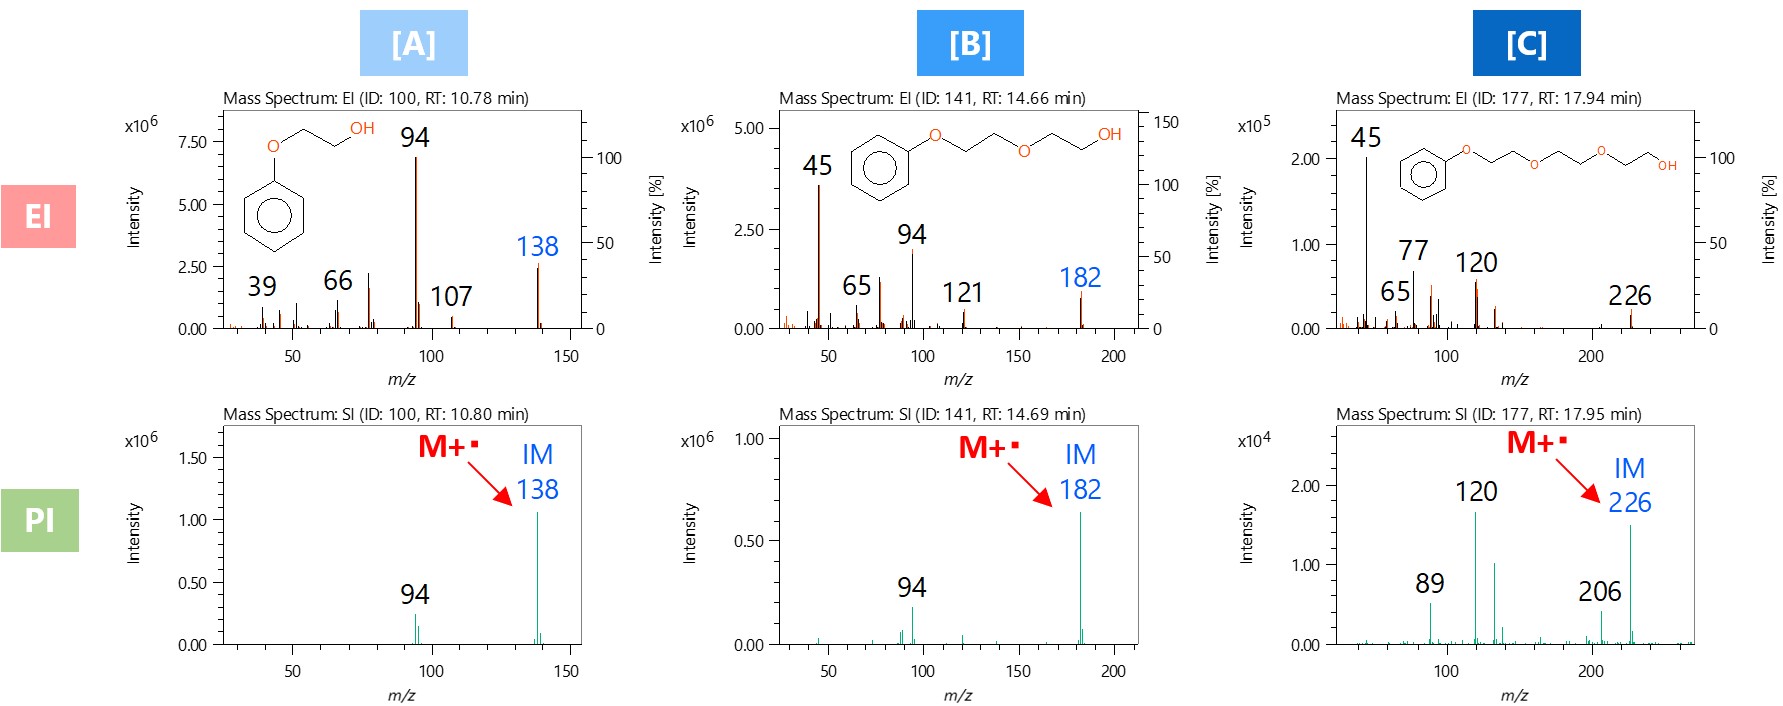
Figure 2 Mass spectra of component A,B and C
Table 2 Integrated qualitative analysis result of component A,B and C
Conclusions
In this MSTips, we introduced analysis results of additive components in vinyl acetate adhesive using msFineAnalysis iQ. msFineAnalysis iQ automatically performs an integrated analysis that combines library DB search results using GC/EI data and confirmation of molecular ions using GC/SI data. Therefore, it was possible to easily analyze the additives in the polymeric material. This software is expected to improve the qualitative accuracy and efficiency of qualitative analysis using GC-QMS.
Solutions by field
Related products
Are you a medical professional or personnel engaged in medical care?
No
Please be reminded that these pages are not intended to provide the general public with information about the products.