HSQC-TOCSY Analysis│Understanding 2D NMR Application in Comparison with TOCSY
Since COSY and TOCSY enable visualization of spin correlations among protons, they have been widely utilized in molecular structure analysis. However, with a molecule where proton signals are heavily overlapped, although the spin network can be captured, assignment of individual signals was not easily possible. In such a situation, HSQC-TOCSY which utilizes 13C information can be a useful method. In this column, through comparison of each spectrum, we make the features of HSQC-TOCSY clear and explain its benefits by using cedrol as an example.
This column is provided under the basic understanding of COSY/TOCSY. Please check the basics of COSY/TOCSY here.
COSY/TOCSY Analysis│Interpreting spin correlations using 2D NMR
What is HSQC-TOCSY?
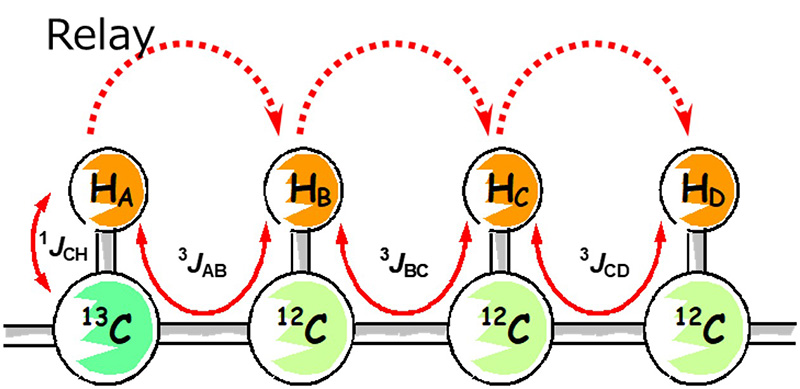
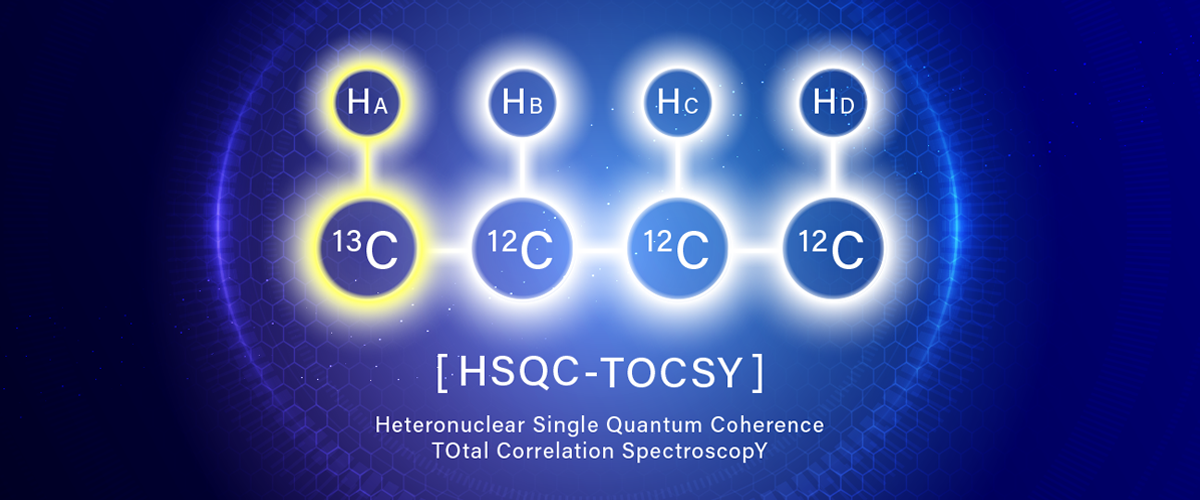
HSQC-TOCSY is a two-dimensional NMR experiment that can simultaneously obtain the directly coupled 1H-13C correlation by HSQC and the spin network information by TOCSY. As a result, TOCSY-type correlations are observed with 13C chemical-shift resolution.
HSQC-TOCSY is a combination of the two mechanisms:
- HSQC part: to detect a 1H that is directly coupled with any given 13C
- TOCSY part: to relay magnetization to a 1H in the same spin network starting from the 1H.
As a result, for any given 13C,
- 1H that is directly coupled with the 13C (HSQC correlation)
- Other 1Hs connected via the same spin network as the 1H's (TOCSY correlation) appear in the HSQC-TOCSY spectrum.
Related Article
Structural Analysis of Organic Compound Using 2D - NMR Spectrum
Comparison between TOCSY and HSQC-TOCSY Spectra
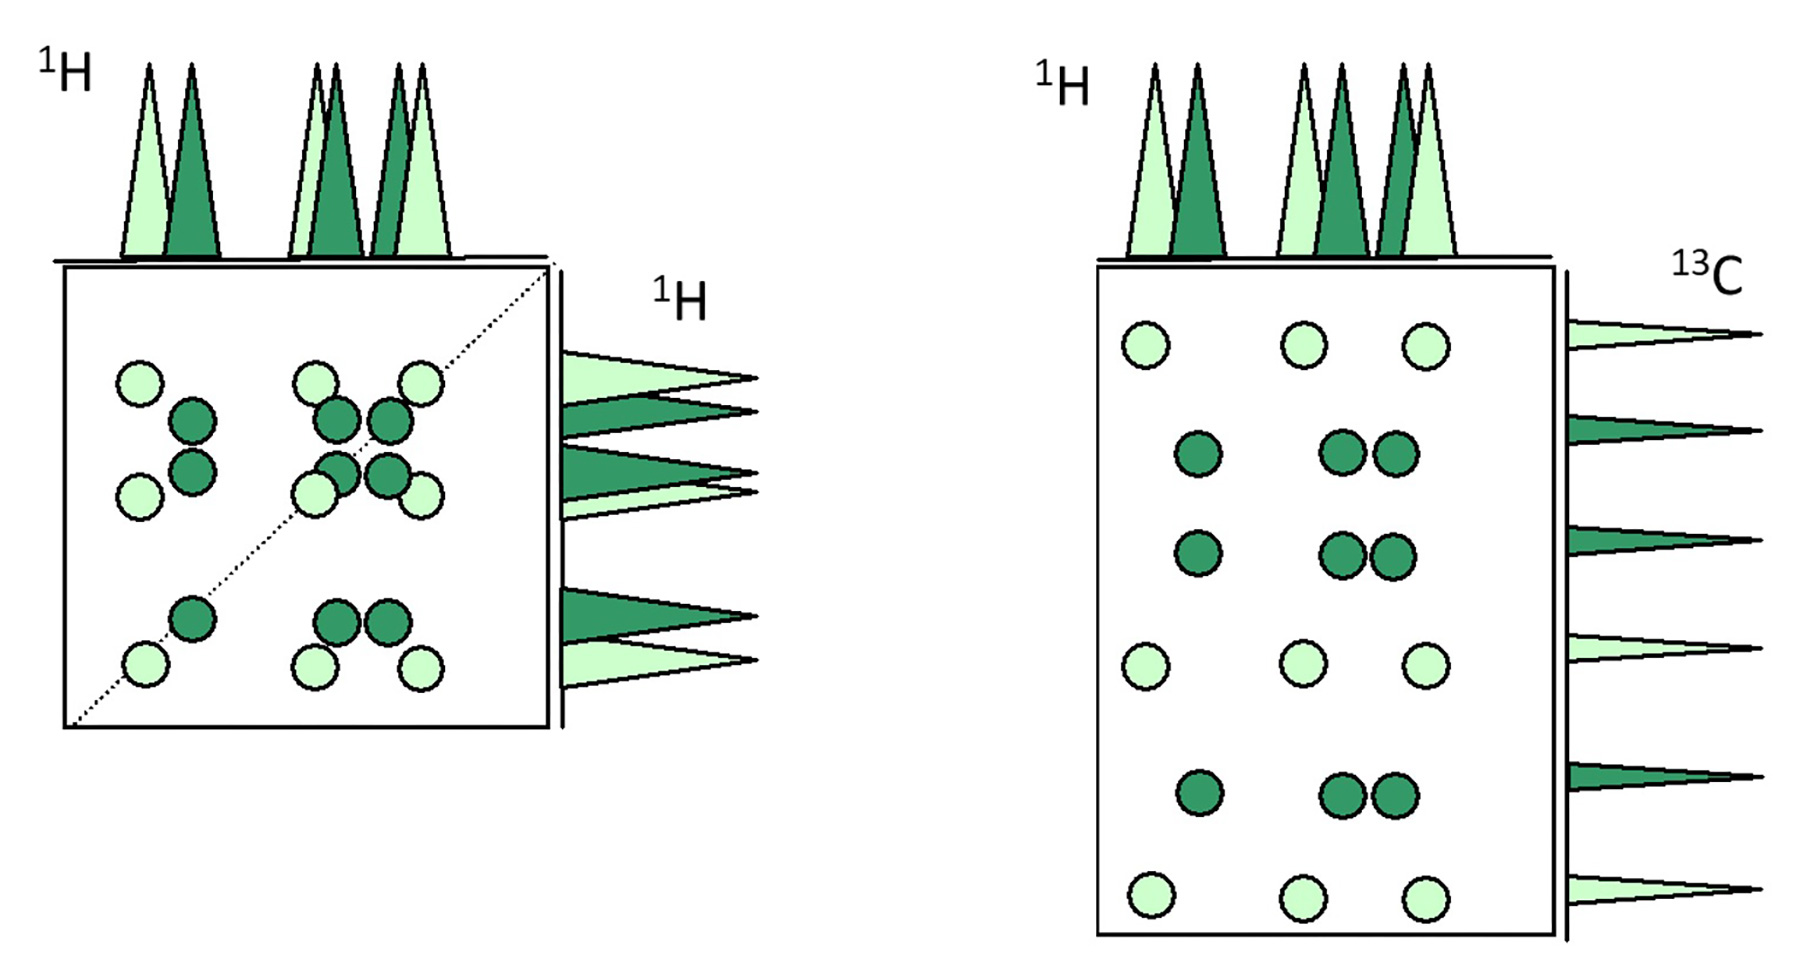
Fig.1 Schematic Diagram of TOCSY (left), Schematic Diagram of HSQC-TOCSY (right)
As shown in Fig. 1, when proton signals are severely overlapped, the corresponding TOCSY cross-peaks also overlap, making spectral analysis difficult. However, in HSQC-TOCSY, Y axis represents 13C chemical shift which have larger chemical-shift dispersion between chemical shifts for each signal. This additional dispersion enables more effective separation of correlation signals, thereby facilitating spectral analysis.
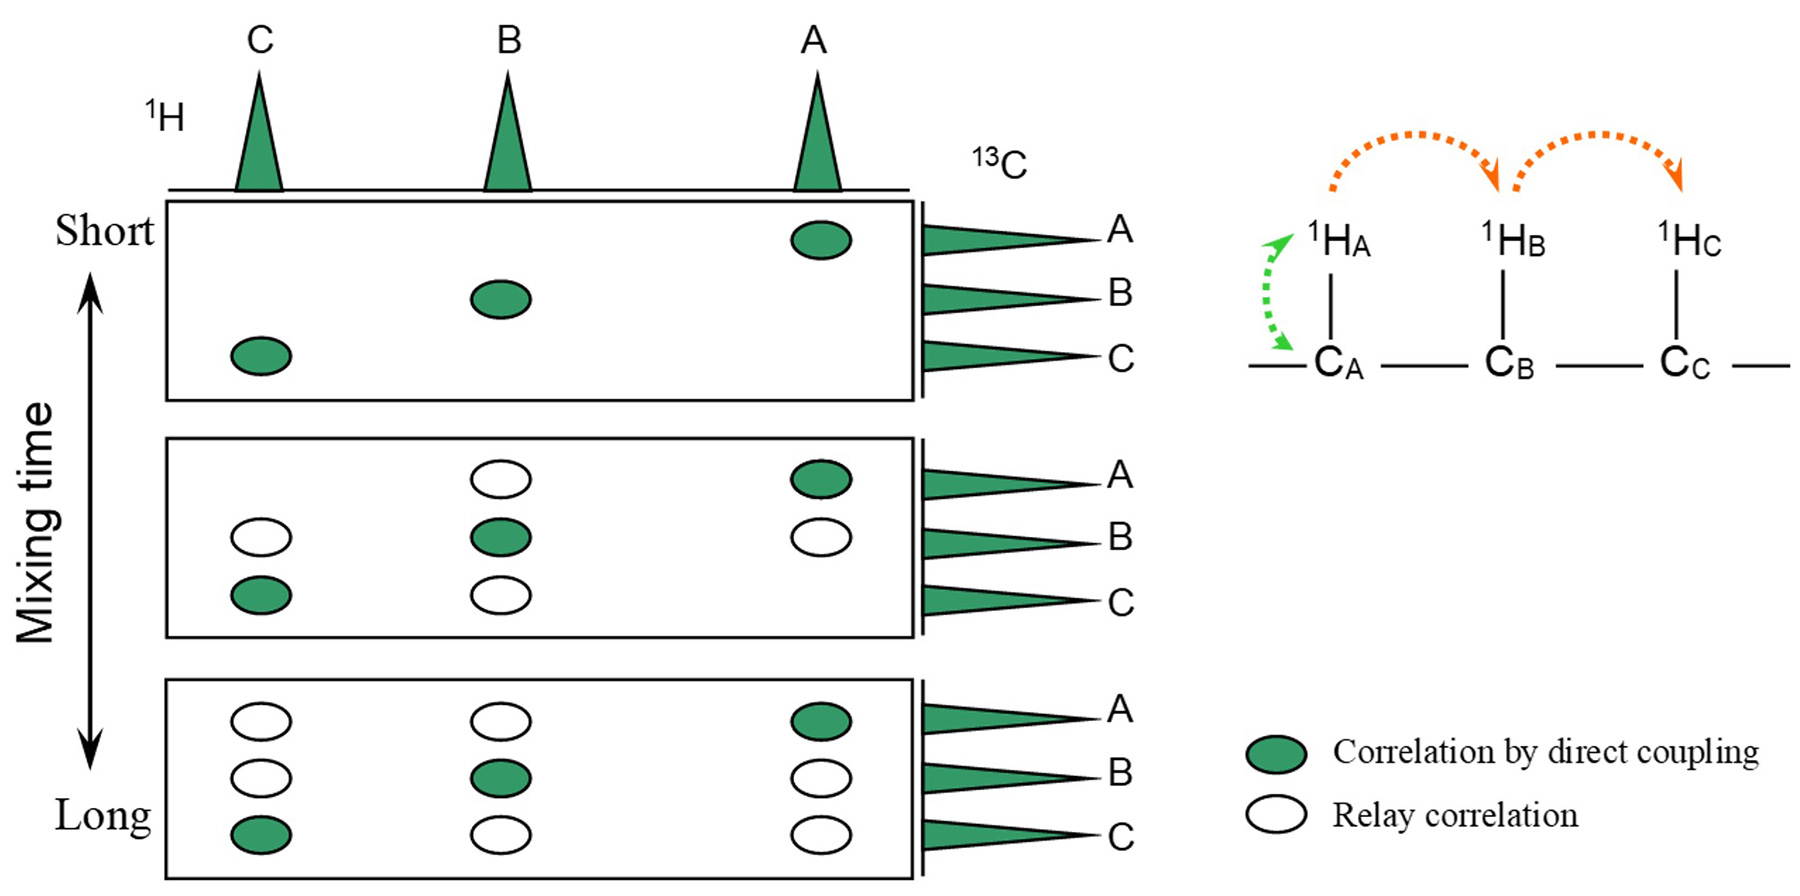
Fig.2 Schematic Diagram of HSQC-TOCSY Spectra
In addition, similar with the TOCSY, HSQC-TOCSY enables extended relay within a spin system by extending the mixing time. When paying attention to the correlation signal 13CA in Fig. 2, when the mixing time is short, the result is the same as the HSQC spectrum. But as the mixing time is extended, the magnetization is transferred to 1HB, 1HC, and the correlation signal with 1HB, 1HC appears.
HSQC-TOCSY Analysis Example of Cedrol
Cedrol is a terpenoid compound, known as an aroma compound found in ceder and cypress. Fig. 3 shows the 1H spectrum of cedrol. The OH proton signal is observed at 2.9 ppm, but other 1H signals are all observed in a narrow range of about 1 ppm. This region is considered in detail in Fig. 4.
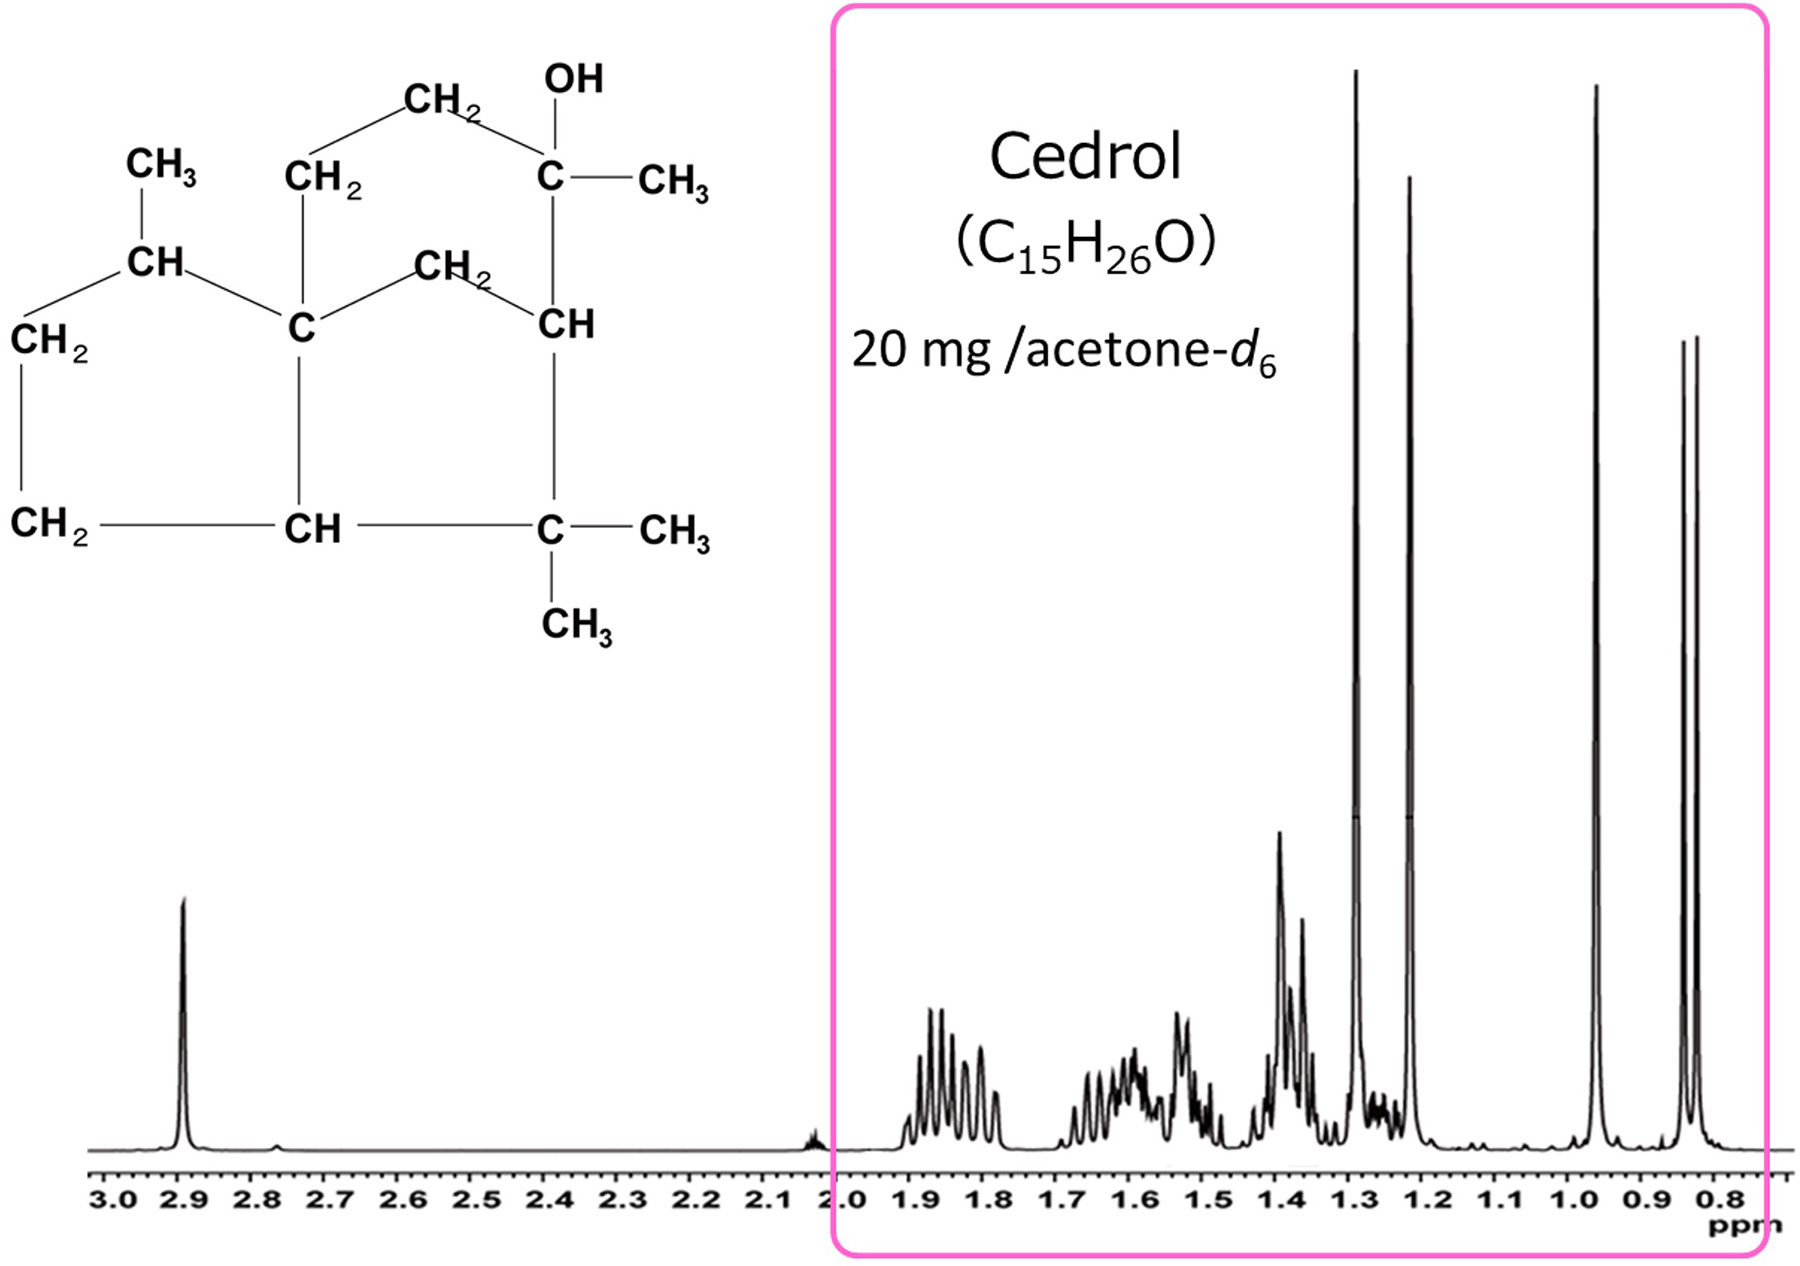
Fig. 3 1H Spectrum of Cedrol
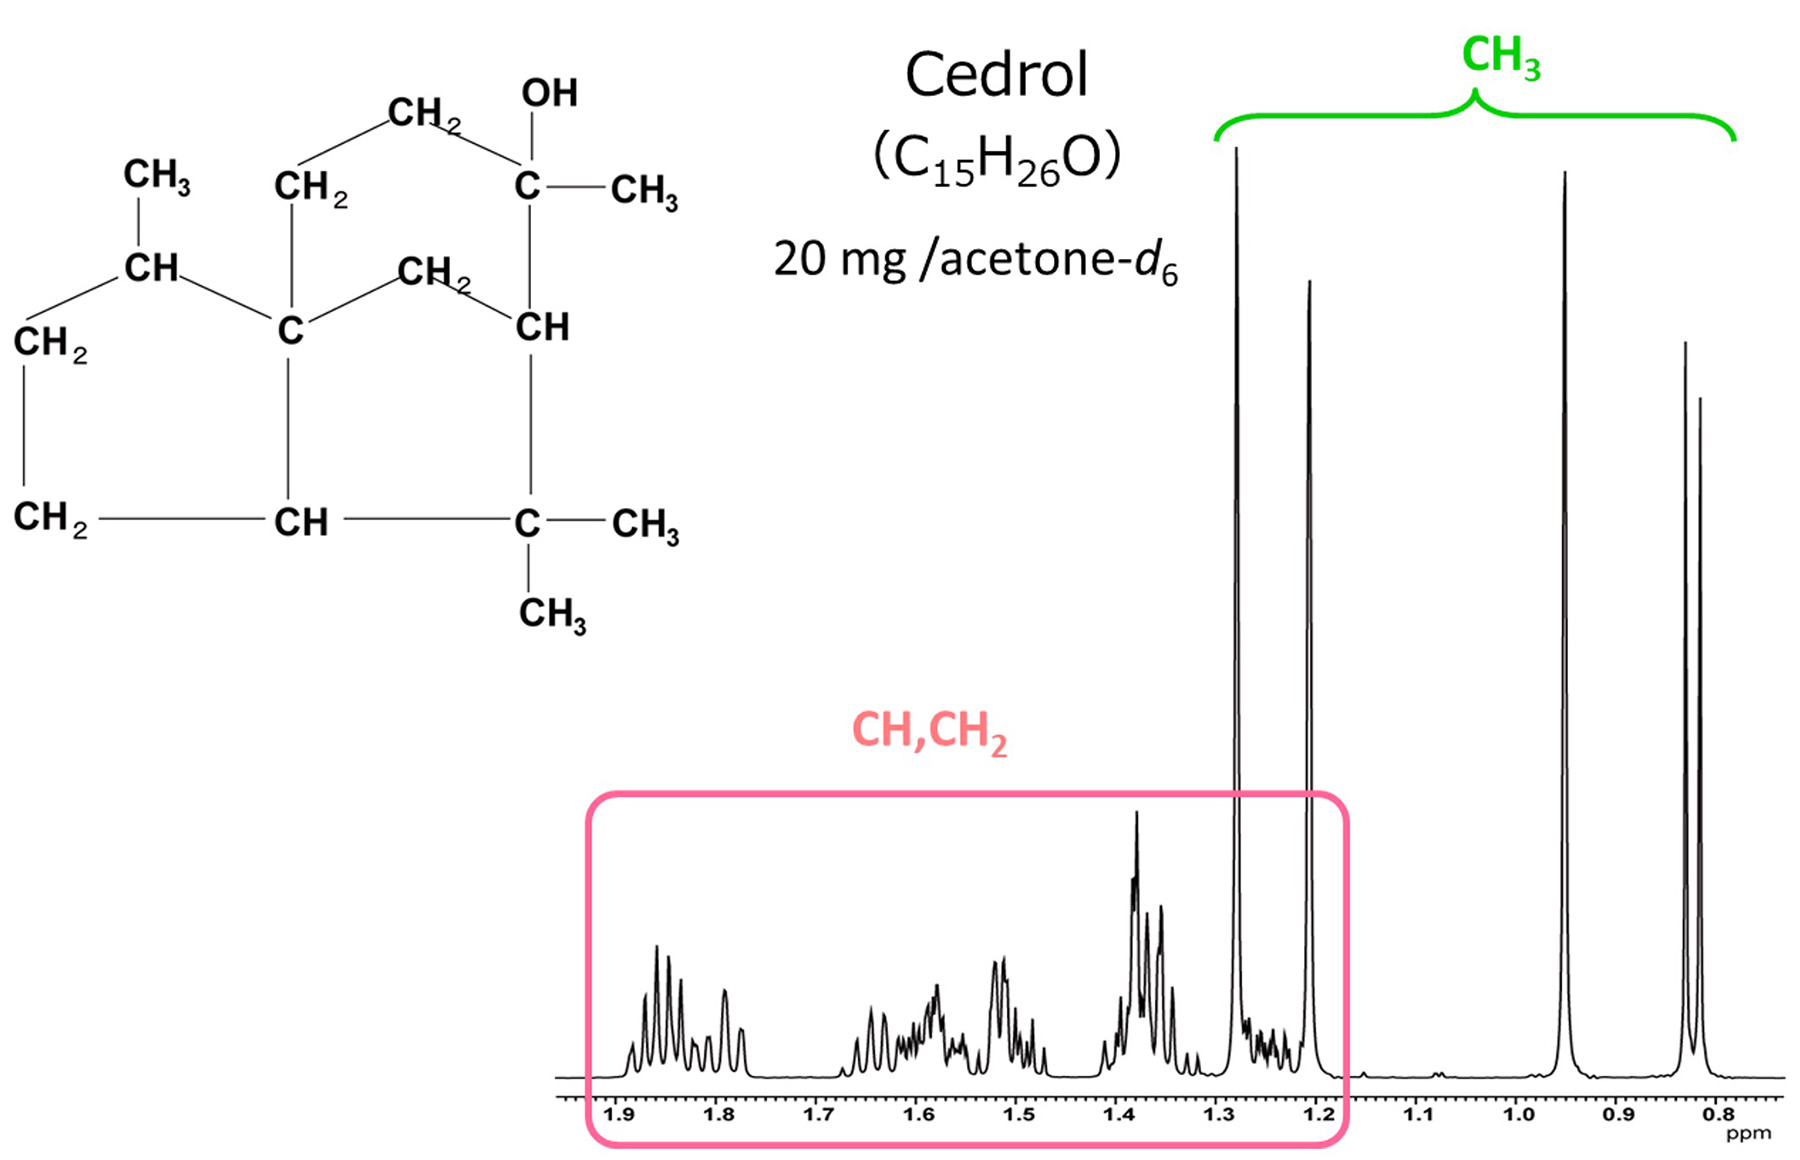
Fig. 4 1H Spectrum of Cedrol
From the high field, protons of four methyl groups (-CH3) are detected.
In the area circled in pink, protons from five methylene groups (-CH2-) and three methine groups
(-CH-) are overlapped. The reason that the area circled in pink has severe signals overlapping, is due to a
lot of "non-equivalent methylene" which are present in the molecule.
The methylene groups in an alkyl chain which is freely rotating, are considered to be in NMR equivalent
environments and chemical shifts of protons of such methylene groups are equal.
However, in the cyclic compound such as cedrol, the rotation is restricted. So, protons of the methylene
group are in a non-equivalent environment and these signals have separate chemical shifts.
Methylene groups of this type are referred to as "non-equivalent methylene".
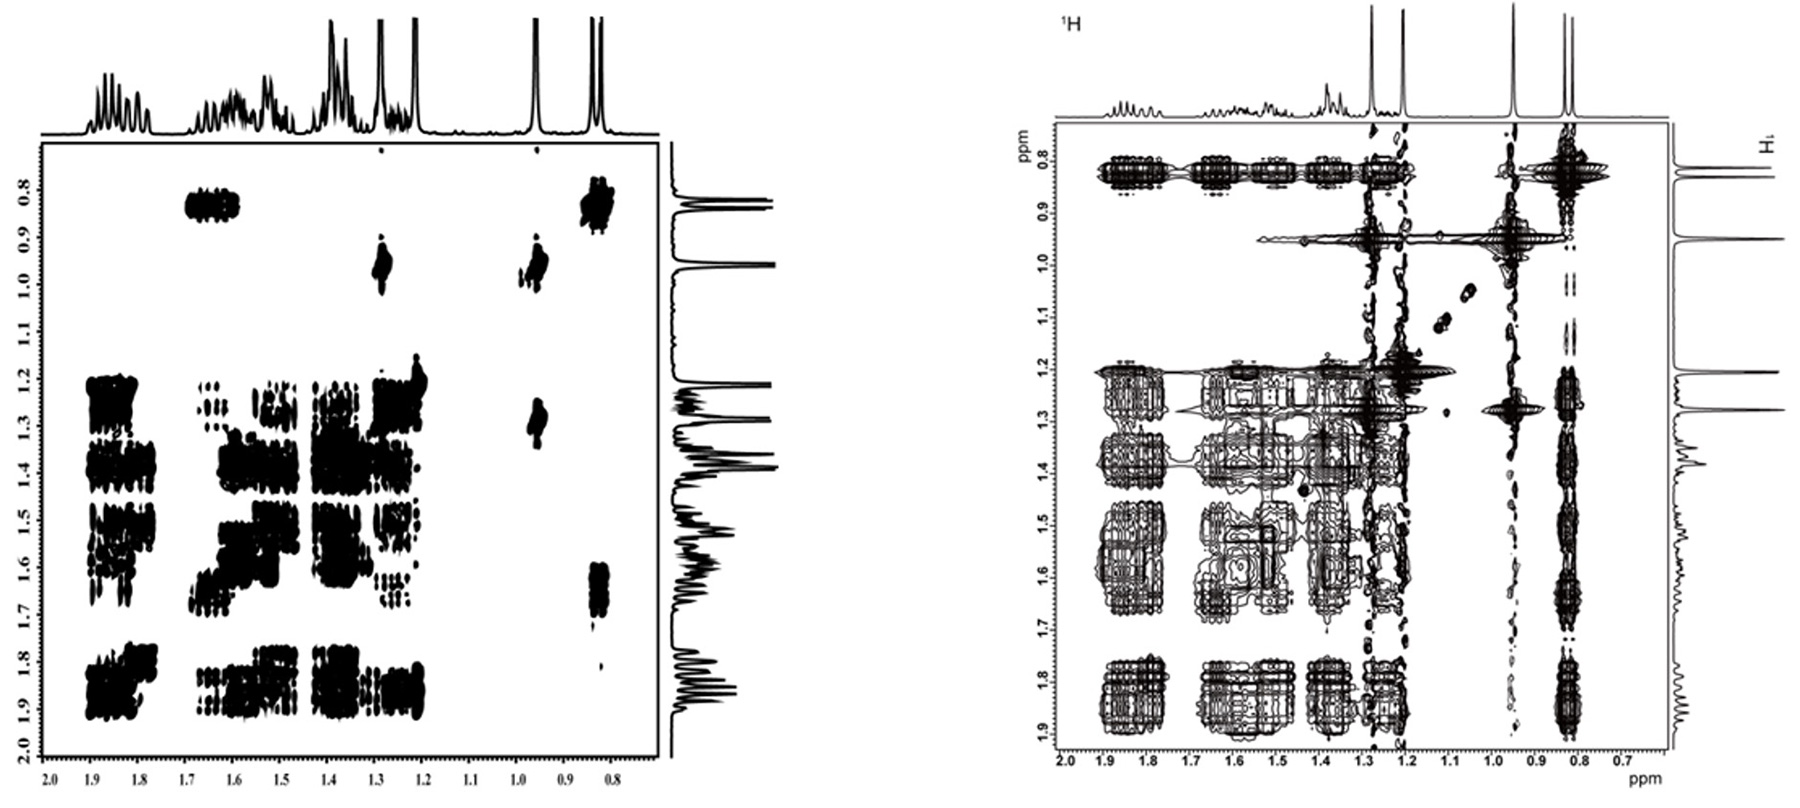
Fig.5 COSY Spectrum (left) and TOCSY Spectrum (right) of Cedrol
Fig. 5 shows the spectra of COSY and TOCSY (mixing time: 200 ms) with 400 MHz NMR spectrometer. In both spectra, there are regions where the signals are overlapping, complicating spectral analysis.
Even if analysis is attempted with methyl group protons of distant chemical shifts, spin network is
interrupted because the adjacent carbon of these methyl groups are quaternary carbons, making it difficult
to observe the relay.
Furthermore, when TOCSY spectrum of the methyl group detected at the highest field side (approx. 0.8 ppm) is
examined, the correlation signals are observed, yet overlapped, making it difficult to determine to which 1H
the network forms.
In other words, sometimes it can be difficult to determine the spin network even if TOCSY is used. In such
cases, HSQC-TOCSY becomes an effective experiment.
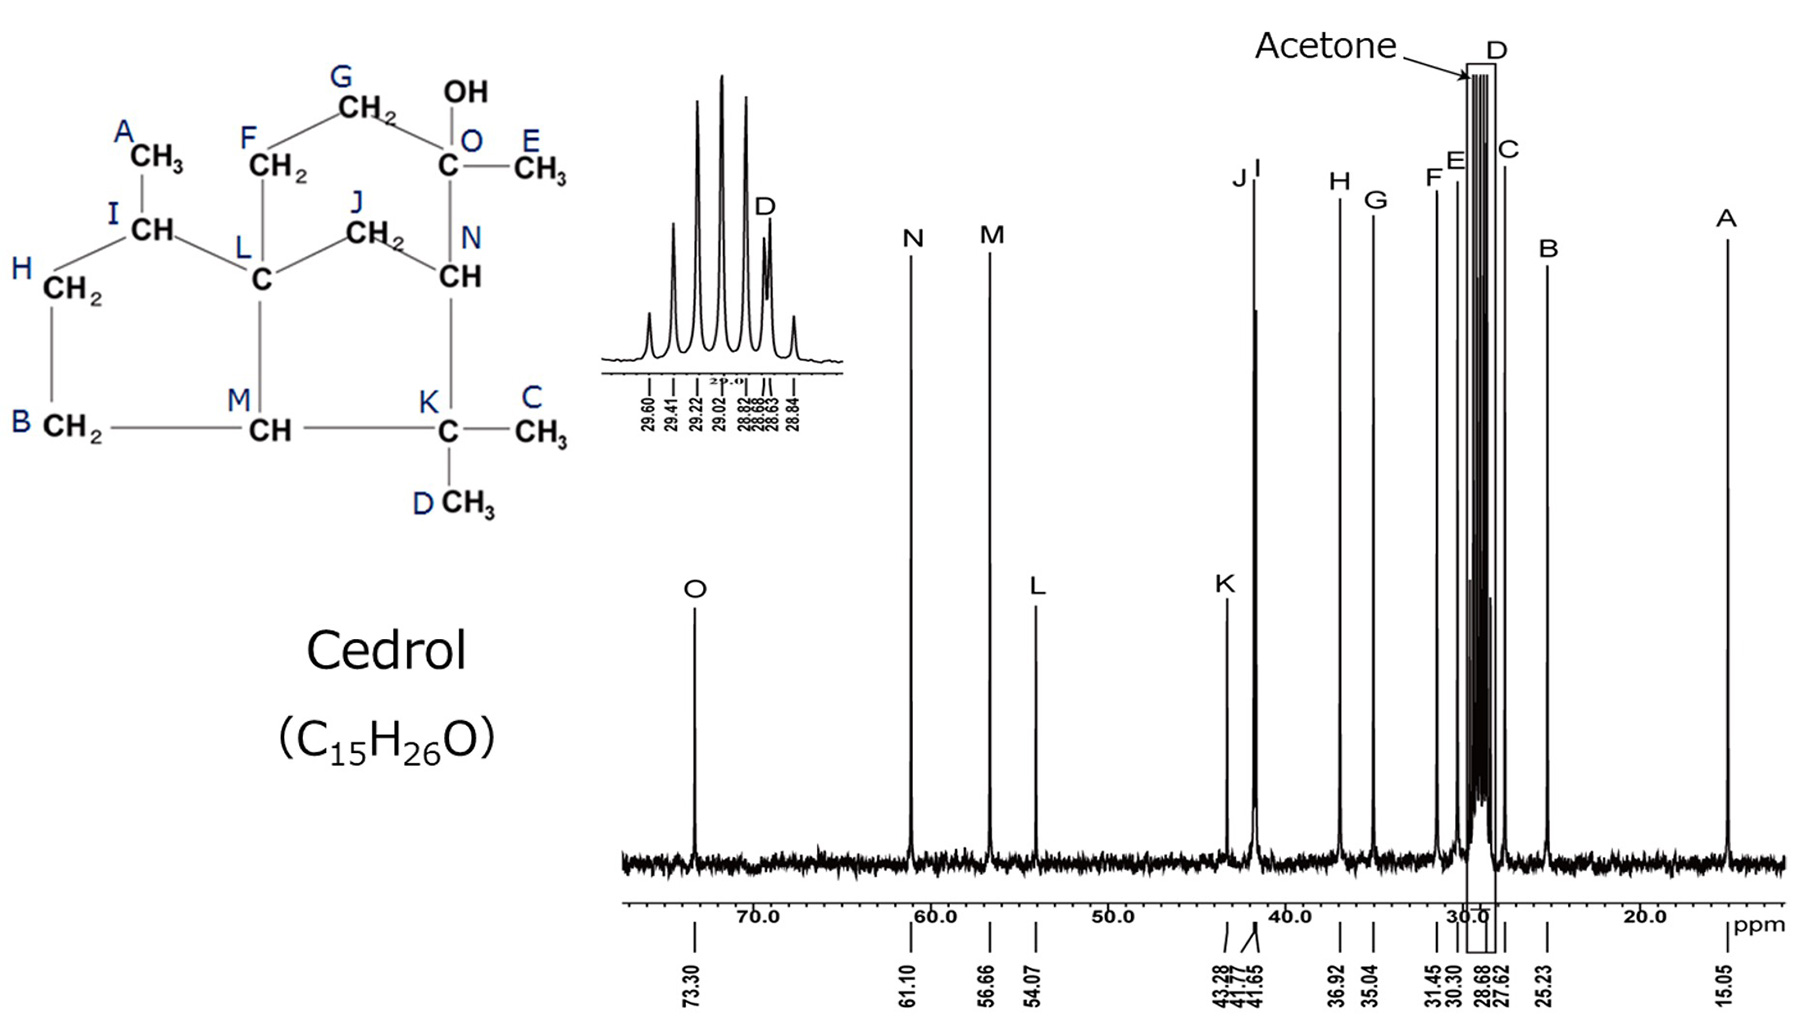
Fig.6 13C Spectrum of Cedrol
Prior to HSQC-TOCSY analysis, the 13C spectrum and HSQC spectra of cedrol are collected.
Fig. 6 shows the 13C spectrum of cedrol.
Although the signal D coming from the methyl group is overlapping with the solvent signal, all 15 signals of
13C are separated and observed.
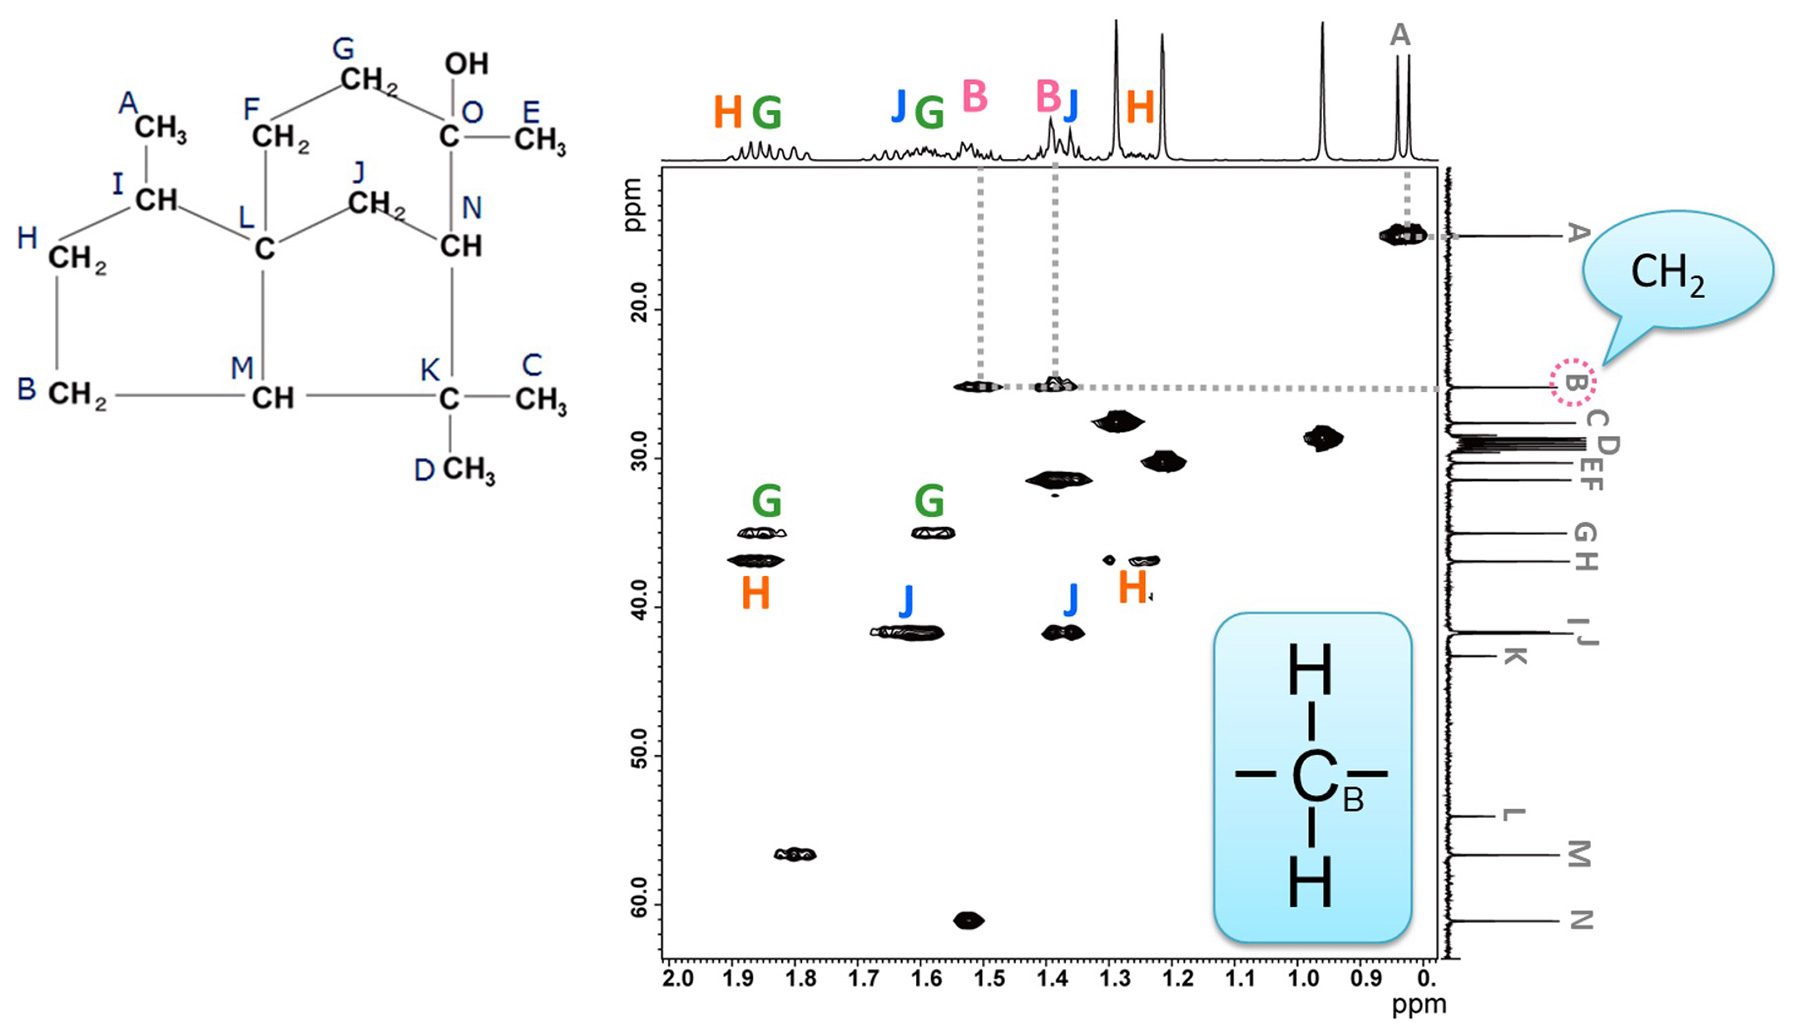
Fig. 7 HSQC Spectrum of Cedrol
Next, the HSQC spectrum of cedrol is shown in Fig. 7. The horizontal axis corresponds to the 1H chemical-shift axis, while the vertical axis represents the 13C spectrum data. HSQC correlates each 13C with its directly bonded 1H. Therefore, the correlation of two 1H signals appears for one carbon in the case of the methylene group.
When focusing on "methylene at B", two 1H correlation signals are observed, indicating that two
protons of methylene group B, have different chemical shifts.
Thus, HSQC enables easy confirmation of non-equivalent methylene. In cedrol, four out of five methylene
groups (B, G, H, J) are identified as non-equivalent methylene.
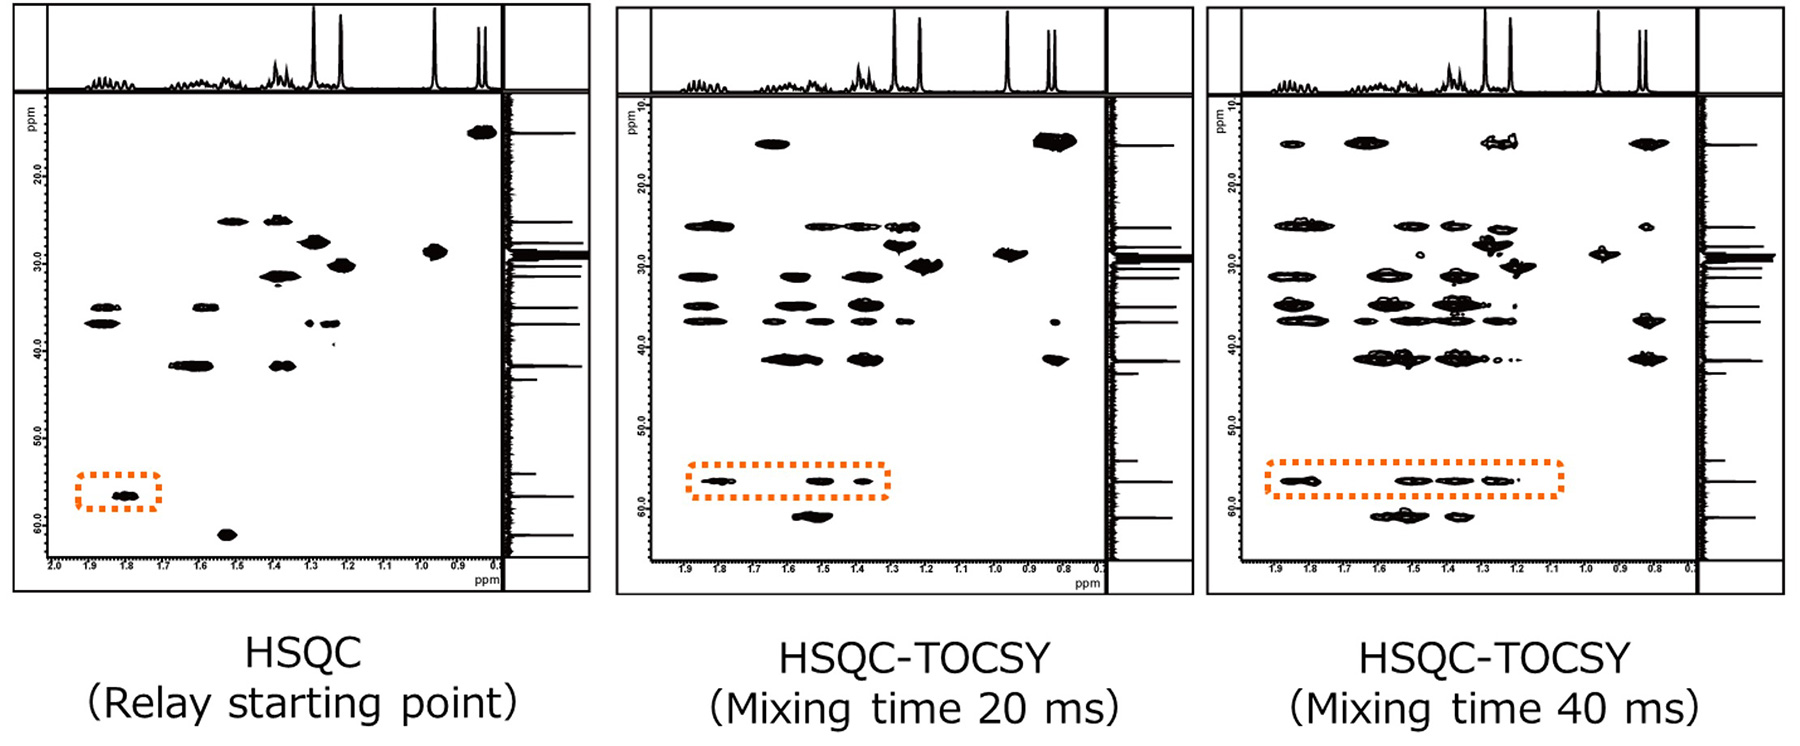
Fig. 8 HSQC-TOCSY Spectra of Cedrol
The HSQC-TOCSY spectrum of cedrol is shown in Fig. 8. The leftmost shows HSQC spectrum. When analyzing the
HSQC-TOCSY spectra, the signal observed in the HSQC spectrum (signal arising from the directly bonded
1H-13C correlation) is treated as the starting point of the relay.
Then, as in conventional TOCSY, by comparing with spectra with mixing time varied, it is possible to confirm
the relay along the spin network.
For example, comparing the areas circled in dotted lines indicate that the correlation signals increase with the relay. Now let's enlarge these areas and observe in more detail.
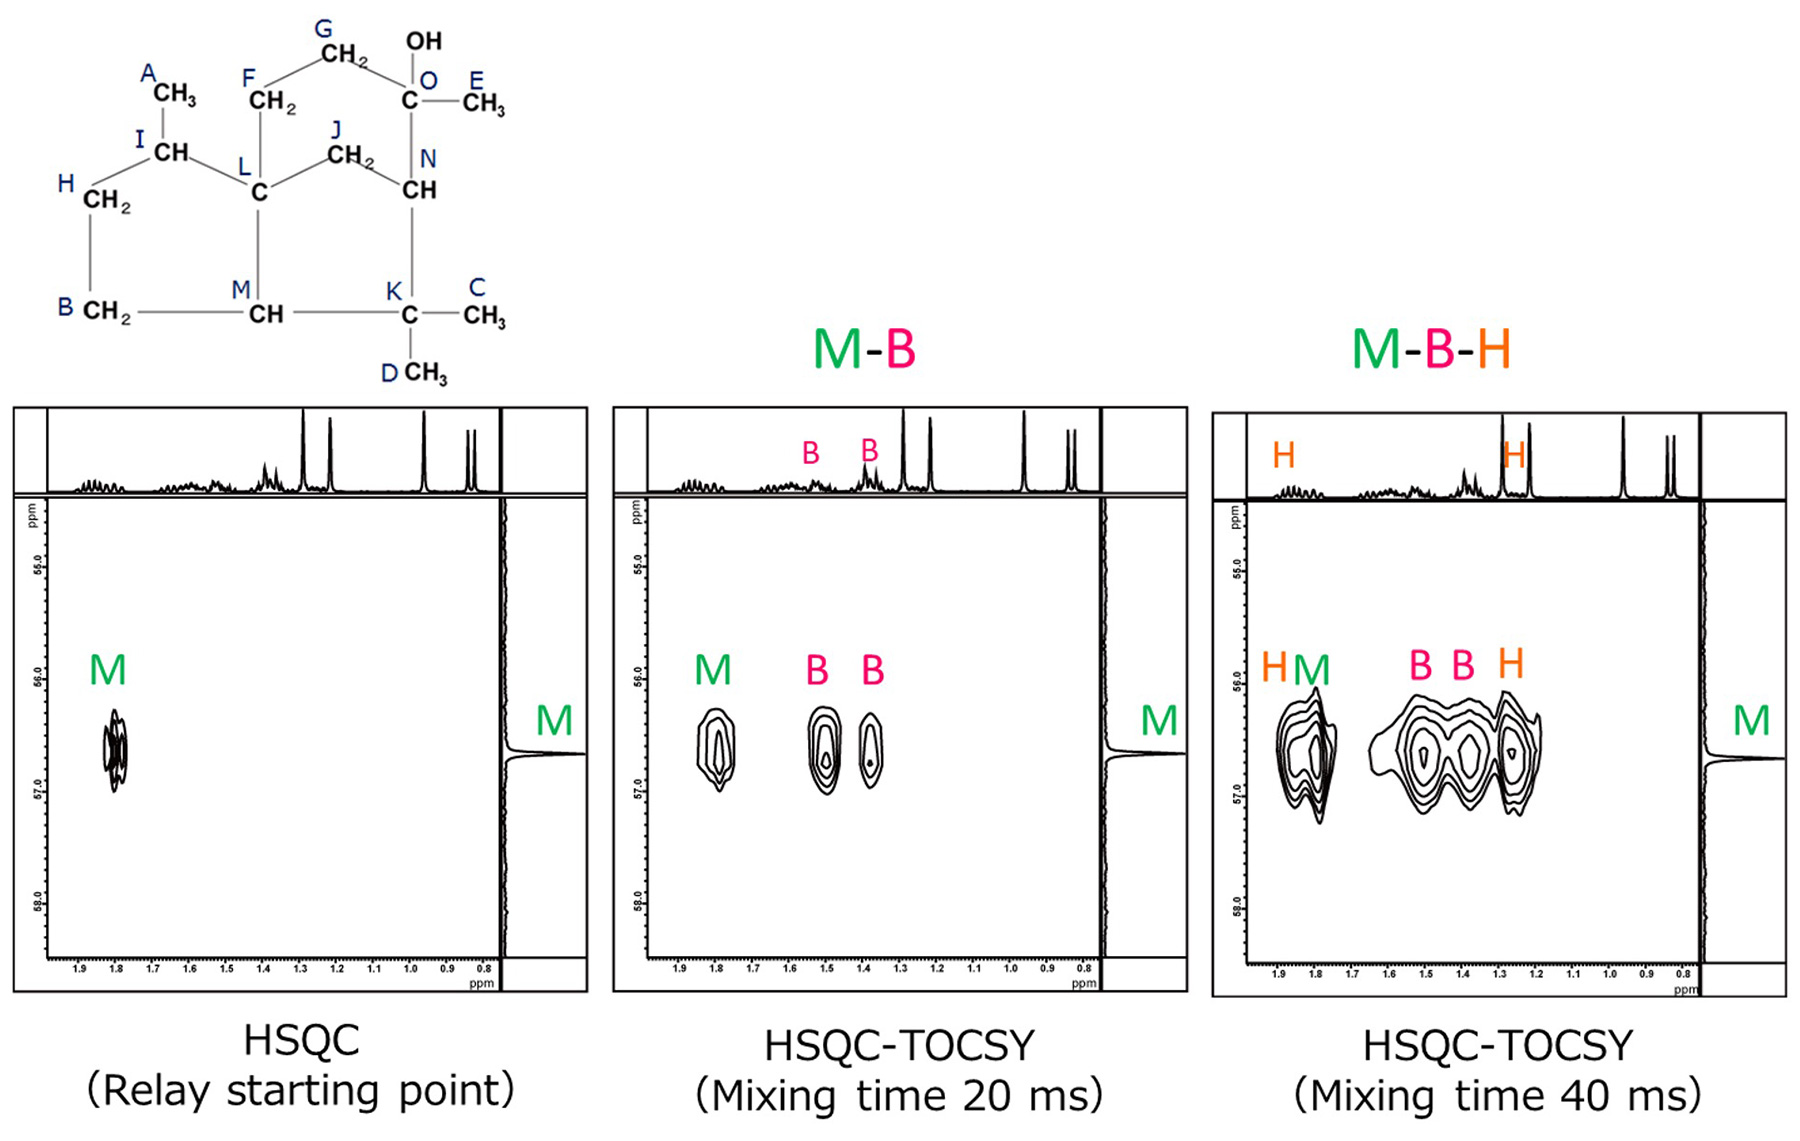
Fig.9 HSQC-TOCSY Spectra of Cedrol (Correlation of M)
Fig. 9 shows an enlarged comparison of the correlation signals for the methine carbon labeled M.
At the mixing time of 20 ms, a correlation with the non-equivalent methylene B appears, indicating an M-B connectivity. Moreover, at mixing time of 40
ms, a correlation signal with non-equivalent methylene H appears,
indicating that M-B-H are connected in this order.
In HSQC-TOCSY, the signals of non-equivalent methylene typically appear as two separate 1H
correlation signals for a single carbon. This provides the advantage that the assignment of magnetically
nonequivalent methylene protons becomes easier.
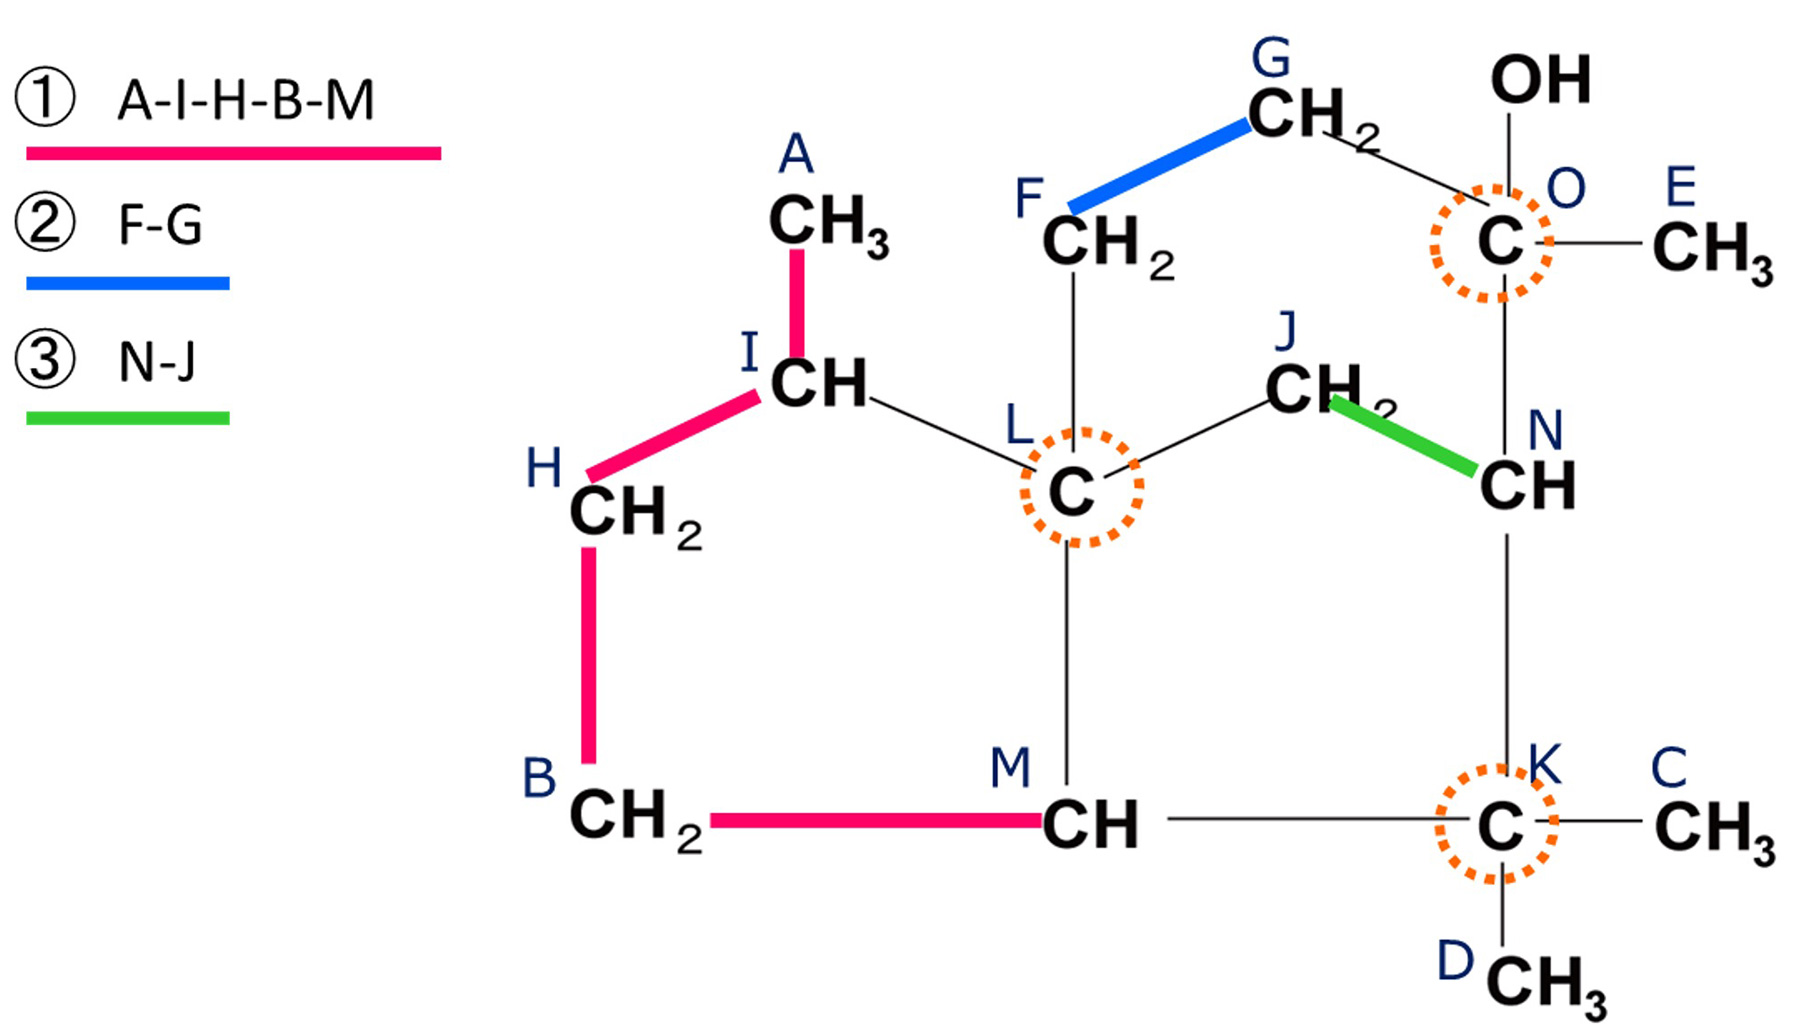
Fig. 10 HSQC-TOCSY Correlation of Cedrol
By applying the same analytical procedure, we obtained three spin networks as shown in Fig. 10. The regions
where no further magnetization transfer is observed correspond to positions at which the
1H-1H spin relay is terminated by intervening quaternary carbons.
To proceed with the structural analysis to the next step, it will be necessary to analyze the 1H
and 13C long-range correlation (HMBC spectrum) and complete the planar structure determination.
Related Article
Structural Analysis of Organic Compound Using 2D - NMR Spectrum
Summary of COSY,TOCSY, and HSQC-TOCSY
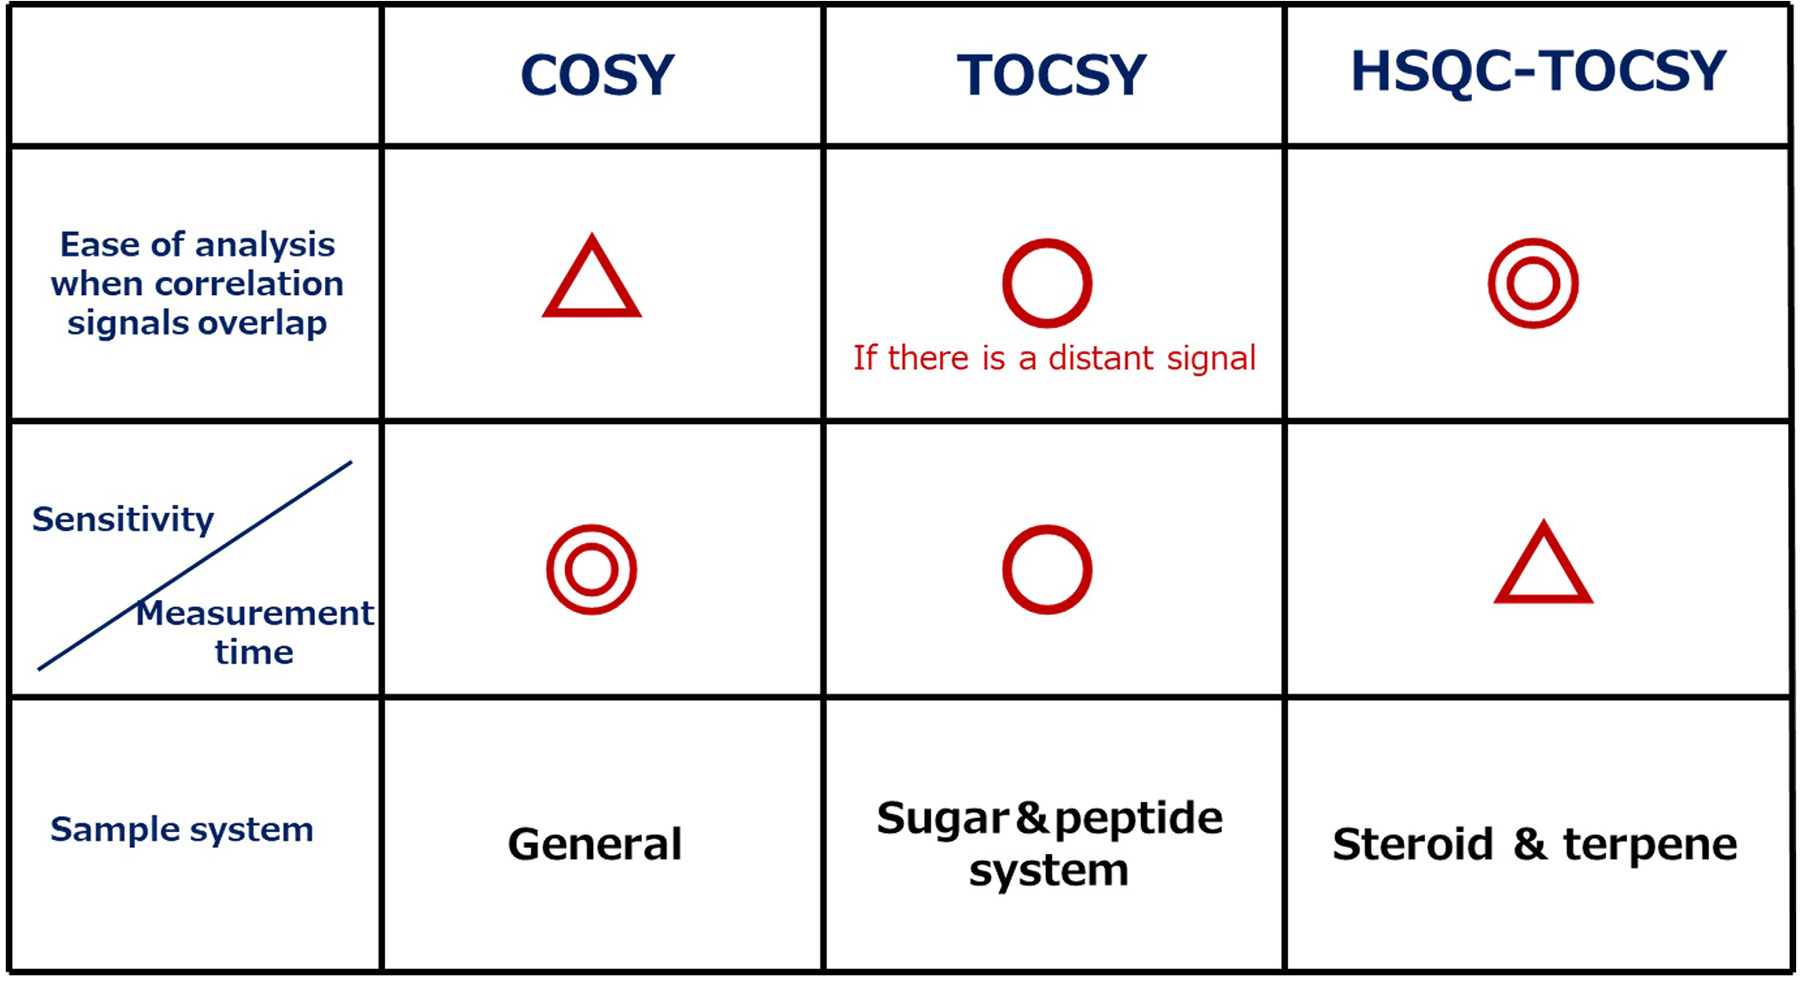
Finally, we summarize the characteristics of the COSY, TOCSY, and HSQC-TOCSY.
COSY is a fundamental and essential 2D NMR spectrum as it can be easily measured with high sensitivity.
A first step for molecular structure analysis, which is widely used from beginners to experts.
On the other hand, TOCSY and HSQC-TOCSY are useful when 1H signals overlap, or when complicated spin networks need to be analyzed. TOCSY allows for confirmation of the entire spin network, but sometimes it is necessary to measure multiple spectra with different mixing times. In addition, HSQC-TOCSY has a great advantage to be able to avoid overlapping of signals since the correlation analysis of TOCSY is performed by way of 13C. However, as the sensitivity is lower than COSY and TOCSY, the measurement time is longer than COSY and TOCSY, which needs attention.
Each measurement method has advantages and disadvantages. It is important to select the most suitable 2D NMR measurement method according to complexity of the target molecule, degree of signal overlapping, and the spin network range to be analyzed.
Related Application
Contact
If you are interested in the details of spin network analysis using TOCSY and HSQC-TOCSY and NMR spectrometer, please contact JEOL. We will support your molecular structure analysis capability with our abundant application examples and technical support.
Products
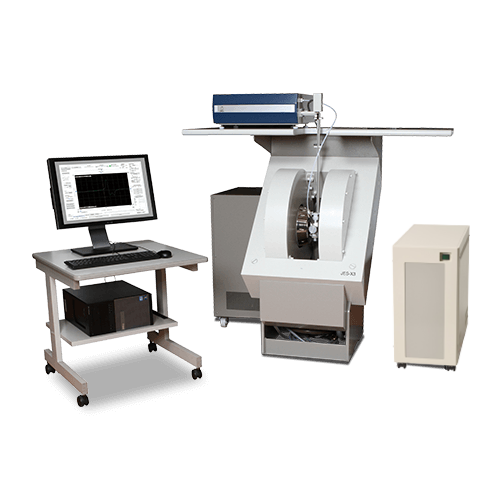
Nuclear Magnetic Resonance Spectrometer (NMR)
NMR is the abbreviation for Nuclear Magnetic Resonance. It is an instrument used to observe the resonance phenomenon of nuclear spins by placing atomic nuclei in the magnetic field to analyze molecular structure of a substance at an atomic level. Specifically, it is useful in the analysis of organic compounds and polymer materials and used in the fields of pharmaceutical, biology, food, and chemistry. The application is even recently expanding to include the analysis of structural and physical properties of inorganic materials such as ceramics and batteries.
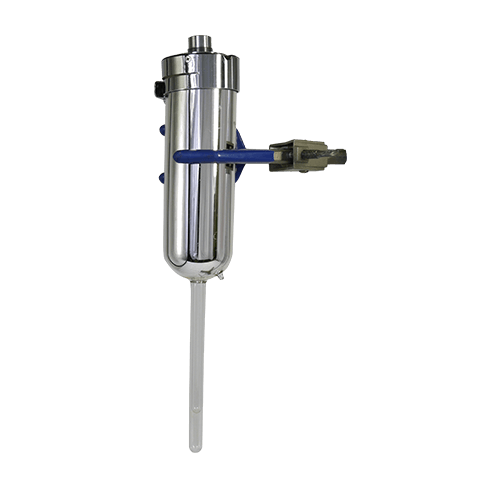
NMR Probes
With NMRs, the detector (probe) differs depending on the sample form and measurement technique. JEOL offers solution and solid probes for a wide variety of purposes.
NMR Magnets
Space-saving design with a compact superconducting magnet.
Greater
flexibility of installation layout of the instrument is possible with the new compact magnets that have
a smaller stray magnetic field.
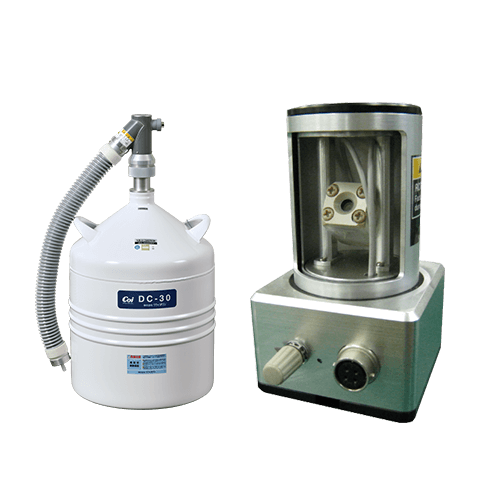
NMR Peripherals
Introducing NMR peripherals such as the Auto Sample Changer and Nitrogen Replenishment System.

Electron Spin Resonance Spectrometer (ESR)
Electron Spin Resonance (ESR) is a powerful analytical method to detect, analyze and determine thecharacteristics of unpaired electrons in a substance. It is clear that the state of electrons in a substance have a strong influence on its characteristics and functionality, so evaluation by ESR is becoming more and more important. Many types of substances, from electronic materials to catalysts, biological samples, can be studied regardless of whether they are solid, liquid, or gas. A wide range of ESR techniques are possible using suitable attachments together with the basic instrument.
JEOL Ltd.
Since its foundation in 1949, JEOL has been committed to the development
of cutting-edge scientific and metrology instruments, industrial and medical equipment.
Today,
many of our products are used throughout the world and we are highly regarded as a truly global
company.
Aiming to be a 'top niche company that supports science and technology around the
world', we will continue to respond precisely to the increasingly sophisticated and diverse needs
of our customers.