COSY/TOCSY Analysis│Interpreting spin correlations using 2D NMR
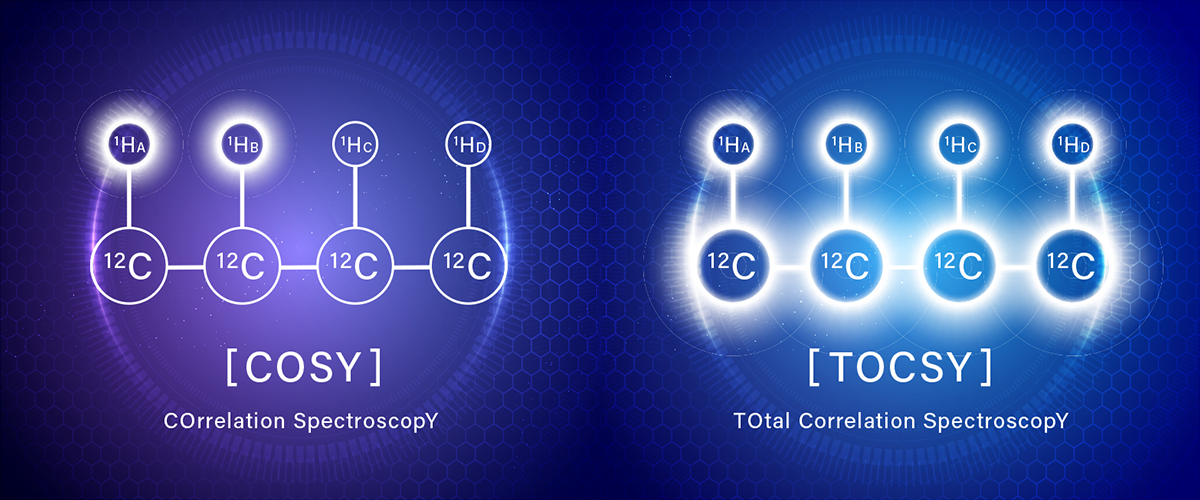
In this column, we explain the basic principles and analysis methods of COSY and TOCSY, which are representative techniques of 2D NMR. Starting from confirming correlations between adjacent protons using COSY, we introduce spin network analysis with TOCSY and analysis of carbohydrate using 1D and 2D TOCSY, with concrete examples.
What is COSY?
COSY(COrrelation SpectroscopY)is a basic method for visualizing couplings between adjacent 1Hs by using 2D NMR. Traditionally, homodecoupling of 1Hs was used to locate neighboring 1H atoms one by one. However, with the appearance of COSY, it became possible to analyze 1H-1H coupling correlations simultaneously over a broad range, dramatically improving the efficiency of structural analysis. Currently, COSY is widely used as an introductory 2D NMR method for confirming 1H-1H correlations.
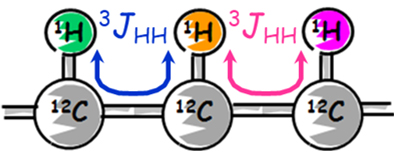
COSY shows correlations between adjacent 1Hs - in other words, 1Hs that are 3 bonds apart. The spin coupling of 3 bonds apart is expressed as 3JHH.If the adjacent 1H is known, the connection of 1Hs in a molecule can be understood.
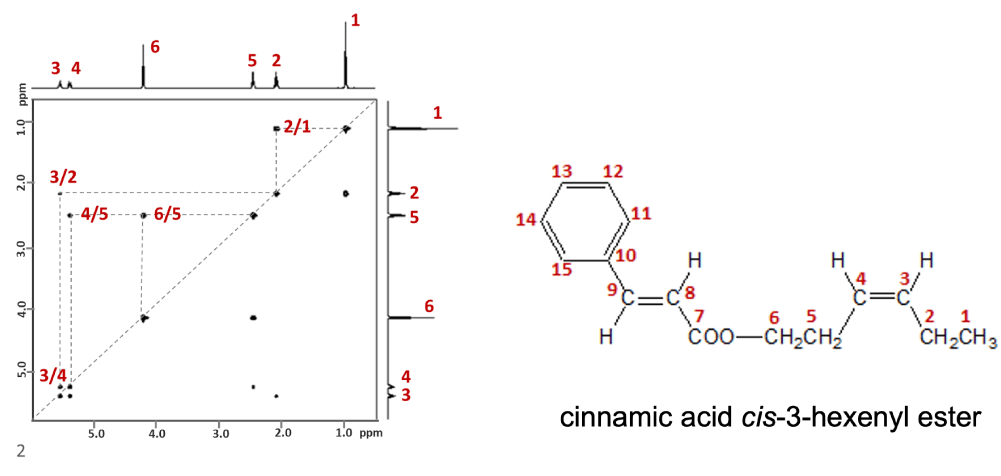
Fig.1 COSY spectrum of cinnamic acid cis-3-hexenyl ester
Fig.1 shows a COSY spectrum for the region corresponding to 1Hs at 1 to 6 in "cinnamic acid cis-3-hexenyl ester". As indicated above, when the correlation signals and 1H spectrum of 1D on both axes are connected, 5 correlations can be observed: 1-2, 2-3, 3-4, 4-5, and 5-6. The result allows us to infer that 1Hs from 1 to 6 have a neighboring structure each. In addition, the COSY allows us to understand the connection between carbon atoms indirectly from the coupling information of neighboring 1Hs. The information is extremely important for determining the substructure.
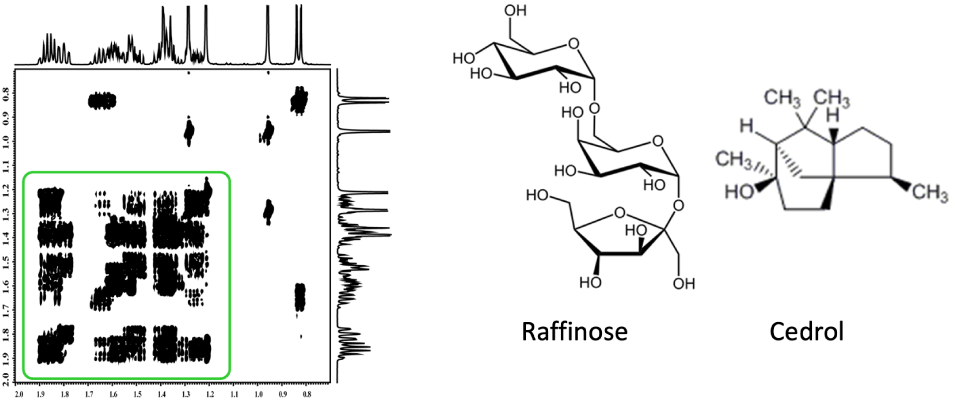
Fig. 2 Complex COSY spectrum
However, what happens when the COSY spectrum is as complex as the one in Fig. 2?
Looking at the region highlighted in green, you can see that the signals overlap, making it hard to identify correlations. In this situation, moving forward with structure determination seems almost impossible.
For compounds like polysaccharides or cyclic molecules, where 1H signals densely appear in a narrow range as in Figure 2, relying on COSY alone can lead to a dead end in structural analysis.
One solution for the situation when the COSY does not adequately analyze is TOCSY.
We will explain TOCSY in the next section.
What is TOCSY?
TOCSY(TOtal Correlation SpectroscopY)is a 2D NMR technique that allows you to visualize all 1Hs belonging to the same spin network at once. Because spin couplings propagate through the network, TOCSY reveals not only adjacent positions but also correlations across the entire spin system, making it highly effective for analyzing complex organic molecules, sugars, and amino acids. TOCSY is also known as HOHAHA(HOmonuclear HArtmann-HAhn spectroscopy), which essentially refers to the same experiment.
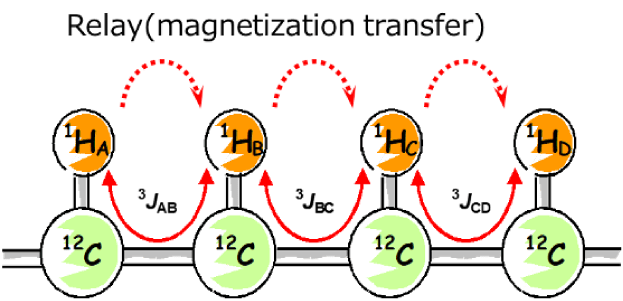
Fig. 3 Network of continuous 1H spin couplings
For example, suppose that there are atomic connections as shown in Figure 3. HA・HB・HC・HD are connected through spin couplings between neighboring 1Hs, and this connection is called spin system (spin network). The spin system does not propagate through quaternary carbons without attached H or 1H coupled via oxygen, so the network is interrupted at these points. TOCSY allows us to observe correlations between nuclei within the same spin system even if they are not directly coupled--for instance, between 1HA and 1HD. In TOCSY, the magnetization is transferred step by step: from HA to HB, then from HB to HC, and finally from HC to HD. In other words, magnetization moves through the spin system, connecting everything along the way. This magnetization transfer is called "relay". TOCSY observes the correlation signals based on this relay.
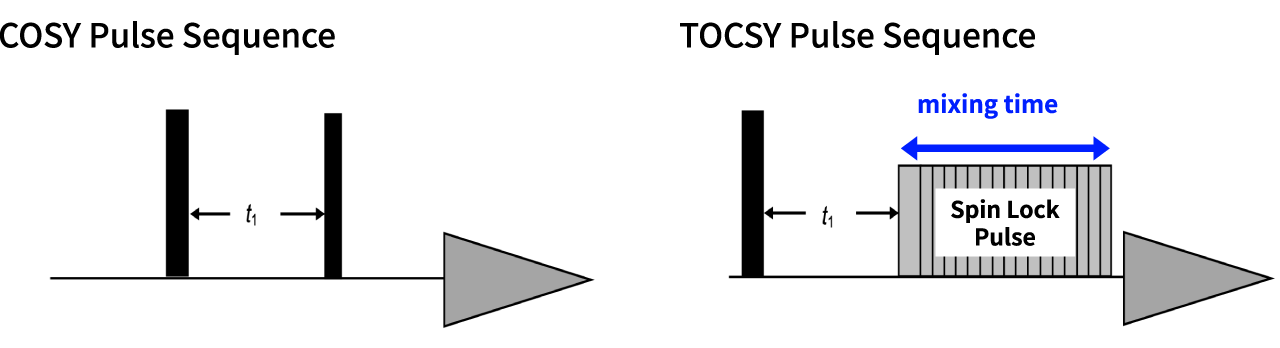
Fig. 4 Pulse sequences of COSY and TOCSY
Fig. 4 shows the pulse sequences for COSY and TOCSY. COSY uses two 90°pulses, while with the TOCSY, the second pulse is a spin lock pulse. The duration of this spin lock pulse is called "mixing time" , which is a key parameter with TOCSY. By increasing the mixing time, you can observe correlation signals that have been relayed over longer distances within the spin system.
Mixing time and correlation signal of TOCSY
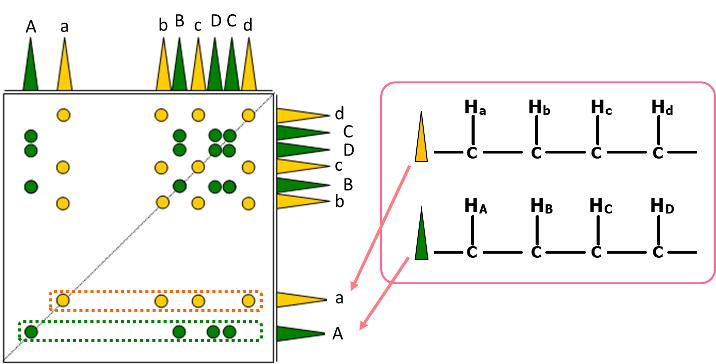
Fig. 5 Schematic diagram of TOCSY spectrum
Fig. 5 shows a schematic diagram of a TOCSY spectrum of a compound having two independent spin networks. Each spin network is expressed in yellow and in green. As shown, TOCSY observes correlation of all 1Hs belonging to each spin network. At that time, if signals like "A" and "a" within the primary spectrum on both axes appear away from the region where signals appear densely, the signals are easily classified separately in the networks of yellow and green, enabling confirmation of each spin network.
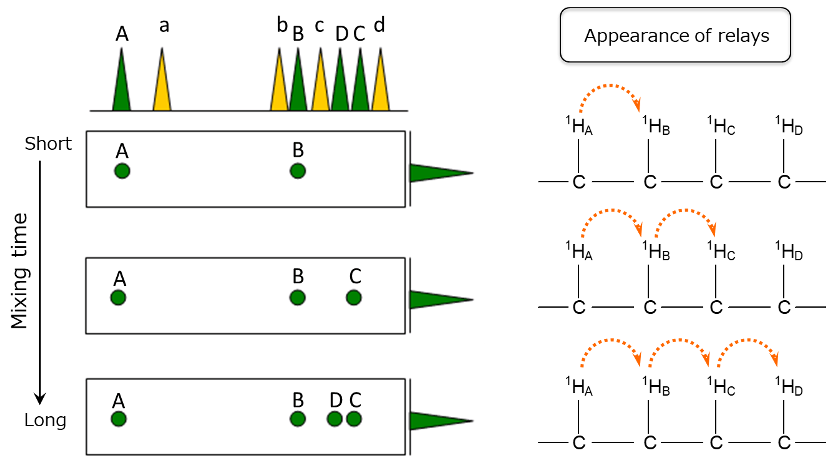
Fig.6 Schematic diagram of TOCSY(Correlation of A)
Next, let's look at how the correlation signal of A changes when the mixing time is varied.
Figure 6 is an enlarged view of the correlation of A from the schematic TOCSY diagram in Figure 5.
With a short mixing time, the magnetization of 1HA moves only to the neighboring 1HB, and the correlation signal B with 1HB appears.
When the mixing time is further increased, the magnetization moves to 1HC, and correlation signal C appears. When the mixing time is increased even more, the magnetization moves to 1HD, and correlation signal D appeared. As a result, it becomes clear that there is a connection of 1HA - 1HB - 1HC - 1HD.
The longer the mixing time, the farther the magnetization can move. Therefore, if a sufficiently long mixing time is used, the magnetization can be transferred through all 1Hs within the same spin system, allowing the detection of correlation signals for all 1Hs in that spin system.
Furthermore, by comparing spectra obtained with different mixing times, the sequential order of the 1H connections can also be known.
Example of analysis for sucrose using 2D TOCSY
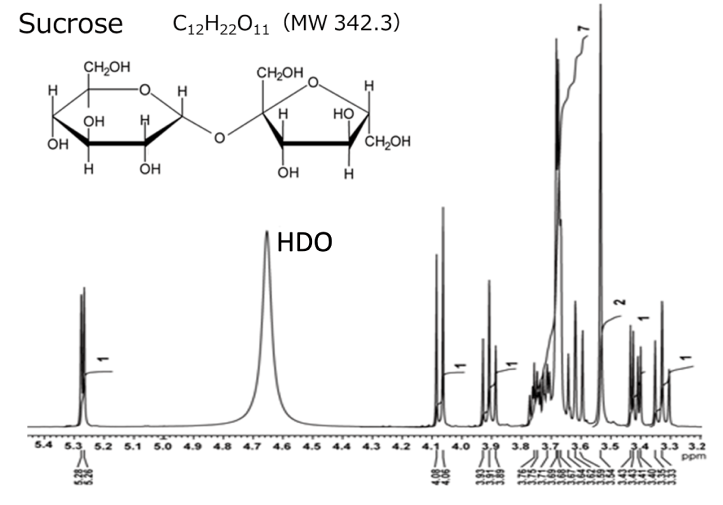
20 mg / 0.6 mL D2O solution(400 MHz)
Here, we present an example of analysis for sucrose using 2D TOCSY. Sucrose is a disaccharide composed of glucose and fructose linked by a glycosidic bond. Sucrose contains a total of 22 1Hs, but since the sample is dissolved in heavy water, the 1Hs of the hydroxyl groups (-OH) are not observed due to deuterium exchange. Therefore, in this case, 14 1Hs are observed, excluding the 8 1Hs of hydroxyl group.
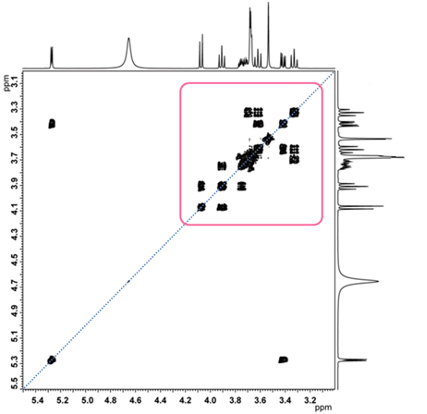
Fig.7 COSY spectrum of sucrose
Let us show you the COSY spectrum of sucrose in Fig. 7. The part highlighted in the red frame is enlarged and shown in Fig. 8.
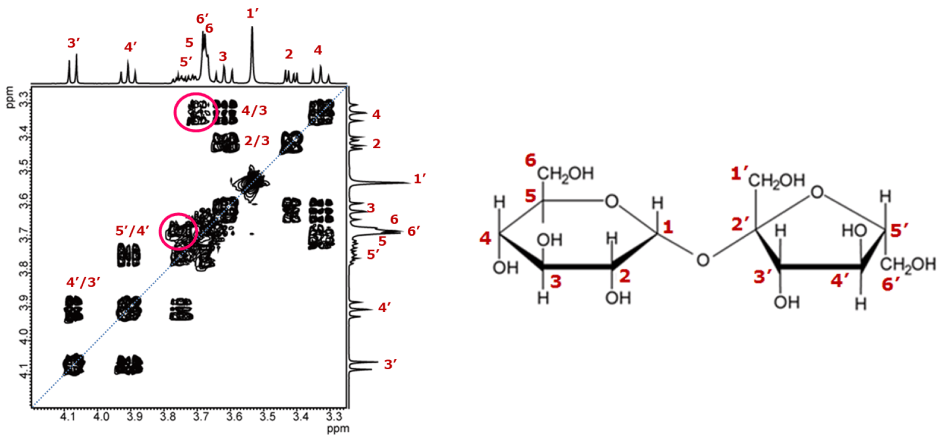
Fig. 8 COSY spectrum of sucrose
In Figure 7, six correlation signals can be found relatively easily.
However, it is difficult to interpret the correlations of signals appearing in areas where chemical shifts are close to each other, such as those indicated by the red circles in Figure 8. Many people may get stuck at this point in the analysis.
Therefore, we will try using the TOCSY method.
TOCSY spectrum with mixing time of 20ms
TOCSY spectrum with mixing time of 150ms
Fig. 9 TOCSY spectra measured with mixing times set to 20 ms and 150 ms
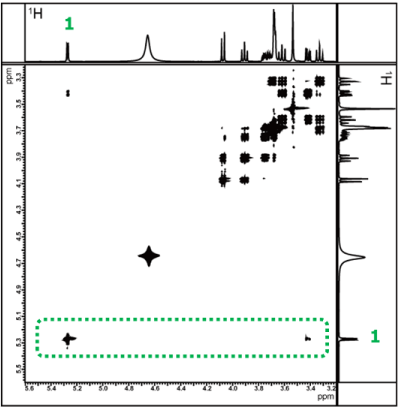
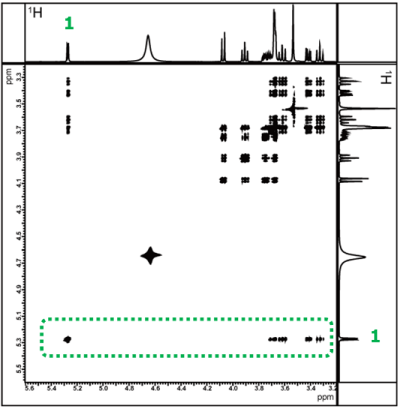
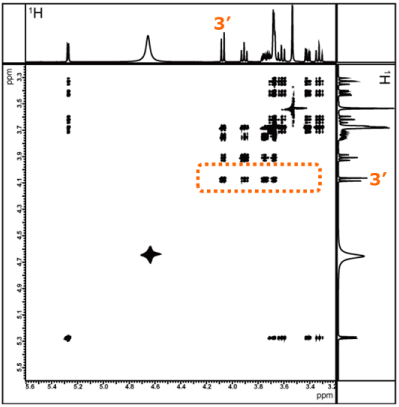
Figure 9 shows the TOCSY spectra measured with mixing times set to 20 ms and 150 ms, respectively. First, we focus on the correlation signal of the 1H at the anomeric position of glucose, which appears at a chemical shift well away from other signals. As shown earlier in Figure 6, we will examine how the correlation signals change with different mixing times, to confirm the relay information from the 1H at the anomeric position. It can also be observed that more correlation signals appear as the mixing time increases. Furthermore, for regions where signals overlap, it is easier to compare by using sliced data rather than the 2D spectrum. Therefore, we will compare each 1D spectra obtained by extracting slices along the X-axis (in the area indicated by the green frame) for the confirmation of correlation signal of the 1H.
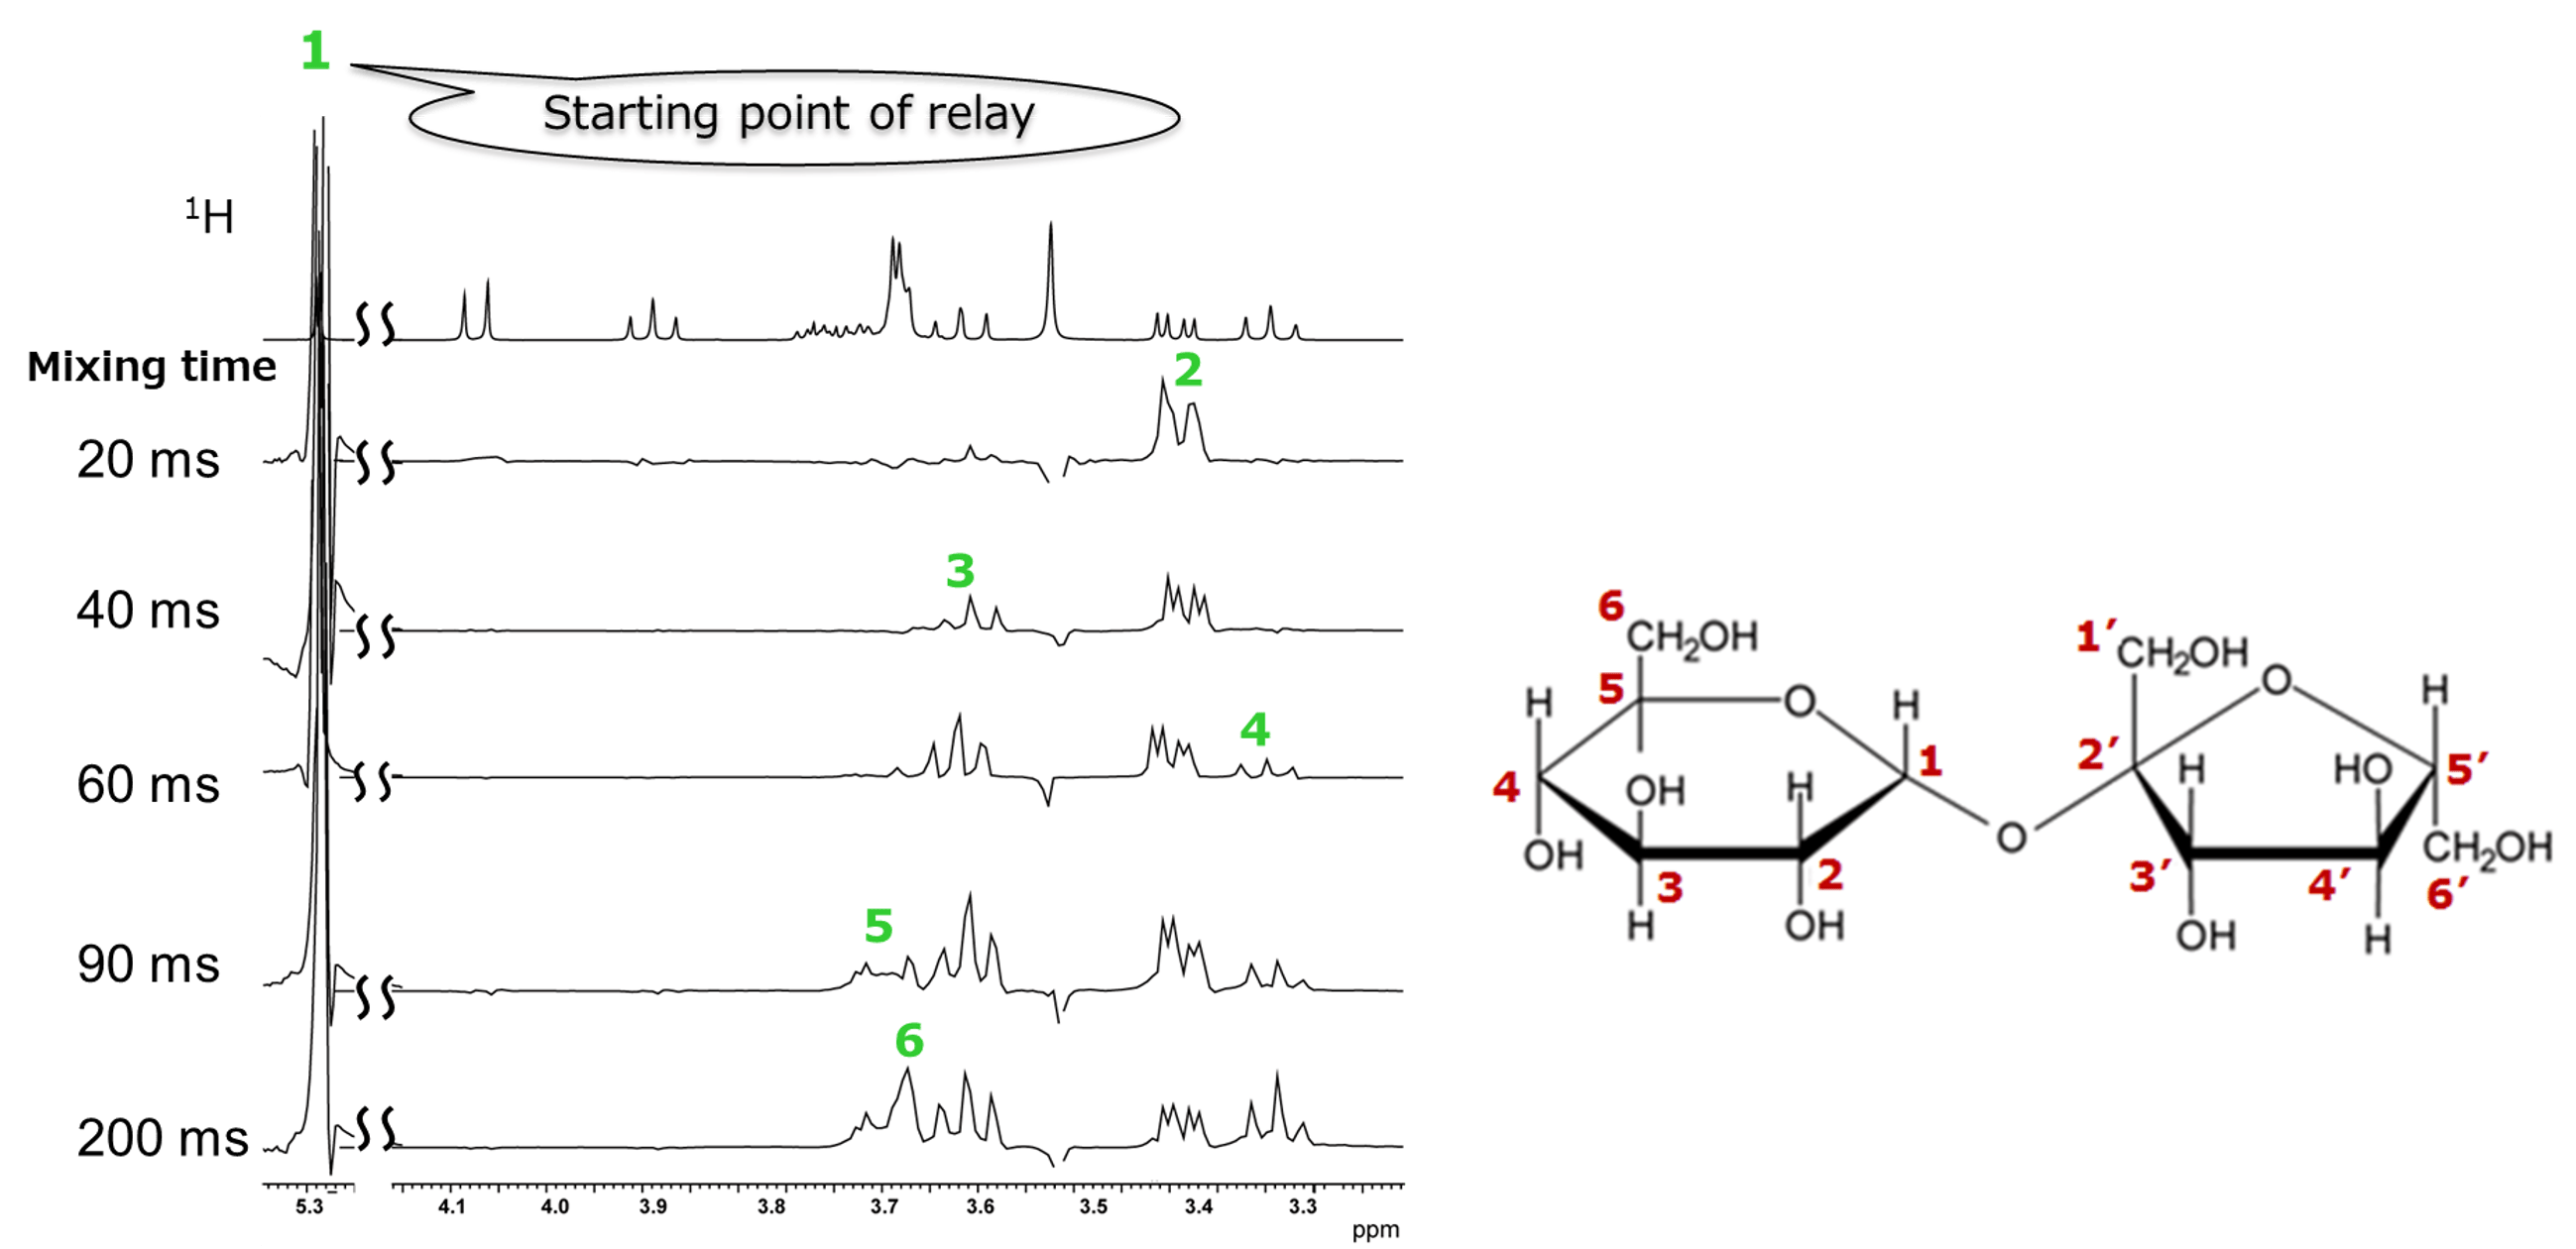
Figure 10. One-dimensional spectra sliced along the X-axis for the correlation signal of the 1H at the anomeric position of sucrose
The top spectrum in Figure 10 shows a conventional 1H spectrum. Below it are sliced data obtained with mixing times varied from 20 ms to 200 ms. The signal on the left corresponds to the Glu H-1, which we consider as the starting point of the relay. At a mixing time of 20 ms, only the correlation with the neighboring Glu H-2 appears, revealing only the connection between positions 1 and 2. As the mixing time increases, correlation signals appear sequentially, and eventually, the connections from position 1 to position 6 in the glucose moiety can be confirmed. While it was difficult to clearly identify the correlation partner of the Glu H-5 using COSY, TOCSY provided this information.
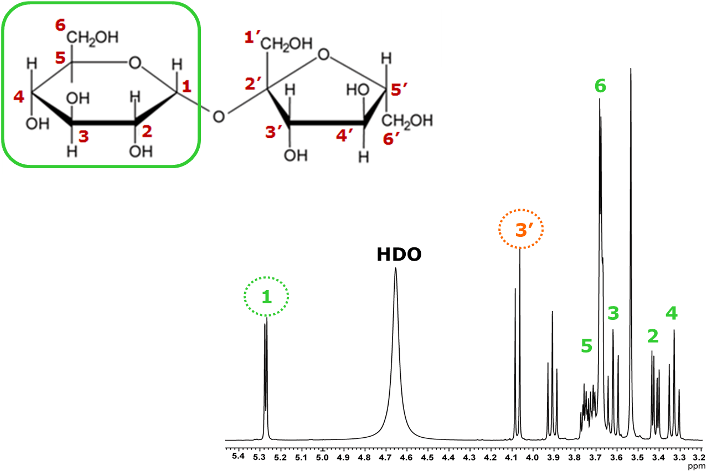
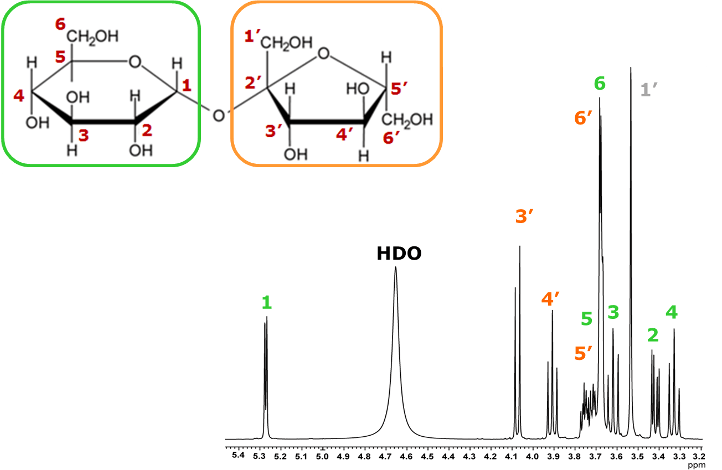
Next, let us examine the relay starting from the Fru H-3′.
As with the sucrose moiety, Figure 11 shows the TOCSY spectra obtained with different mixing times.
TOCSY spectrum measured with
mixing time of 20ms
TOCSY spectrum measured with
mixing time of 150ms
Figure 11. TOCSY spectra measured with mixing times set to 20 ms and 150 ms
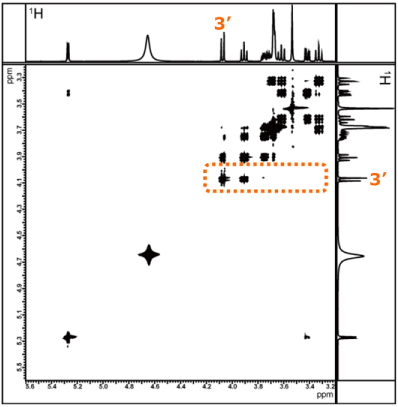
As before, we compare sliced data along the X-axis for a signal that appears in a region without significant overlap--this time focusing on the Fru H-3′.
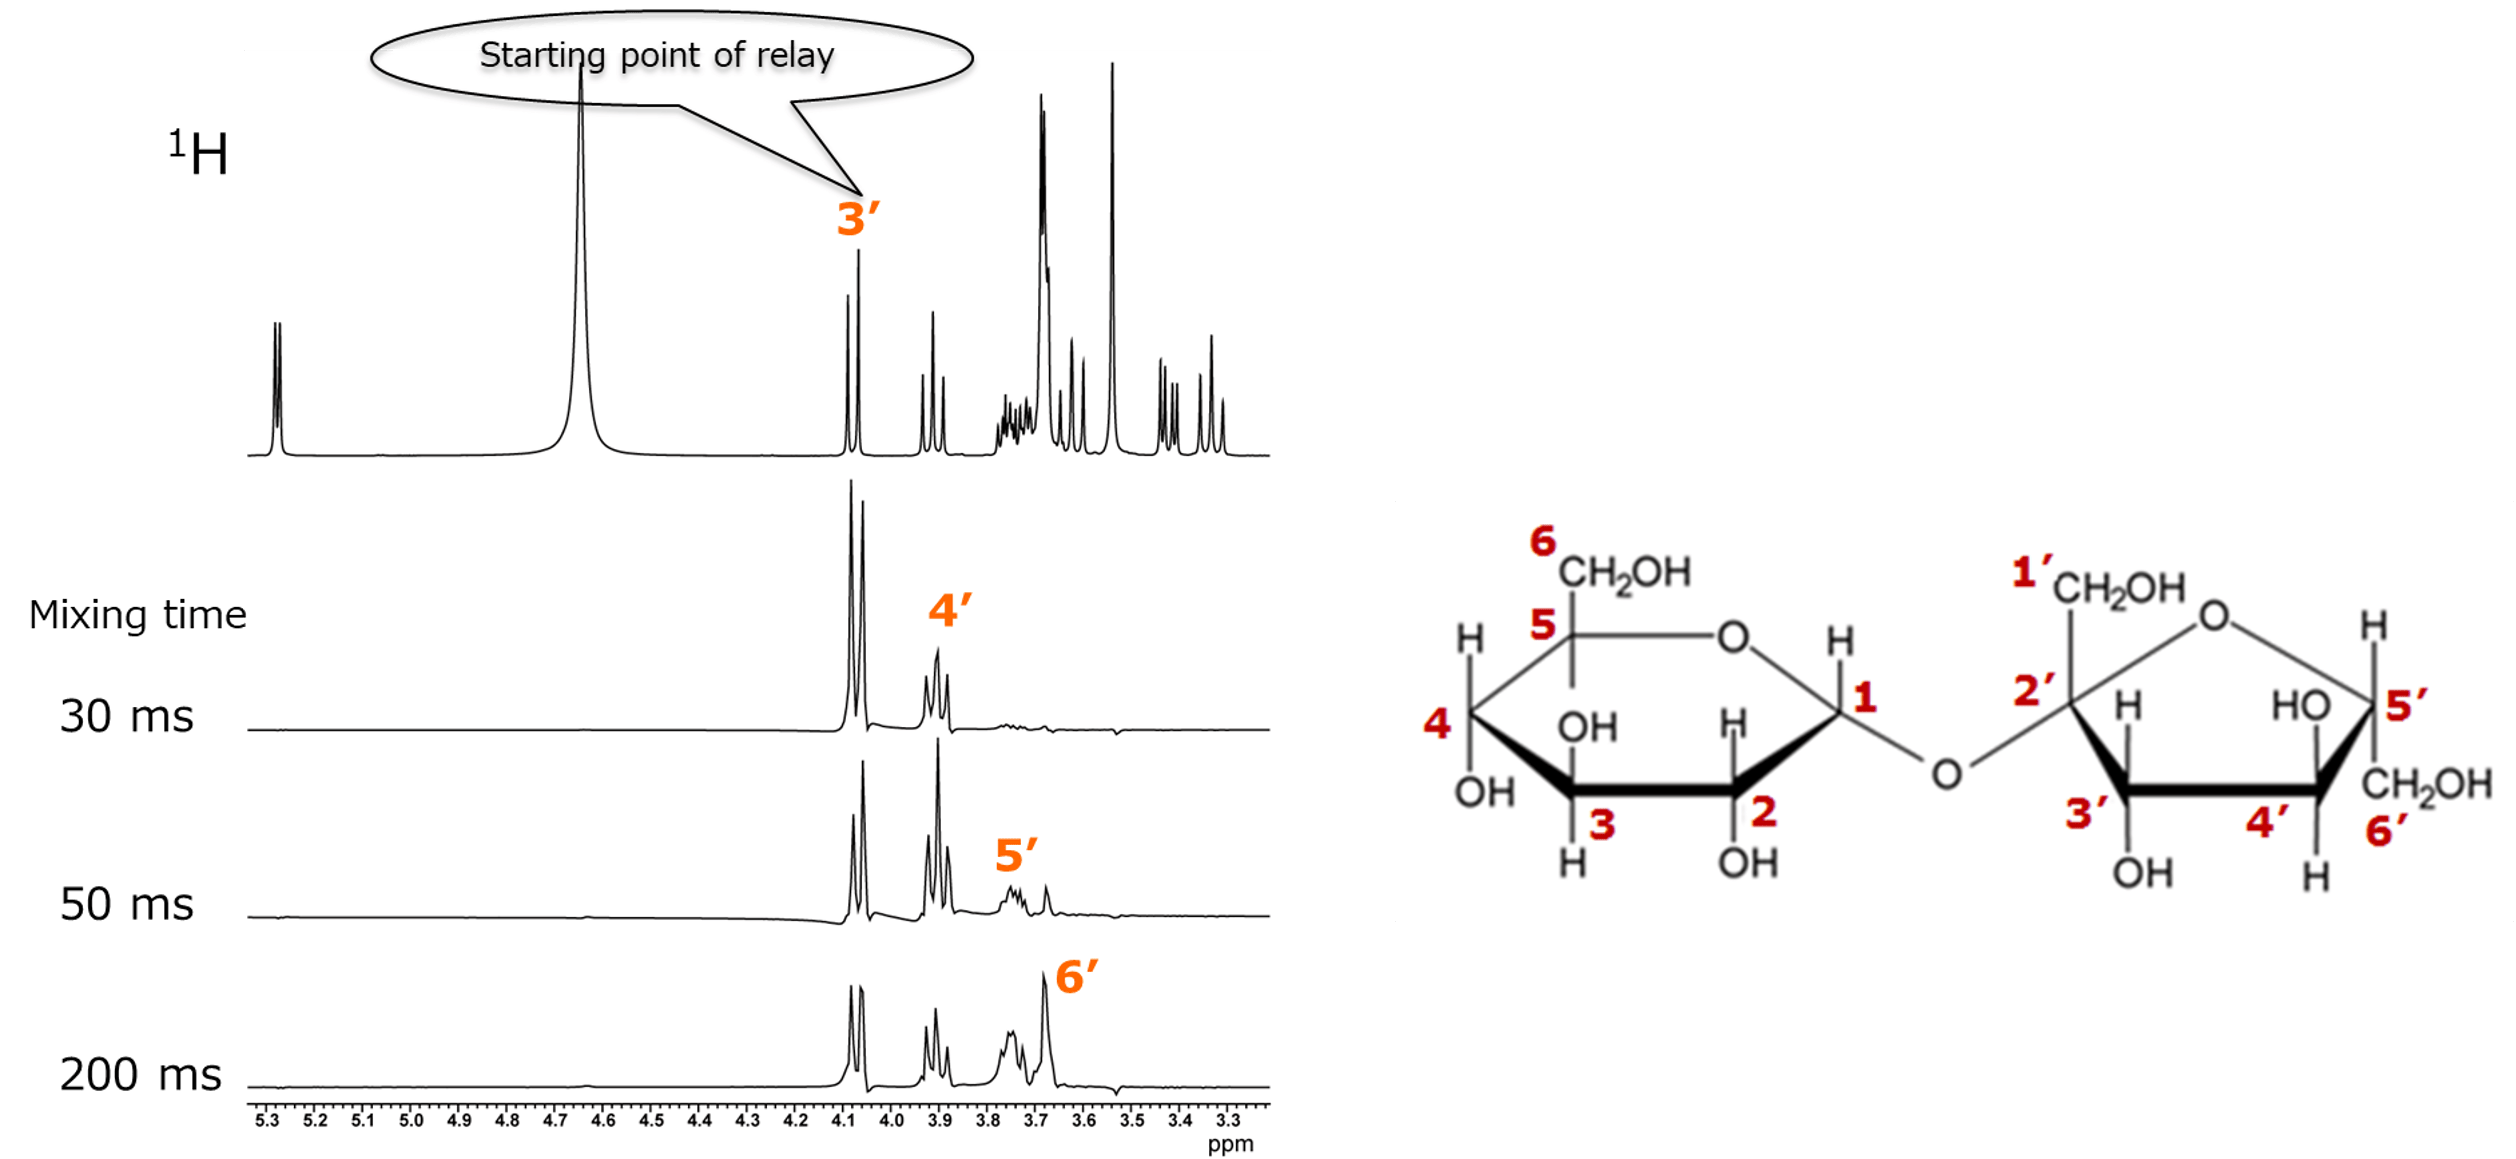
Fig. 12 One-dimensional spectra sliced along the X-axis for the correlation signal of the H-3′ proton of fructose
The top spectrum in Figure 12 shows a conventional ¹H spectrum, and below it are sliced data obtained with different mixing times.
As before, we take the Fru H-3′ as the starting point of the relay. As the mixing time increases, correlations with the Fru H-4′, Fru H-5′, and Fru H-6′ appear, allowing us to confirm the connections within the fructose moiety.
In this way, TOCSY enables the separation of spin networks within a compound that contains multiple spin networks. By varying the mixing time, it is also possible to assess the distance from the starting 1H. Even when the COSY spectrum becomes complicated, using TOCSY provides significant assistance in determining the molecular structure.
Example of analysis for glucose using 1D TOCSY
1D TOCSY is the one-dimensional version of 2D TOCSY, and the basic principle is the same.
While 2D TOCSY is used to analyze the spin network of the entire molecule, 1D TOCSY is more effective when you want to examine only the spin system to which a specific 1H belongs. 1D TOCSY observes the magnetization transfer--i.e., the relay--from a selectively excited 1H. By gradually increasing the mixing time, the propagation of the magnetization relay along the spin network can be tracked. For selective excitation, it is best to choose a 1H whose chemical shift is sufficiently separated from other signals.
Another advantage of 1D measurement is that, compared to 2D measurement, it offers higher digital resolution and makes it easier to avoid signal overlap.
Now, let us present an example of glucose analysis.
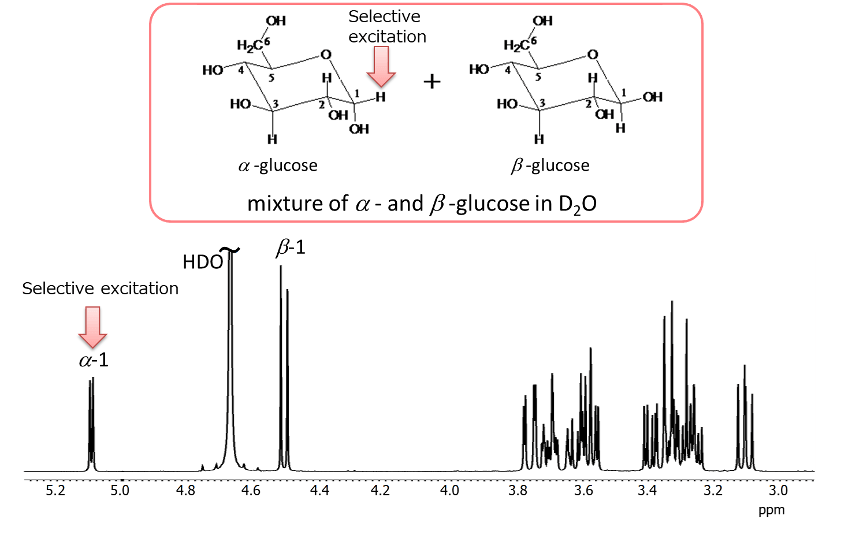
Fig 13. 1H spectrum of glucose
Glucose exists in aqueous solution as α- and β-anomers. Therefore, the 1H NMR spectrum is a mixed spectrum of α-glucose and β-glucose, as shown in Figure 13. For selective excitation of a 1H signal, it is typically to choose 1H appearing at a lower field than others(in the case of sugars, 1H at the anomeric position). The result of a 1D TOCSY experiment by selectively exciting the anomeric 1H at position 1 of α-glucose is shown in Figure 14.
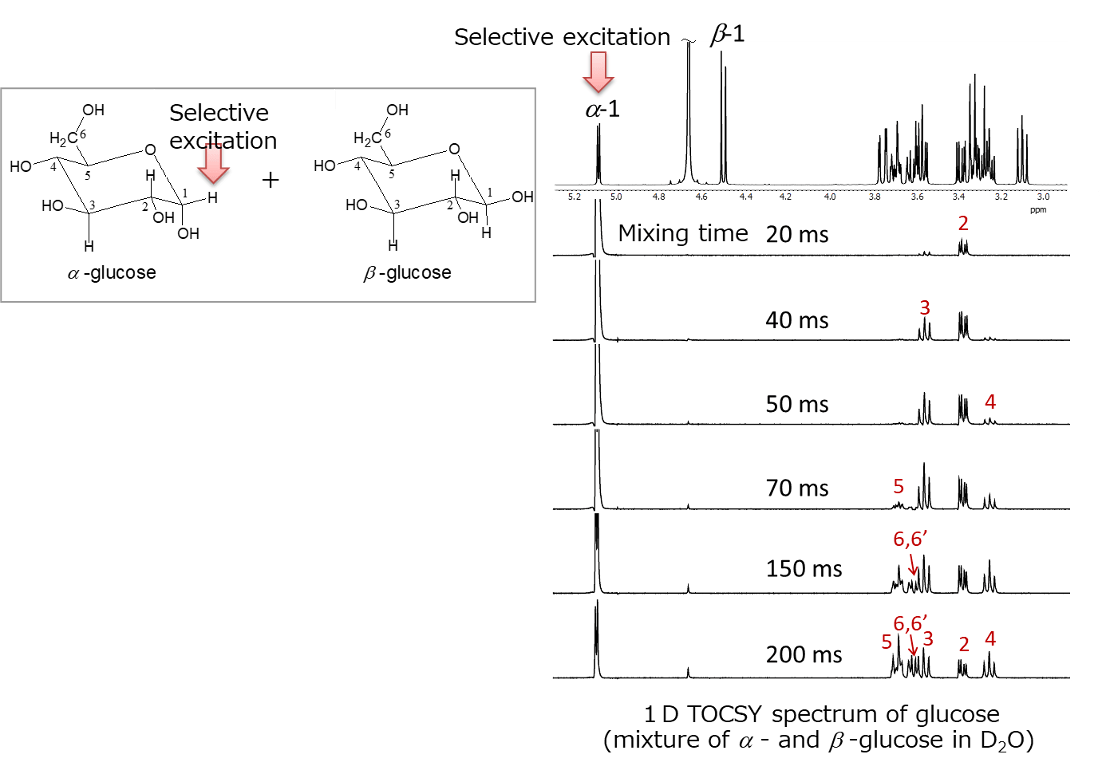
Fig.14 1D TOCSY spectrum of glucose
By varying the mixing time from 20 ms to 200 ms, it was possible to trace the spin network starting from the anomeric 1H at position 1 of α-glucose as the relay point. The bottom spectrum with a mixing time of 200 ms represents the extraction of only the spin network of α-glucose from the mixed spectrum of α-glucose and β-glucose. Furthermore, as explained earlier, 1D TOCSY provides better digital resolution than 2D sliced data.
Thus, 1D TOCSY is more effective for extracting and confirming spin systems connected through spin couplings from crowded spectra.
It is recommended to use 1D TOCSY and 2D TOCSY appropriately depending on the purpose.
Related Application
Contact
If you are interested in spin network analysis using TOCSY or HSQC-TOCSY, or in details about NMR instruments, please feel free to contact JEOL. With a wealth of application examples and technical support, we will strongly support your molecular structure analysis.
Products
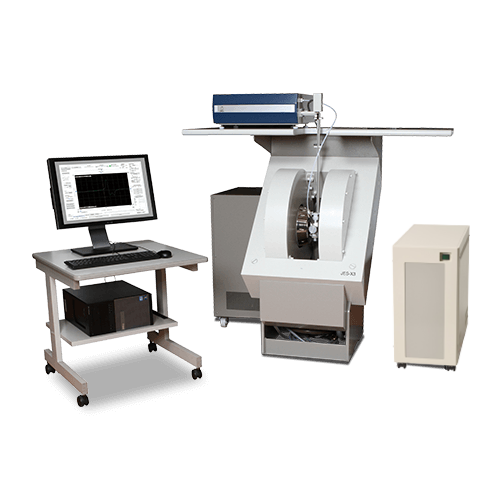
Nuclear Magnetic Resonance Spectrometer (NMR)
NMR is the abbreviation for Nuclear Magnetic Resonance. It is an instrument used to observe the resonance phenomenon of nuclear spins by placing atomic nuclei in the magnetic field to analyze molecular structure of a substance at an atomic level. Specifically, it is useful in the analysis of organic compounds and polymer materials and used in the fields of pharmaceutical, biology, food, and chemistry. The application is even recently expanding to include the analysis of structural and physical properties of inorganic materials such as ceramics and batteries.
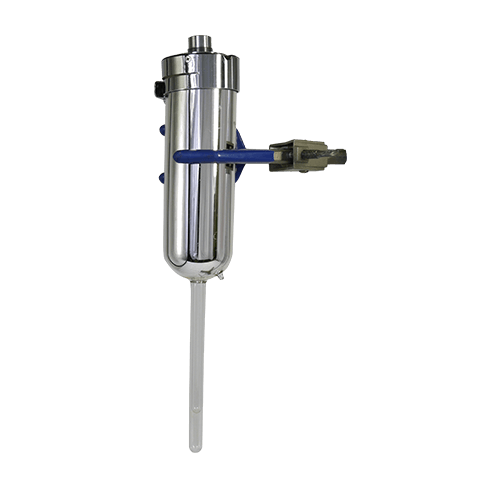
NMR Probes
With NMRs, the detector (probe) differs depending on the sample form and measurement technique. JEOL offers solution and solid probes for a wide variety of purposes.
NMR Magnets
Space-saving design with a compact superconducting magnet.
Greater flexibility of installation layout of the instrument is possible with the new compact magnets that have a smaller stray magnetic field.
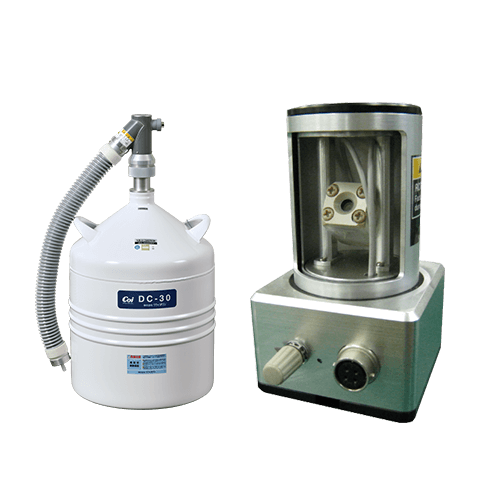
NMR Peripherals
Introducing NMR peripherals such as the Auto Sample Changer and Nitrogen Replenishment System.

Electron Spin Resonance Spectrometer (ESR)
Electron Spin Resonance (ESR) is a powerful analytical method to detect, analyze and determine thecharacteristics of unpaired electrons in a substance. It is clear that the state of electrons in a substance have a strong influence on its characteristics and functionality, so evaluation by ESR is becoming more and more important. Many types of substances, from electronic materials to catalysts, biological samples, can be studied regardless of whether they are solid, liquid, or gas. A wide range of ESR techniques are possible using suitable attachments together with the basic instrument.
ESR Peripheral Equipment
We have ESR attachments and consumables that can make a versatile measurement possible.
JEOL Ltd.
Since its foundation in 1949, JEOL has been committed to the development of cutting-edge scientific and metrology instruments, industrial and medical equipment.
Today, many of our products are used throughout the world and we are highly regarded as a truly global company.
Aiming to be a 'top niche company that supports science and technology around the world', we will continue to respond precisely to the increasingly sophisticated and diverse needs of our customers.