Spectroscopic separation of mixed organic fluorine compounds by 2D 19F–19F TOCSY
—To extract 1D 19F NMR spectrum of each compound—
NM230004E
Perfluoroalkyl compounds are often found in research fields such as pharmaceuticals and agrochemicals. There are increasing demands for 1D 19F NMR, which is a powerful tool to characterize these compounds. Sensitivity of 19F is the second highest after 1H, which facilitates to obtain a 19F NMR spectrum. Furthermore, the observation range of 19F chemical shifts in fluorocarbons is very large and signals show good dispersion. However, 19F NMR analysis of a mixture of these compounds are generally very complicated. This is because similarity of the chemical properties of each compound often occurs overlaps of the signals. For the same reason, purification by using chromatographic techniques is difficult. Therefore, it’s convenient if a 1D 19F NMR spectrum of each compound is directly obtained from a mixture.
2D TOCSY is known as a method which enables to obtain a 1D NMR spectrum from a mixture. To measure a 19F–19F TOCSY [1] with high field NMR equipment, a radio frequency (RF) covering wide spectrum width of 19F is necessary. However, it’s difficult to use such a RF, so 19F TOCSY has not been generally used. Recently, to address the wide 19F chemical shift range, 2D 19F TOCSY with BURBOP spin lock (Fig. 1) was reported [2]. Here, this application note explains a method to extract a 1D 19F spectrum of each compound from a mixture by using 2D 19F TOCSY with BURBOP spin lock.
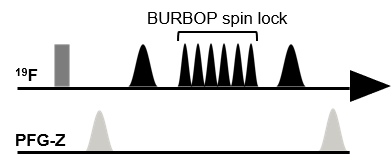
Fig. 1. 19F TOCSY pulse sequence with BURBOP spin lock.
Spectroscopic separation of a mixture by 2D 19F TOCSY
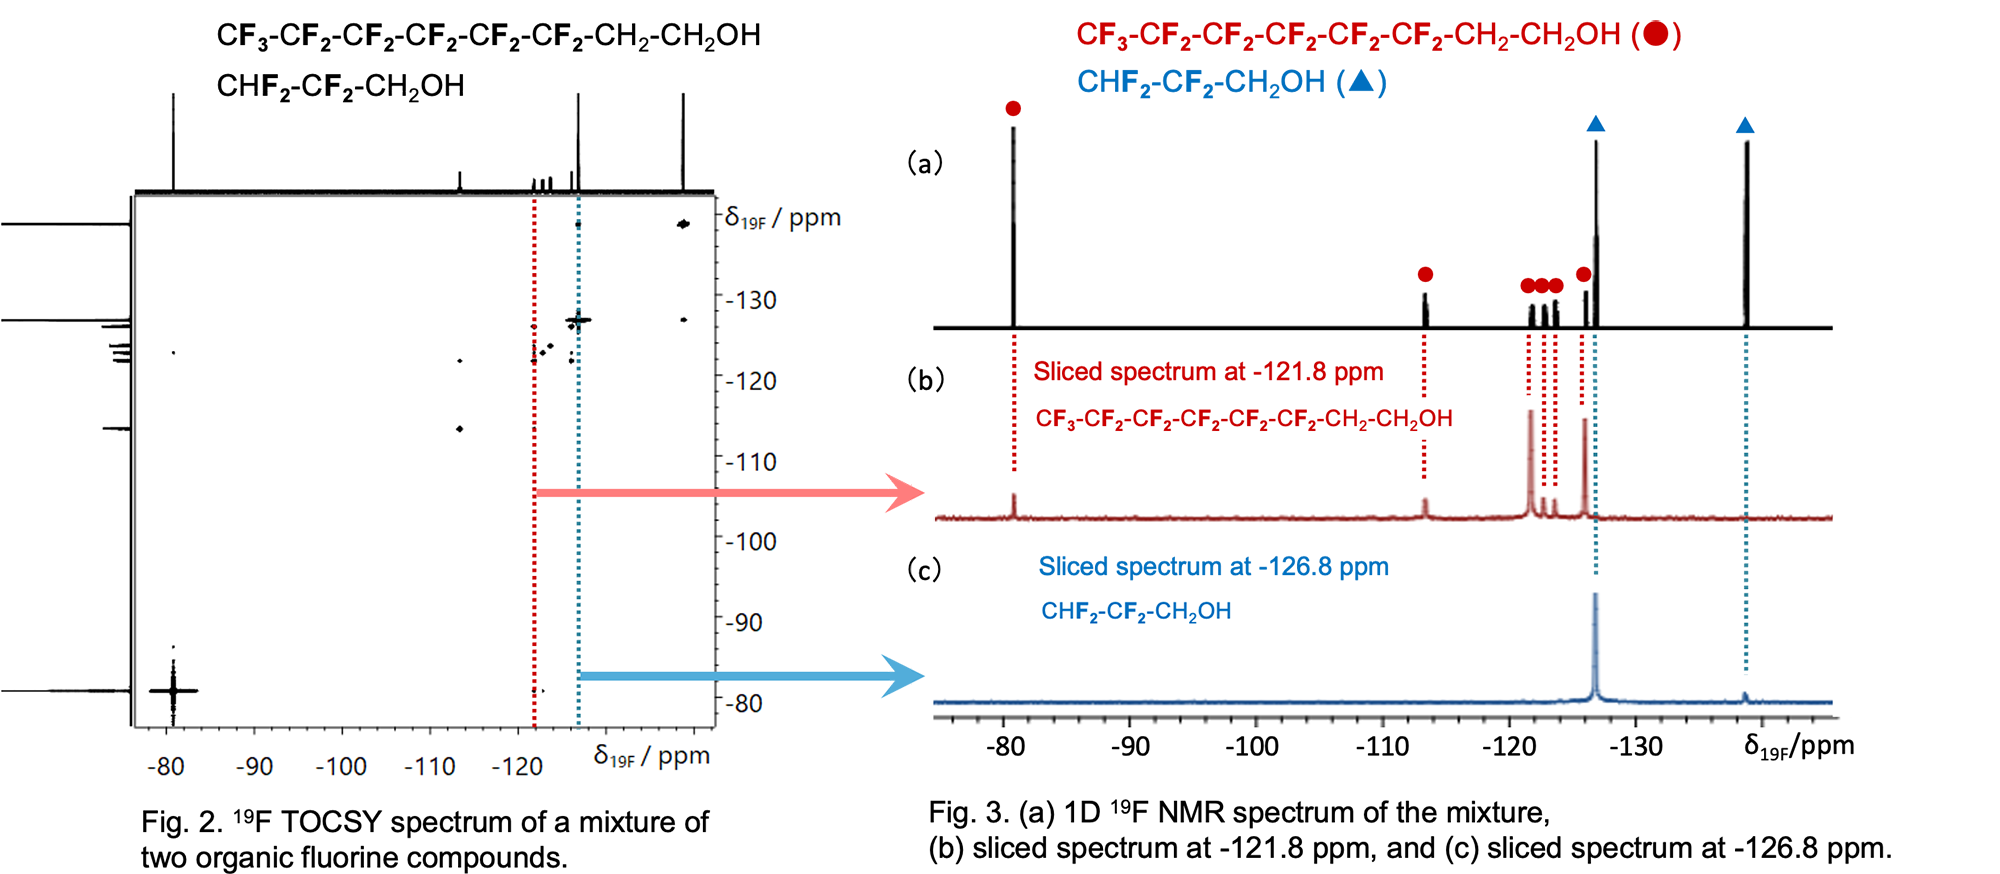
In 2D TOCSY, when measured with a sufficiently enough long mixing time, magnetization transfer occurs in all coupled spins. Therefore, a 1D 19F NMR spectrum of each compound can be extracted. As an example, Figure. 2 shows a 2D 19F TOCSY of two organic fluorine compounds. Two sliced data were made at -121.8 ppm (red dotted line) and -126.8 ppm (blue dotted line), respectively. Figure. 3 shows (a) the 1D 19F spectrum of the mixture, (b) the sliced data at -121.8 ppm, and (c) at -126.8 ppm. Each sliced data is equivalent to the 1D 19F spectrum of each compound. As you can see, each 1D 19F spectrum is successfully extracted from 2D 19F TOCSY.
Equipment: JNM-ECZL400S (Delta NMR software V6.3), ROYALPROBE™ HFX, Pulse sequence: 19f_tocsy_burbop_abs_pfg.jxp,
Sample: 2,2,3,3-tetrafluoro-1-propanol and 3,3,4,4,5,5,6,6,7,7,8,8,8-tridecafluoro-1-octanol in CDCl3
[1] Anal. Chem., 65, (1993) 752-758, [2] J. Magn. Reson., 285, (2018) 143-147.
Related products
Are you a medical professional or personnel engaged in medical care?
No
Please be reminded that these pages are not intended to provide the general public with information about the products.