GCxGC data analysis of msFineAnalysis AI Ver. 3 ③Pyrolysis oil
MSTips No. 511
Introduction
The qualitative analysis software msFineAnalysis AI enables automatic structure analysis of unknown compounds not registered in libraries through EI/FI integrated analysis and AI structure analysis. Version 3 newly supports comprehensive 2D GC (GCxGC) data analysis. MSTips 509 introduced the usefulness of EI/FI integrated analysis using diesel fuel analysis, and MSTips 510 introduced the usefulness of AI structure analysis using polymer pyrolysis analysis. This MSTips introduces technique for comparing samples and identifying differential peaks using 2D chromatograms, using pyrolysis oil analysis. Pyrolysis oil is derived from discarded plastics and rubber products. It is used as an alternative fuel to petroleum and as a raw material for recycled plastics, making it one of the key technologies contributing to the circular economy.
Experiment
The pyrolysis oil sample was produced by mixing polyethylene (PE), polypropylene (PP), and polyvinyl chloride (PVC) pellets, then heating at 500°C for 15 minutes in a helium atmosphere. Figure 1 shows a schematic diagram producing pyrolysis oil a table of polymer pellet amount. The generated pyrolysis oil was washed away with chloroform and collected, and 1 μL of the diluted oil was injected into GC.
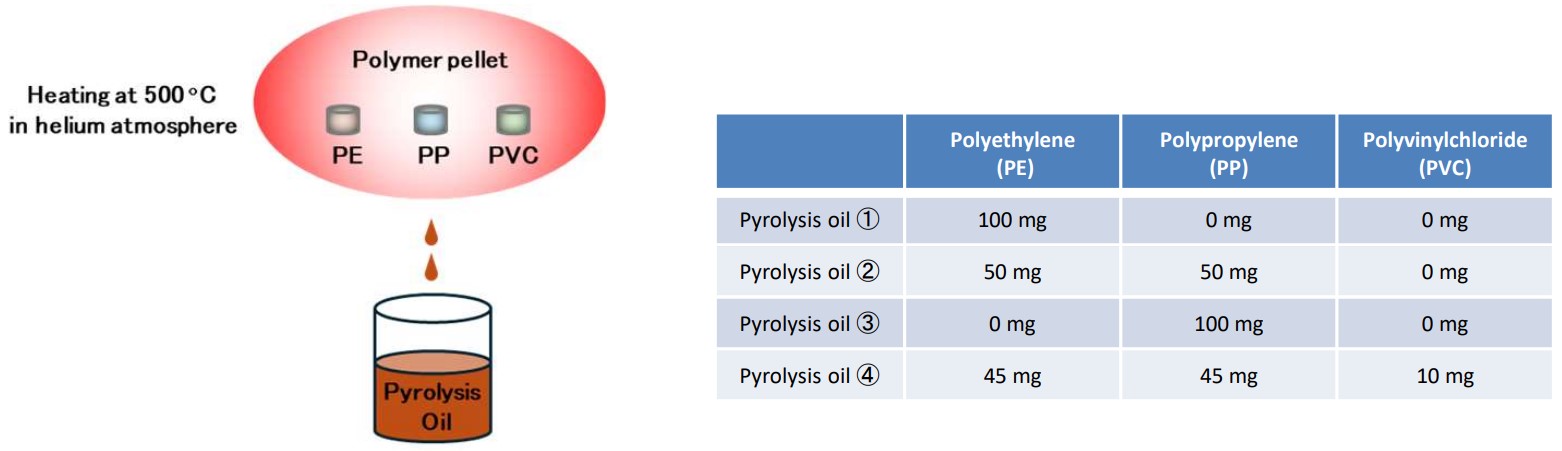
Figure 1 Schematic diagram of producing pyrolysis oil and table of polymer pellet amount
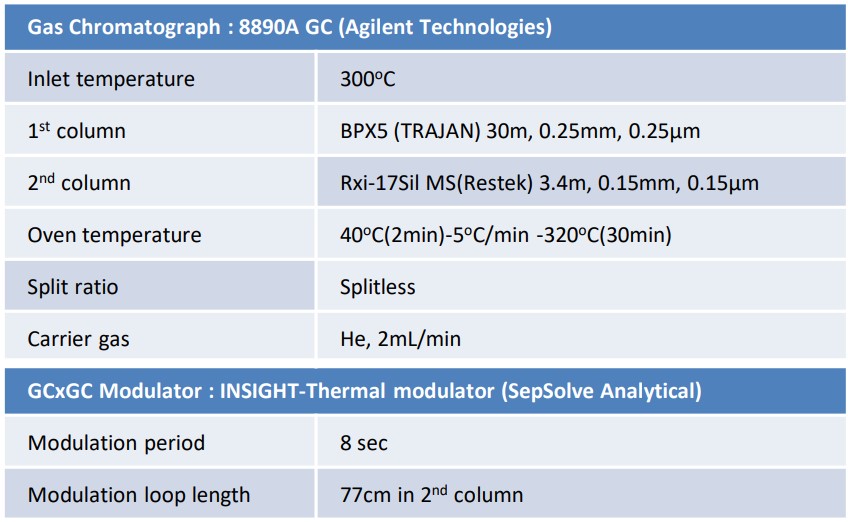
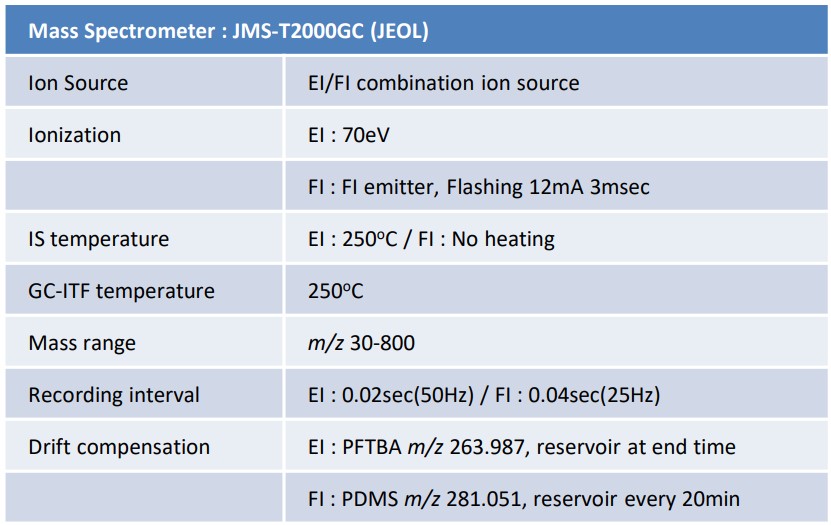
Table 1 Analytical conditions
Results
Figure 2 shows the 2D chromatograms of pyrolysis oils ② (PE/PP) and ④ (PE/PP/PVC). In addition to the main components, the pyrolysates of PE/PP, trace components such as naphthalene and anthracene, which are the pyrolysates of PVC, could also be easily confirmed in the 2D chromatogram.
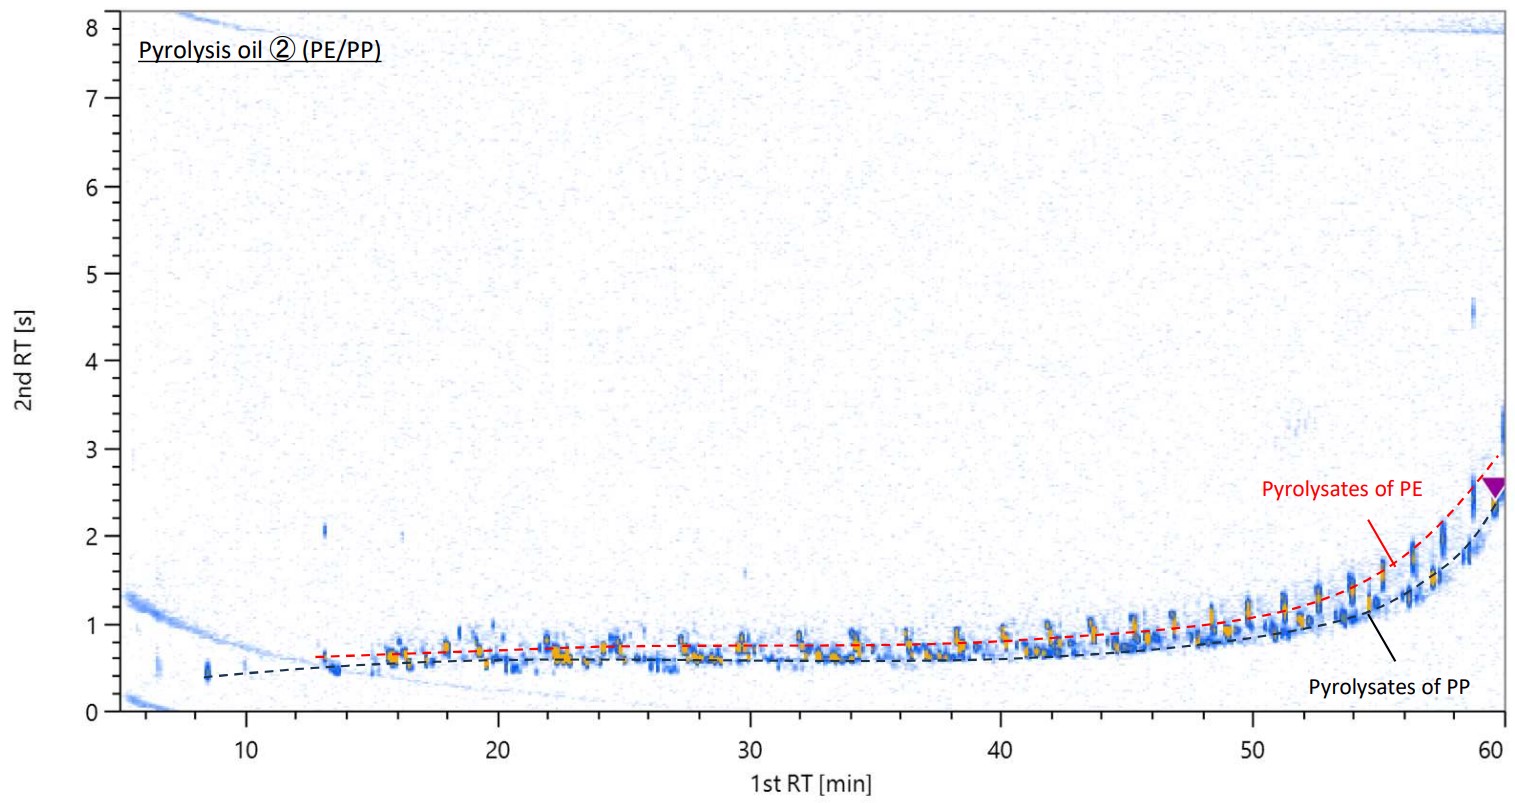
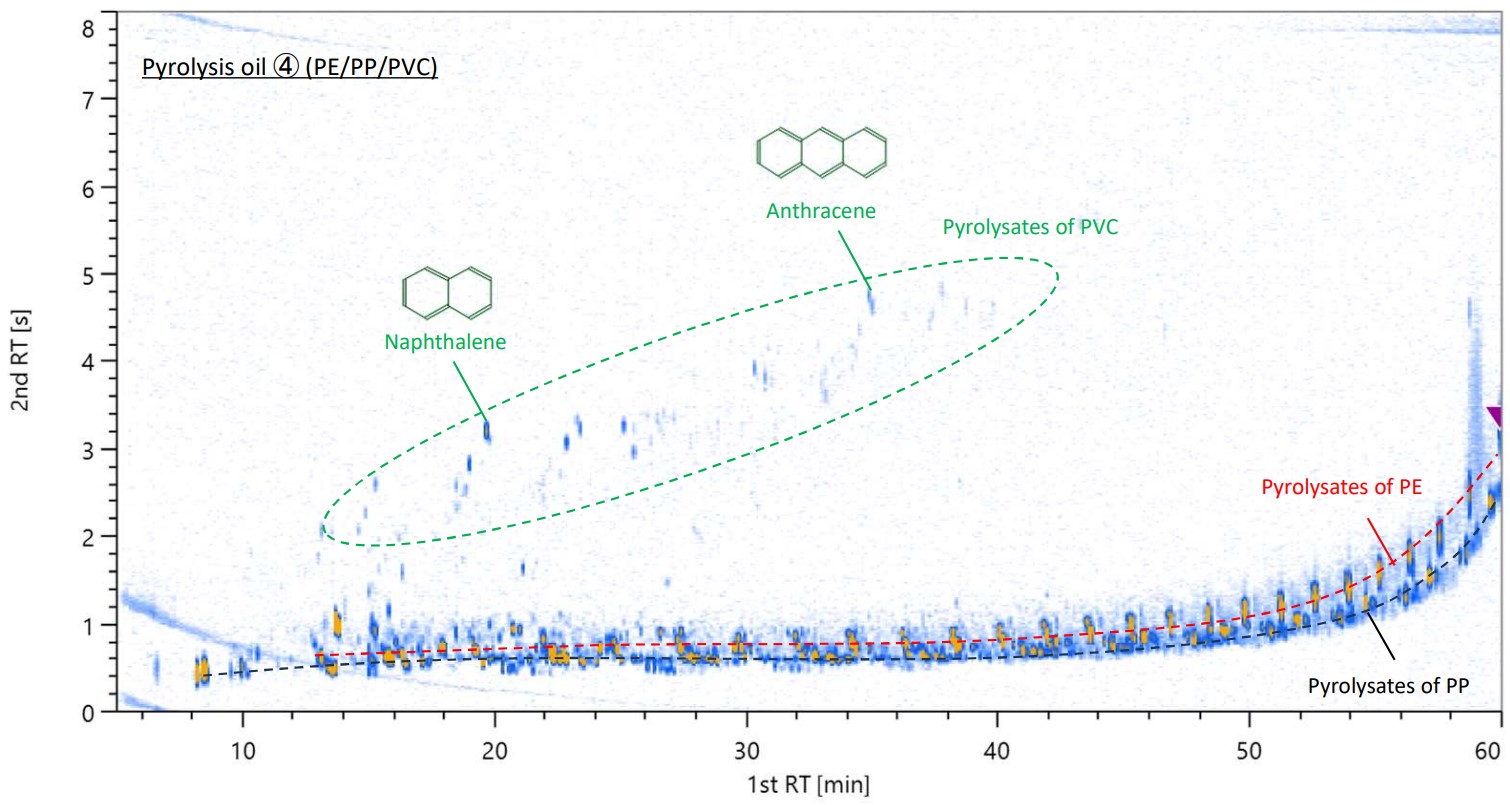
Figure 2 2D chromatograms of pyrolysis oil ② and ④
Figure 3 shows enlarged 2D chromatograms of pyrolysis oils ① (PE), ② (PE/PP), and ③ (PP). Although the pyrolysis oils used in this study contained up to three types of base polymers, more than 200 peaks were detected. The 2D chromatograms obtained by GCxGC-MS allowed for clear separation and detection of these numerous peaks, and the peak distribution made it easy to infer compound structures.
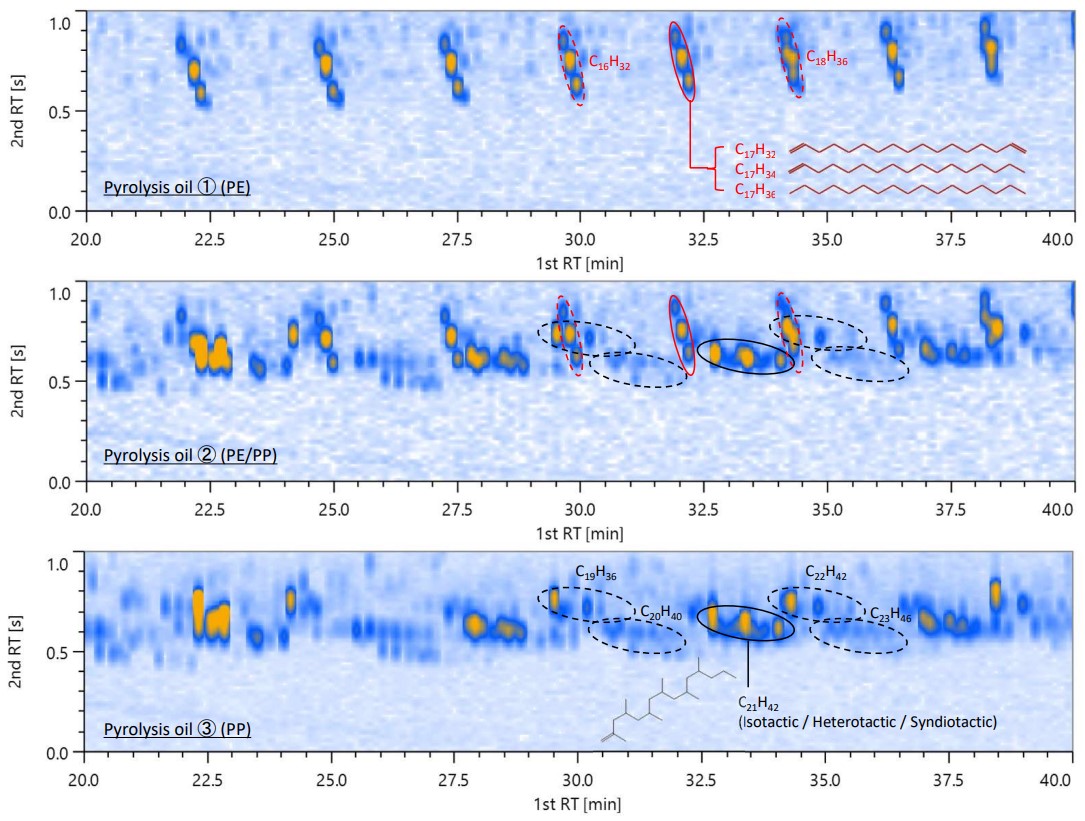
Figure 3 2D chromatograms of pyrolysis oil ①, ②, ③ (Enlarged view)
Conclusion
With the new support for GCxGC data analysis in msFineAnalysis AI Ver.3, it is now possible to visualize qualitative information from complex samples such as pyrolysis oils and to quickly compare multiple samples.
Acknowledgement
We would like to express our sincere gratitude to Associate Professor Shogo Kumagai and Professor Toshiaki Yoshioka of Tohoku University for providing the pyrolysis oil samples used in this MSTips.
Solutions by field
Related products
Related information
Are you a medical professional or personnel engaged in medical care?
No
Please be reminded that these pages are not intended to provide the general public with information about the products.