Multifaceted analysis of styrene butadiene rubber (SBR) product using FD and Pyrolysis-GC-MS method of JMS-T2000GC
MSTips No. 481
Introduction
SBR is a synthetic rubber made from a copolymer of styrene and 1,3-butadiene. It is used in many products, such as automobile tires, because it is easy to process and can be supplied at a low cost and of high quality. When used as a product, it is common to blend it with other polymers and add additives to improve physical properties and vulcanization speed.
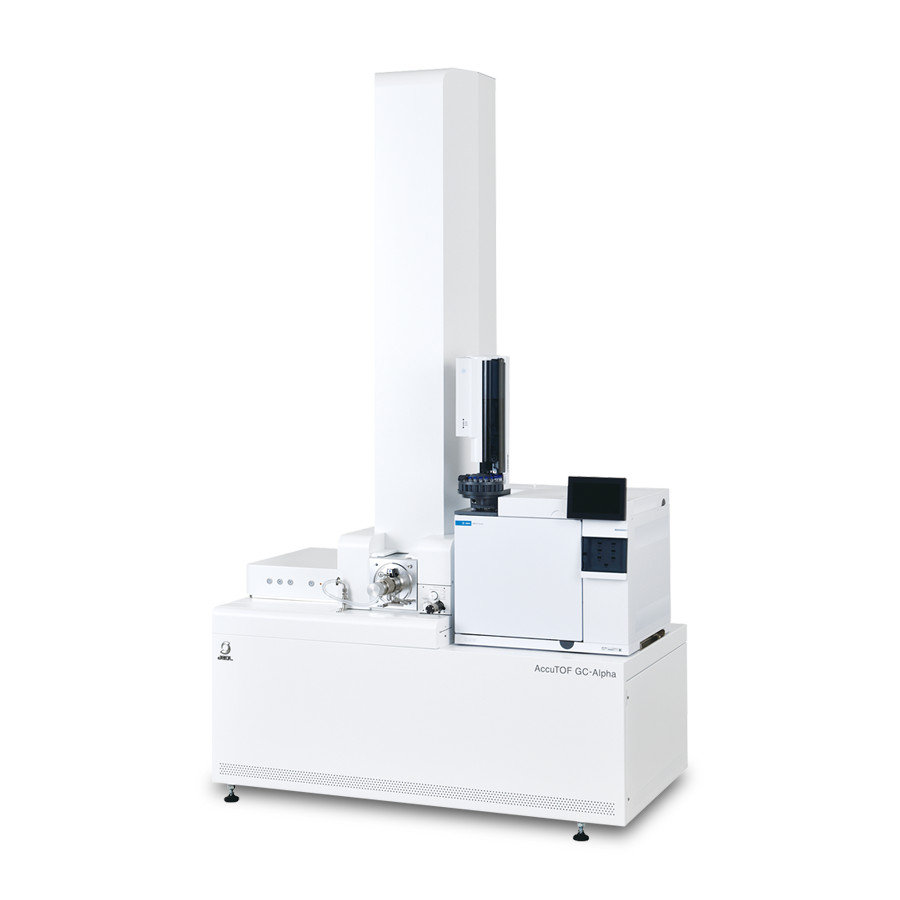
In this MSTips, we will introduce an application of SBR analysis using FD and Pyrolysis-GC-MS method of the JMS-T2000GC. In the FD method, the sample is applied to the emitter and directly introduced into the ion source, and then detected by soft ionization. It is possible to detect molecular ions peak in less than one minute. When measuring polymers such as SBR, a complex mass spectrum containing multiple peaks from oligomers is obtained. Even in this case, qualitative information can be easily obtained by KMD analysis. The main component styrene-butadiene copolymer can be visually evaluated the molecular weight distribution due to the difference of end group and degree of polymerization, and other ion peaks can be qualitatively analyzed by composition estimation. Although it is difficult to obtain the structural formula using the FD method alone, it is possible to obtain it efficiently using the Pyrolysis-GC-MS method in combination. Furthermore, these two methods can complement the range of measurable mass (= boiling point), making multifaceted analysis possible.
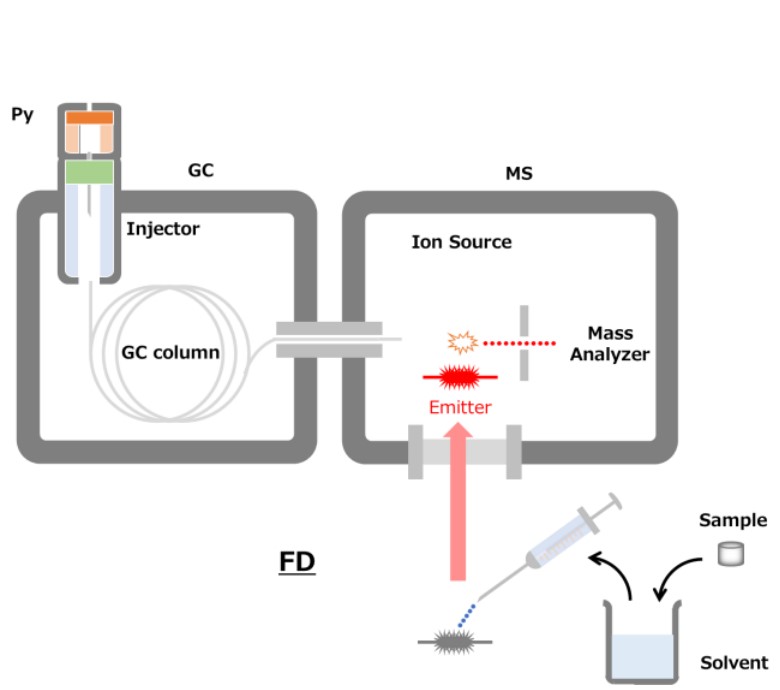

Figure 1 Schematic diagram of FD and Pyrolysis-GC-MS method
Experiment
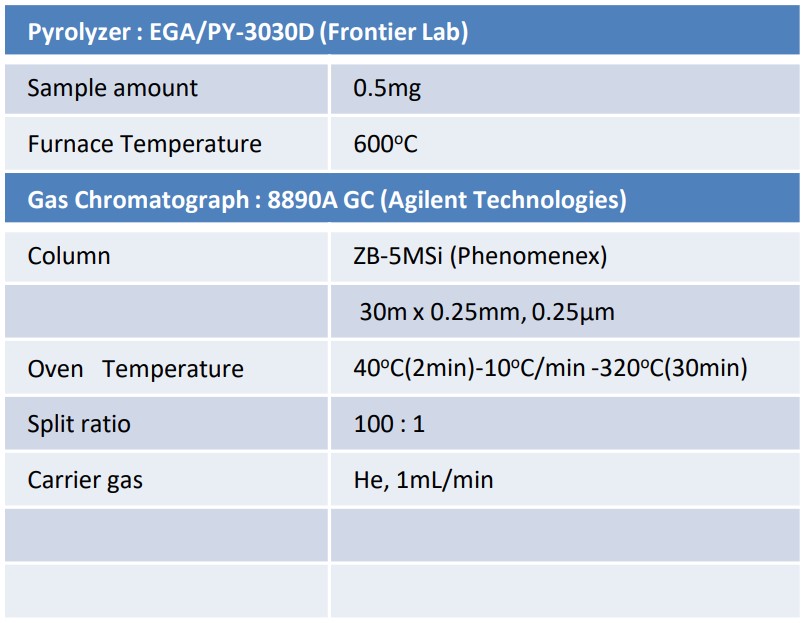
As the sample, commercially available SBR product (rubber sheet) was used. In FD method, 10 mg was immersed in 1 mL of tetrahydrofuran (THF), and then 1 µL of this was applied to the emitter and measured. In Pyrolysis-GC-MS method, 0.5 mg was weighed and measured. EI and FI (field ionization) methods were used for ionization in Pyrolysis-GC-MS method. The obtained data were analyzed using msRepeatFinder and msFineAnalysis AI. Table 1 shows details of the measurement conditions.
Table 1 Measurement conditions

Results ① - FD method
Figure 2 shows the TIC chromatogram and mass spectrum of FD method. A sample introduced into the MS ion source was ionized and detected in about 20 seconds. Because it was a soft ionization method without chromatographic separation, multiple molecular ions were detected in one mass spectrum. In the FD method, it was difficult to detect low mass (low boiling point) compounds due to volatilization in the ion source. But it was possible to detect high mass (= high boiling point) compounds which were difficult to detect by Pyrolysis-GC-MS method.
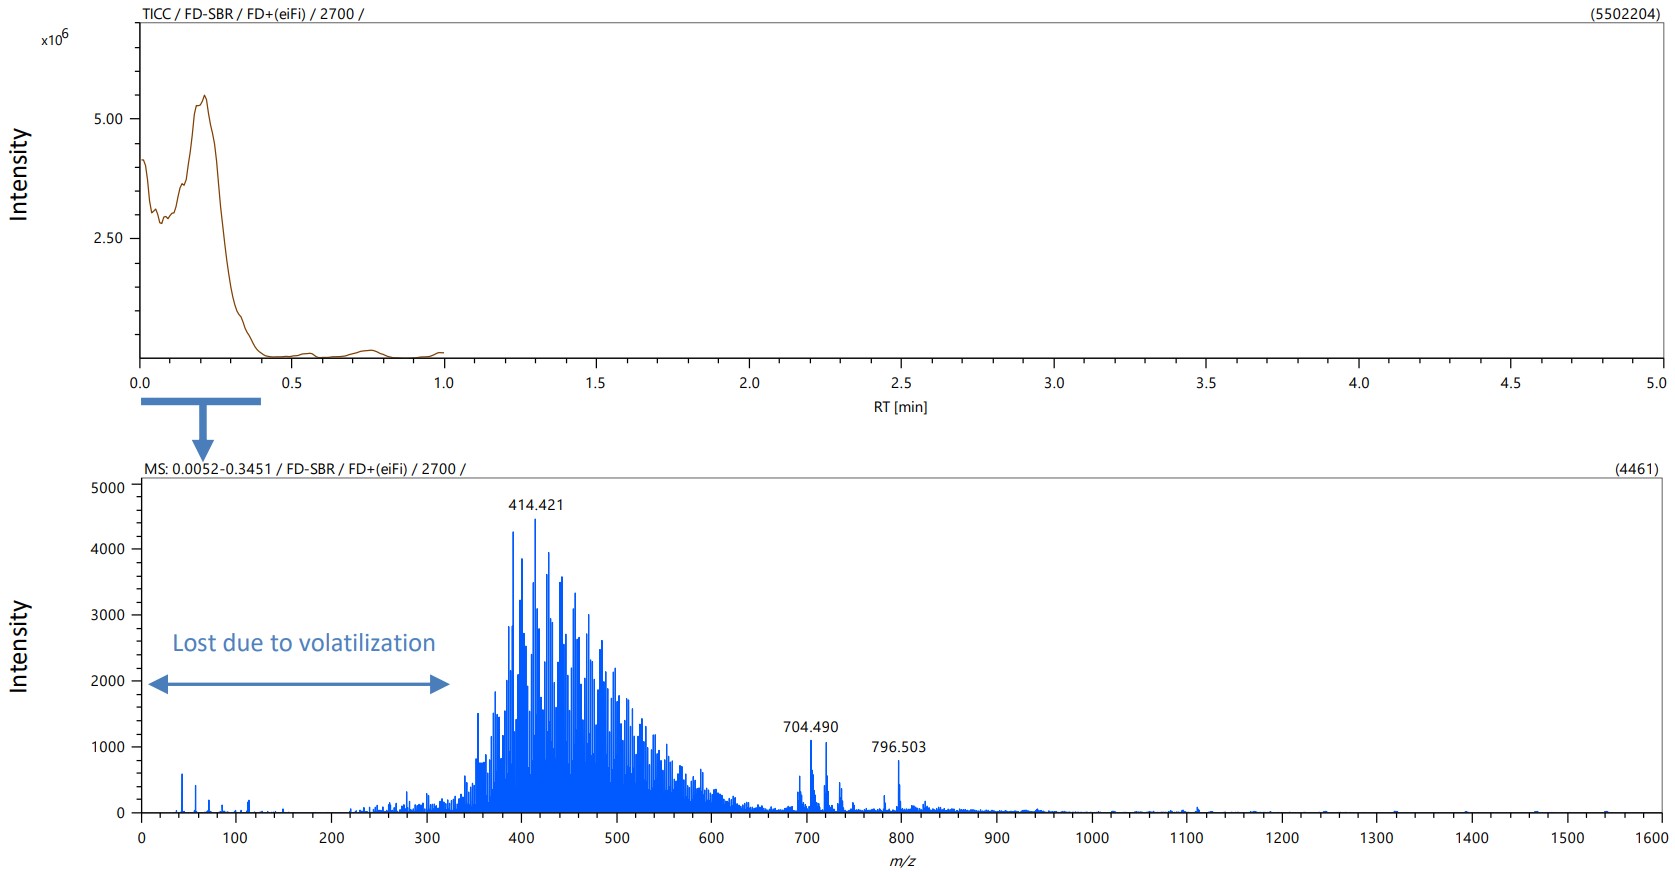
Figure 2 TIC chromatogram and mass spectrum
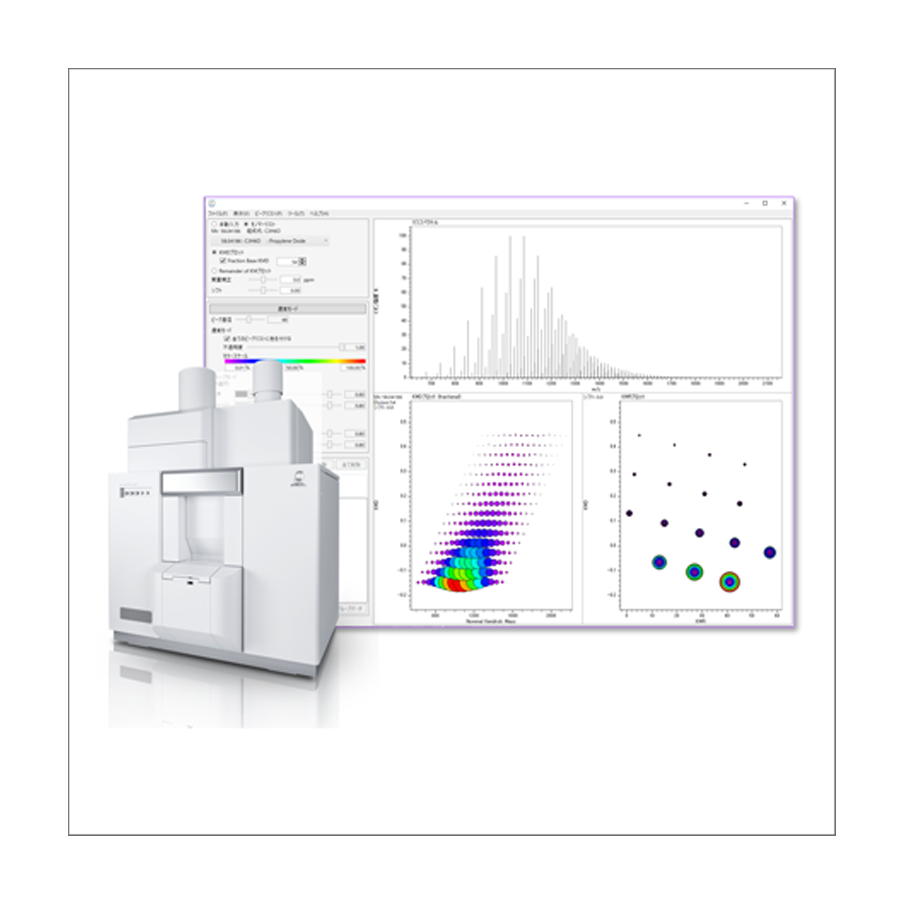
Figure 3 shows a KMD plot created from the above mass spectrum. In the KMD plot, ion peaks from compounds with a common repeating structure are arranged in a straight line. In the case of copolymers such as SBR, they form a lattice pattern. The groups surrounded by yellow and green dashed lines were all SBR, but the polymerization tendency of styrene and butadiene was different. This suggests that two types of SBR with different properties were blended. The red peaks were additives such as plasticizers and antioxidants extracted using the target list. The peak at m/z 704.49 was the oxide (+O) of Tris (nonylphenyl) phosphite, an antioxidant. It was a high-boiling point compound and could only be detected by the FD method.
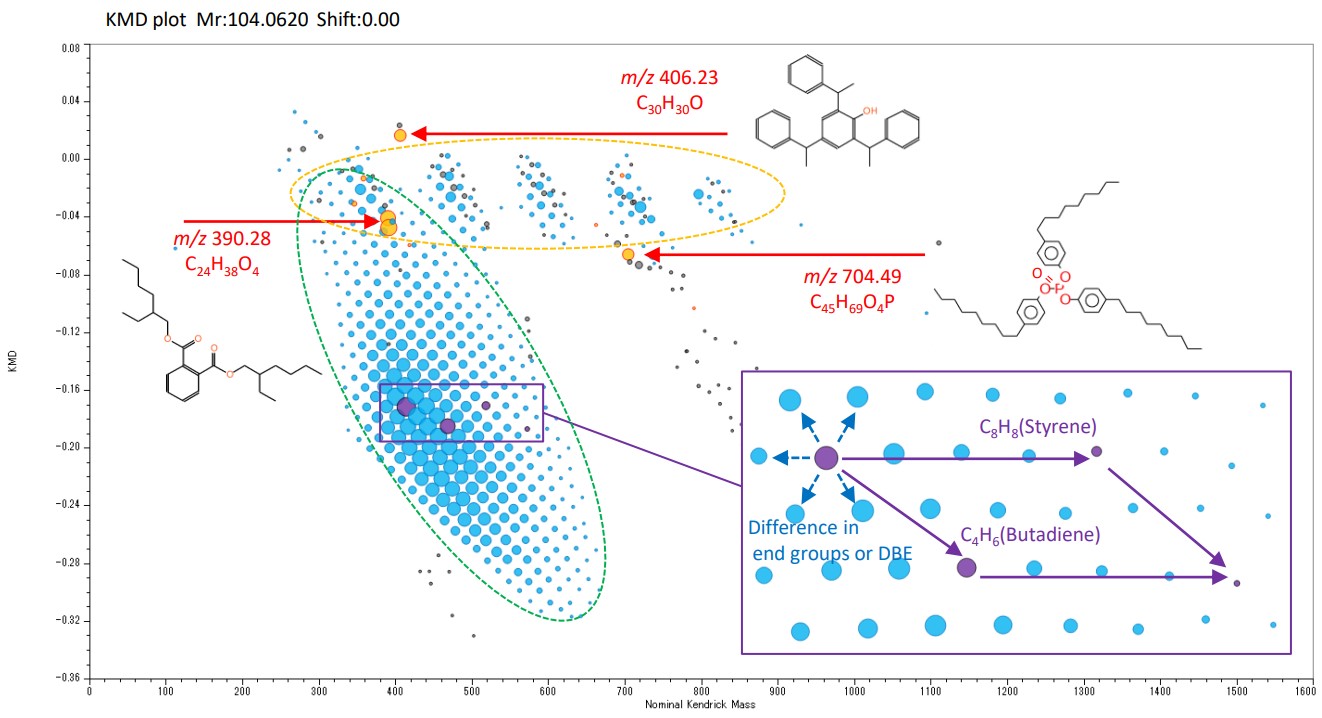
Figure 3 KMD plot
Results ② - Pyrolysis-GC-MS method
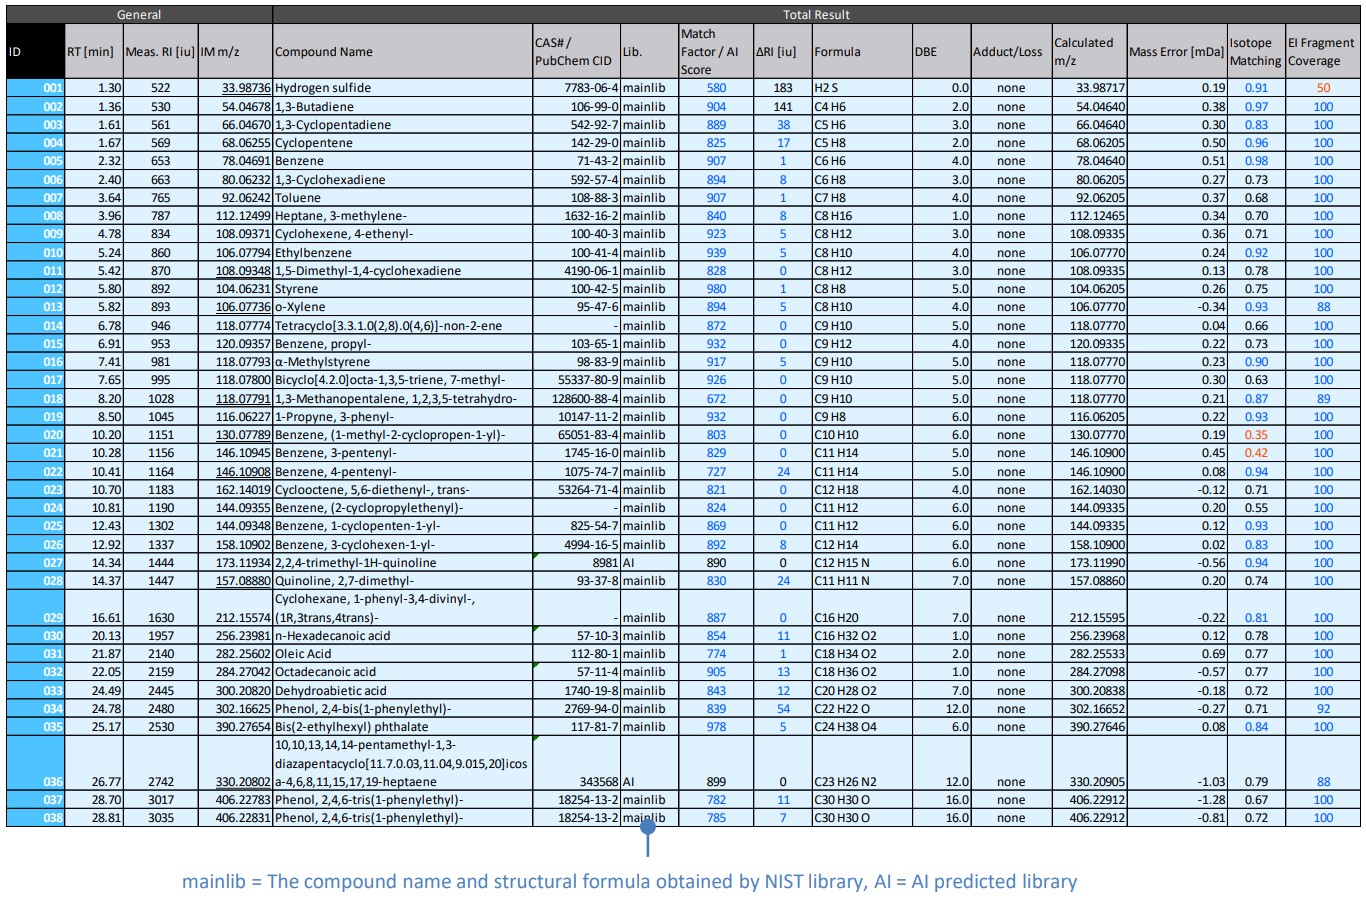
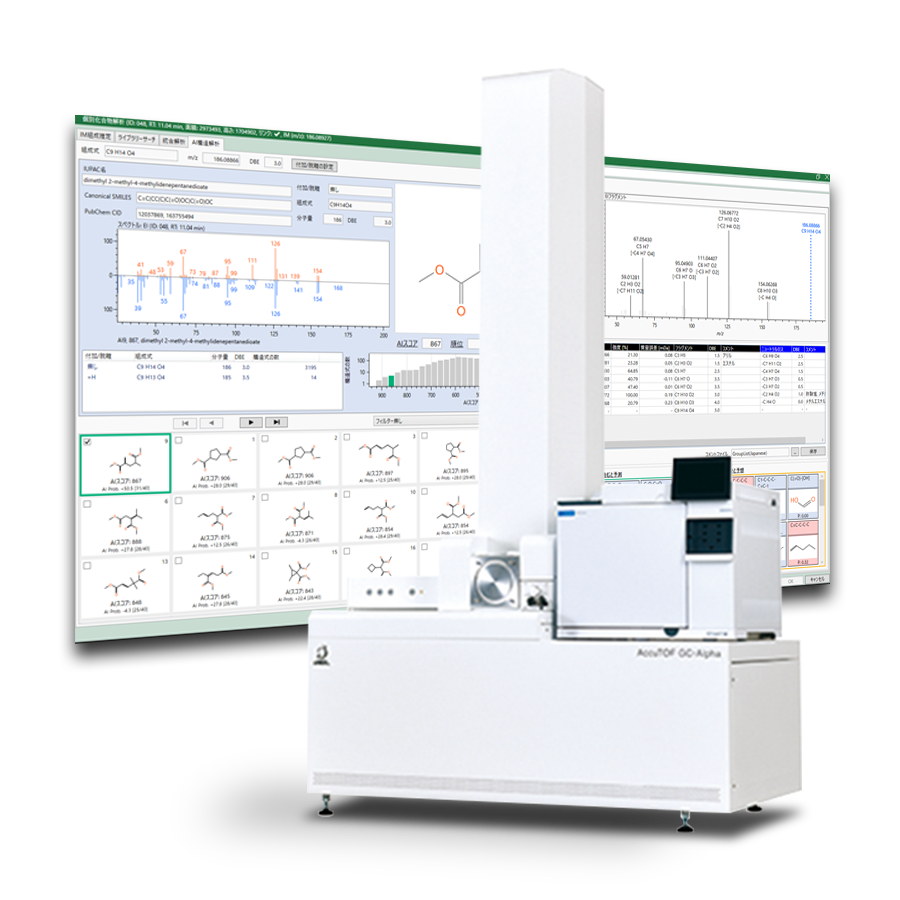
Figure 4 shows the results window of msFineAnalysis AI, and Table 2 shows the peak list. ID027 2,2,4-trimethyl-1H-quinoline was a low-boiling point compound and could only be detected by the pyrolysis-GC-MS method. In addition, it is not registered in the NIST library, so AI structural analysis was required to obtain the structural formula.

Figure 4 Result window of msFineAnalysis AI
Table 2 Peak list
Conclusion
SBR product was analyzed using FD and Pyrolysis-GC-MS method of JMS-T2000GC. FD method was able to obtain rough qualitative information about the blended polymers and additives in a short measurement. Pyrolysis-GC-MS method was able to obtain detailed qualitative information such as structural formulas. By using these two methods in combination, it was possible to obtain qualitative information efficiently.
Solutions by field
Related products
Are you a medical professional or personnel engaged in medical care?
No
Please be reminded that these pages are not intended to provide the general public with information about the products.