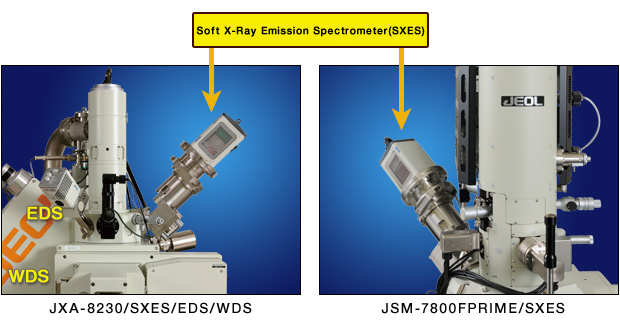
Soft X-ray Emission
Spectrometer(SXES)
The Soft X-Ray Emission Spectrometer (SXES) is an ultra-high resolution spectrometer consisting of a newly-developed diffraction grating and a high-sensitivity X-ray CCD camera.
In the same way as EDS, parallel detection is possible, and 0.3 eV (Fermi-edge, Al-L standard) ultra-high energy resolution analysis can be performed, surpassing the energy resolution of WDS.
Features
Youtube
Click the "replay" button in the box above, and the movie will start(for 4 minutes)
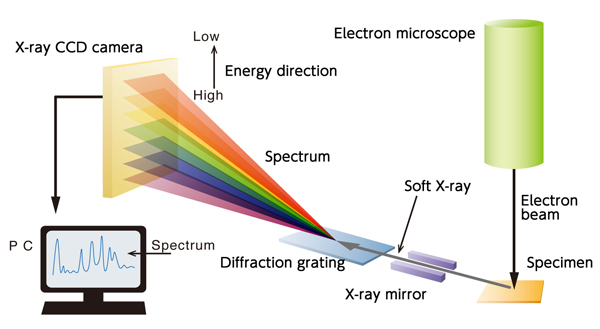
System outline
The newly-developed spectrometer optical system design enables simultaneous measurement of spectra with different energies, without moving the diffraction grating or detector (CCD). With the high energy resolution, chemical state analysis mapping can be performed.
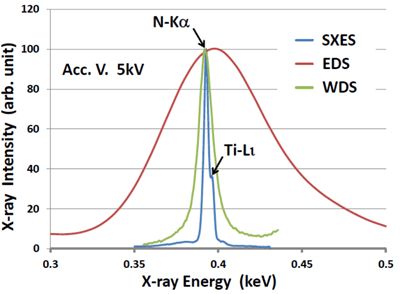
Comparison of SXES, WDS and EDS
Spectra for titanium nitride with various spectrometry methods
For titanium nitride, the peaks of N-Kα and Ti-Ll are overlapped. Even with WDS, and waveform deconvolution using a mathematical method is required. As illustrated in the figure below, there is a high energy resolution with SXES, allowing for TiLl to be observed.
Comparison table
| Feature | SXES | EPMA(WDS) | EDS |
|---|---|---|---|
| Resolution | 0.3 eV
(Fermi edge Al-L) |
8 eV (FWHM@Fe-K) | 120-130 eV
(FWHM@Mn-K) |
| Chemical bond state analysis | Yes | Yes (mainly light elements) | No |
| Parallel detection | Yes | No
(But multiple spectrometers possible) |
Yes |
| Spectral elements & detector | Diffraction grating+CCD | Analyzing crystal + Proportional counter | SDD |
| Detector cooling | Peltier cooling | Not needed | Peltier cooling |
| Detection limit
(reference value with B) |
20ppm | 100ppm | 5000ppm |
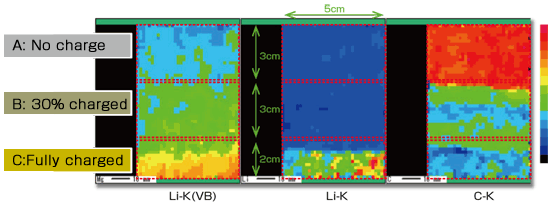
Li-ion battery (LIB) Analysis Example
The example below shows large area maps of LIB samples with different charge states. SXES can map the Li-K peak at both the valence band state (left) and the ground state (middle). A carbon distribution map (right) can also see the function on the LIB that is fully discharged.
Fully-charged, Li-K specimen spectrum
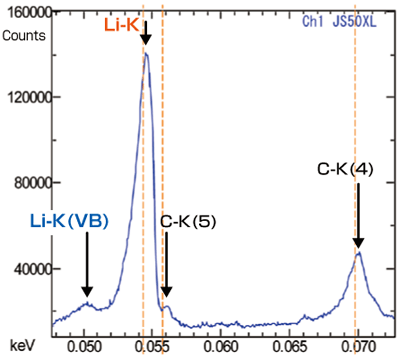
Note: In Li-oxide it is difficult to detect Li-K emission
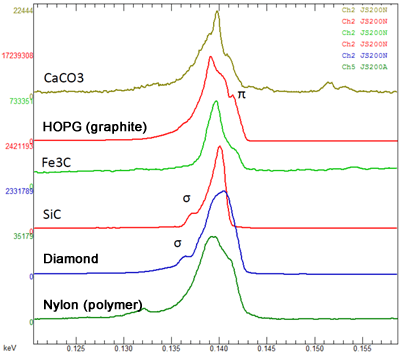
Light element measurement example
Measurements of carbon compounds using SXES
It is possible to measure the differences between diamond, graphite and polymers. The differences can be observed with the additional peaks from π and σ bonding. As mapping takes a spectra from each pixel, additional maps can be generated for peak shifts of 1 eV and shoulder peaks.
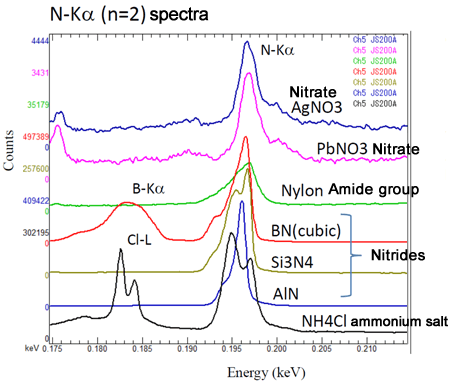
Measurements of various nitrogen compounds
For nitrogen as well, the chemical bonding state can be analyzed from the spectrum peak shape. The peak shapes for nitrates and nitride are completely different, and it is even possible to observe the unique peak shape for ammonium salt, which is very beam sensitive.
Specifications
Energy resolution 0.3eV(Al-L spectrum measured @73eV)
Acquisition energy range: Diffraction grating JS50XL energy region 50-170eV
Acquisition energy range: Diffraction grating JS200N energy region 70-210eV
Spectrometer chamber mounting points:
EPMA WDSport: No.2 port (right side from front)
FE-SEM WDS port (left rear from front)
Spectrometer dimensions: W 168mm×D 348mm ×H 683mm
Distance including CCD from the interface
Spectrometer mass 25kg
Applicable models
EPMA : JXA-iHP200F、JXA-iSP100、JXA-8530FPlus、JXA-8530F、JXA-8230
SEM : FE-SEM
Catalogue Download
Soft X-ray Emission Spectrometer(SXES)
Application
Application SXES_SA
Handbook of Soft X-ray Emission Spectrometer
Please check here for details.
Related Products
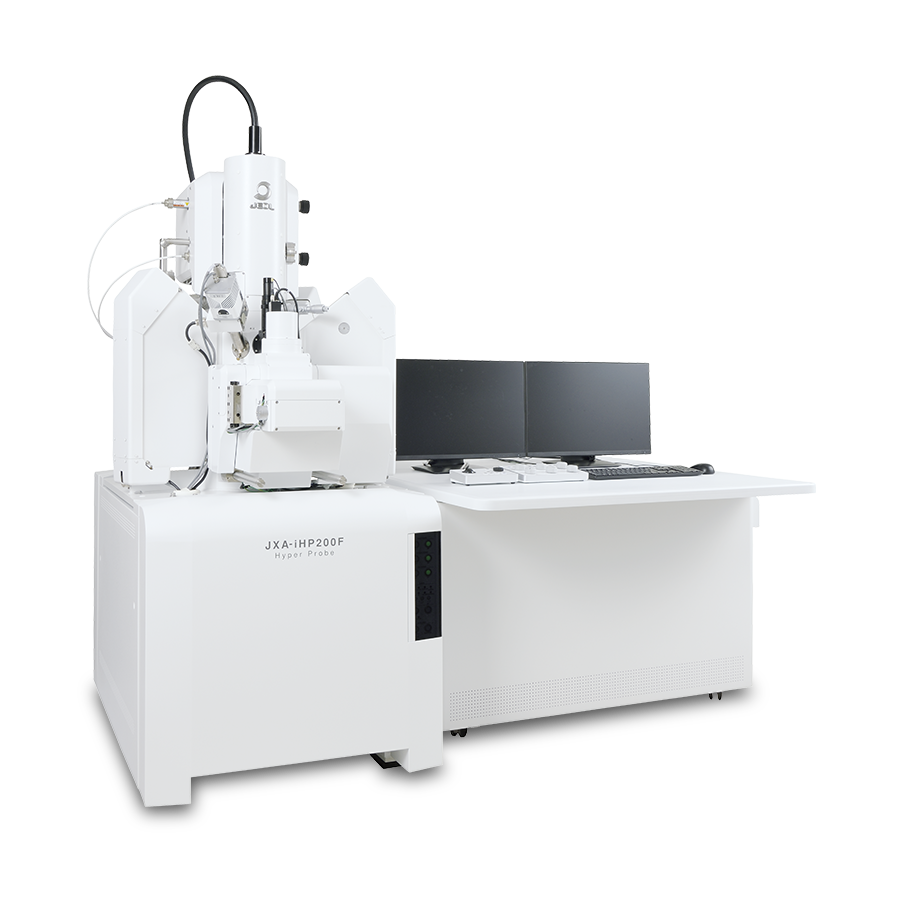
JXA-iHP200F Field Emission Electron Probe Microanalyzer (FE-EPMA)
Electron Probe Microanalyzer (EPMA) has been utilized as a tool for research development and quality assurance in a variety of industrial fields such as steel, automobile, electric component, battery material and its application are expanding more and more. In addition, in academic fields, EMPA has been widely used in earth planetary science and material science, and the future contribution can be expected to applications including various advanced researches covering material energy research such as minerals and various new materials. In response, “simpler” and “faster” use of instrument, accessible to anyone is in demand while maintaining the high performance of microanalysis.JXA-iHP200F and JXA-iSP100 are integrated EPMAs with enhanced features, satisfying these needs and achieving more efficient operations from observation to analysis.
※ EPMA is abbreviation for Electron Probe Microanalyzer.
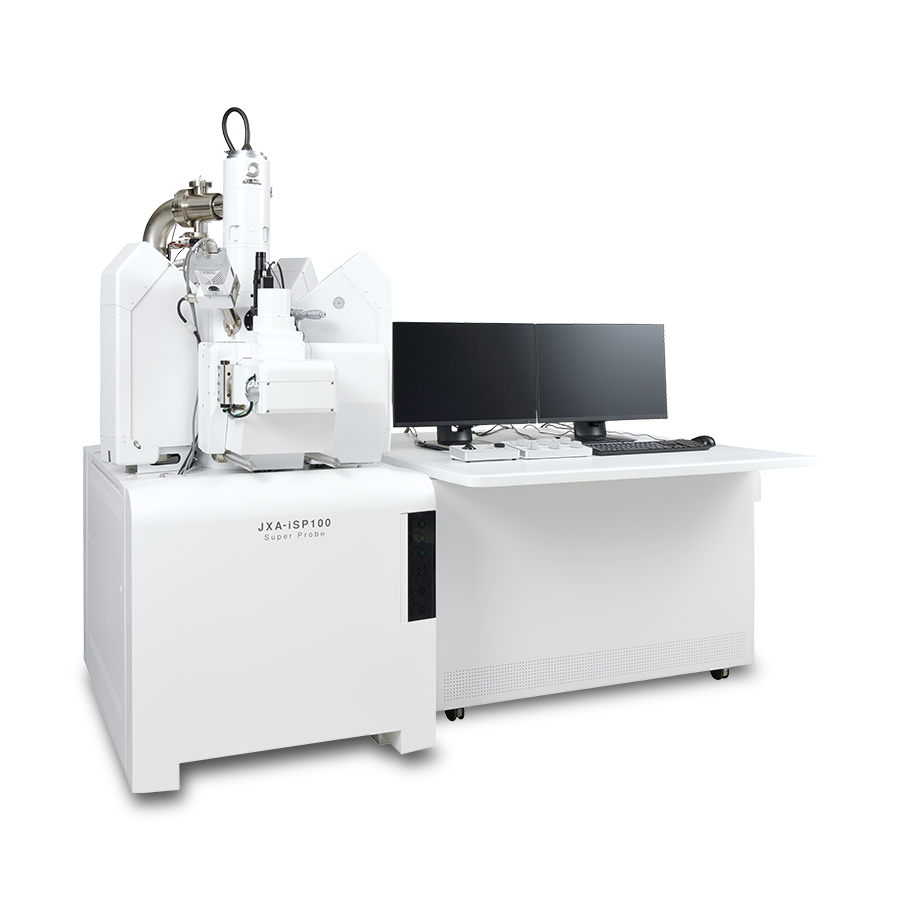
JXA-iSP100 Electron Probe Microanalyzer (EPMA)
Electron Probe Microanalyzer (EPMA) has been utilized as a tool for research development and quality assurance in a variety of industrial fields such as steel, automobile, electric component, battery material and its application are expanding more and more. In addition, in academic fields, EMPA has been widely used in earth planetary science and material science, and the future contribution can be expected to applications including various advanced researches covering material energy research such as minerals and various new materials. In response, “simpler” and “faster” use of instrument, accessible to anyone is in demand while maintaining the high performance of microanalysis.JXA-iHP200F and JXA-iSP100 are integrated EPMAs with enhanced features, satisfying these needs and achieving more efficient operations from observation to analysis.
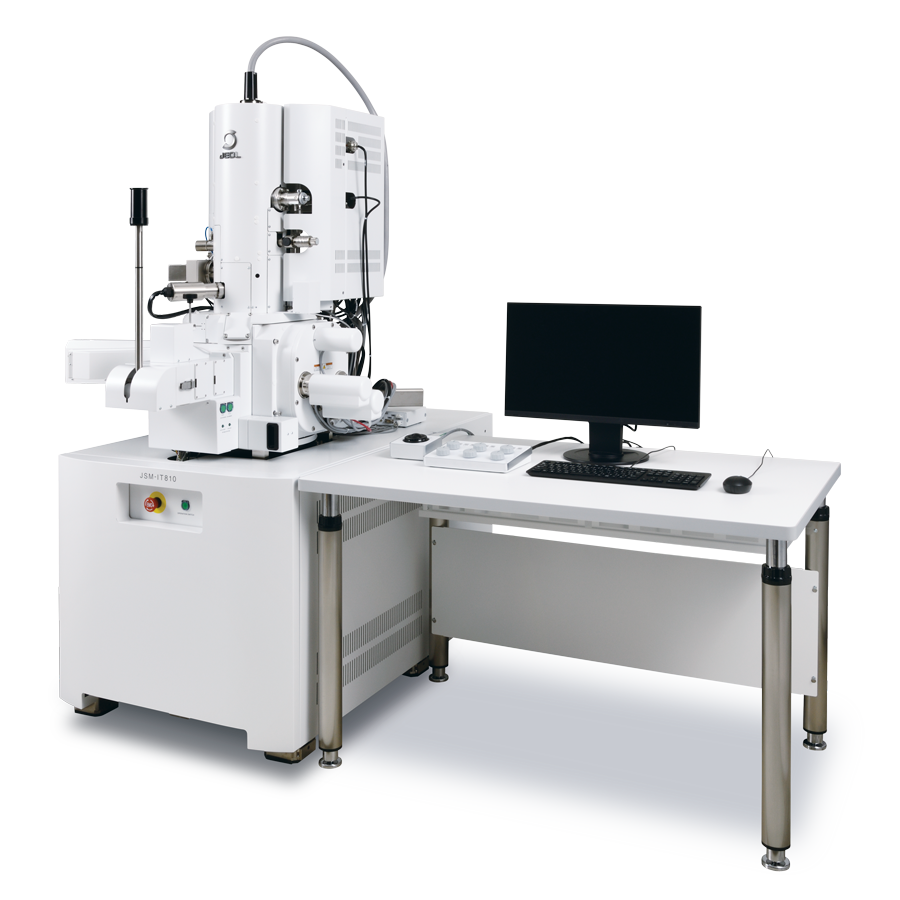
JSM-IT810 Schottky Field Emission Scanning Electron Microscope
Versatility and high spatial resolution meet automation with the JSM-IT810 series FE-SEM.No-coding automation for imaging and EDS analysis is built-in for a streamlined and efficient workflow.New functions are available to ensure high quality data and an enhanced user experience for all SEM users.Functions include the SEM automatic adjustment package, a trapezoidal correction function (useful for EBSD measurements) and Live 3D surface reconstruction for observation of surface topography.Operating a FE SEM has never been easier with the JSM-IT810 series.
More Info
Are you a medical professional or personnel engaged in medical care?
No
Please be reminded that these pages are not intended to provide the general public with information about the products.