momentum transfer resolved electron energy-loss spectroscopy, q-EELS
momentum transfer resolved electron energy-loss spectroscopy
When highly accelerated electrons are incident on a solid substance, certain electrons are scattered and lose a part of their energies by the Coulomb interactions with the electrons and the atomic nuclei in the substance. These electrons, called inelastically scattered electrons, give a momentum q to the electrons or the atomic nuclei in the substance and are scattered in the direction -q against the incident electron beam. The spectroscopic method to obtain the energy loss spectra of those inelastically scattered electrons as a function of momentum transfer q as well as energy loss values is named "momentum transfer resolved electron energy-loss spectroscopy" (momentum transfer resolved EELS) or q-EELS. The method is also called "angle resolved EELS" (AR-EELS).
The q-EELS measurement of the interband transitions (0 to 10 eV) reveals the q dependence of the dielectric function ε(q,ω) through the loss function. The crystal orientation dependence (q dependence) of plasmon oscillations can be obtained in the measurement of plasmon loss (10 to 50 eV). The q-resolved measurement of the core-loss spectrum(50 eV or higher)determines the imaginary part ε2 (q,ω) of the dielectric function, revealing the spatial orientation of the electron orbitals of the unoccupied states [1, 2].
Measurement of q-EELS
Fig. 1 shows an example of q-EELS measurement using an omega (Ω) energy filter. A transmission electron microscope (TEM) is set to the diffraction mode. That is, with the action of the objective lens, the enlarged image of the diffraction pattern of the specimen is formed on the plane where a slit (q-slit) is inserted. This plane is the object plane of the omega filter. The inserted slit limits "q" in the vertical direction against the slit. (In Fig. 1, three diffraction spots of O, G and -G are accepted.) Here, the longer direction of the slit is set in the direction where no energy dispersion of an analyzer (omega filter) takes place. When these diffraction spots pass through the omega filter, the energy dispersion of the inelastically scattered electrons occurs in the direction vertical to the slit. Then, the EELS spectrum is obtained as a function of q in the longer direction of the slit. That is, the inelastically scattered electrons which pass through the analyzer are two-dimensionally displayed as an E-q map, in which the momentum transfer q is taken as the horizontal axis and the energy loss E is taken as the vertical axis.
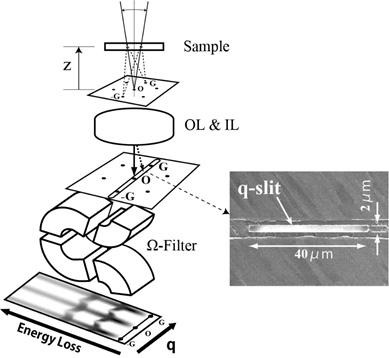
Fig. 1. Schematic of q-EELS measurement using an omega energy filter as an analyzer.
An electron diffraction pattern is formed on the object plane of the omega filter. A slit is inserted onto the diffraction plane to limit q in the direction vertical to the slit. (In Fig. 1, a transmission wave O, and the reflections G and -G are accepted.) The inelastically scattered electrons which pass through the analyzer (omega filter) are two-dimensionally displayed as an E-q map, in which the energy loss E appears in the direction vertical to the slit and the momentum transfer q appears in the direction parallel to the slit.
q dependence of the volume plasmon of aluminum (Al)
Fig. 2 shows an E-q map obtained from EELS measurement of aluminum (Al). The intensity of zero-loss energy at q=0 Å-1 corresponds to the original transmission spot. The intensity of an energy loss 15 eV at q=0 Å-1 is caused by the volume plasmon of Al. The spectrum due to the volume plasmon is seen to extend with a parabolic shape with increasing q from the position of an energy loss 15 eV at q=0 Å-1. This shows that the volume plasmon energy increases in proportion to q2 with increasing q. Thus, the result indicates that the conduction electrons in Al behave like free electron gases (refer to Appendix 1). At the positions of the 002 and reflections at q= ±3.1 Å-1, the same energy dispersions are seen as that observed at q=0 Å-1.
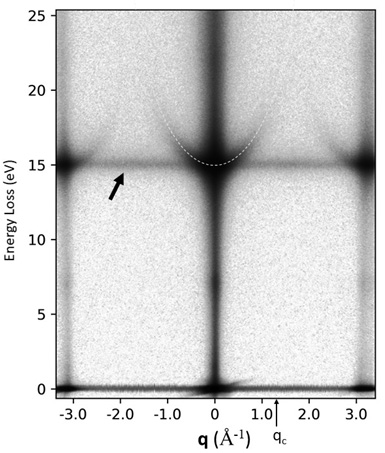
Fig. 2. E-q map of Al.
The plasmon energy intensities increasing in proportion to q2 (indicated by white dashed line) are observed around an energy loss of 15 eV at q = 0 Å-1 and at q = ±3.1 Å-1. The plasmon intensity vanishes for q > qc = 1.3 Å-1, where qc is the critical momentum transfer of the volume plasmon of aluminum. The intensity at 15 eV independent of q (indicated by black arrow) is due to multiple scatterings of the volume plasmon and lattice vibrations with different q. Details are given in [Appendix 1].
q-EELS measurements are used to analyze the dependence of plasmon energy on the direction of oscillation in anisotropic metallic materials (refer to Appendix 2) [3]. q-EELS measurements have also been applied to the q dependence of the surface (interface) plasmon energy of the interface between a metal and a dielectric material, and to that of a plasmonic material with a periodic interface structure [4, 5].
In measurement of the q dependence of the core-loss spectrum, q-EELS measurements have been applied to identification of the directions of the electron orbitals of the unoccupied states [1, 2].
In recent years, the energy resolution of EELS has been improved up to a few tens of meV, making it possible to measure EELS spectra in the infrared region. In this energy region, it is possible to measure the energy of the lattice vibrations (phonon), and the q-dispersion spectra of the phonons in the local regions of graphite and graphene have been reported [6].
(By Associate Professor Yohei Sato, Tohoku University)
References
[1] K. Saitoh, K. Momonoi, N. Tanaka, and S. Onari, J. Electron Microsc. 55, 281-288 (2006).
[2] K. Saitoh, K. Momonoi, N. Tanaka, and S. Onari, J. Appl. Phys., 112, 113920 (2012).
[3] Y. K. Sato et al., J. Appl. Phys., 126, 185107 (2020)
[4] H. Saito and H. Kurata, J. Appl. Phys., 117, 133107 (2015)
[5] H. Saito et al., Phys. Rev. B, 100, 245402 (2019).
[6] R. Senga, K. Suenaga, P. Barone, S. Morishita, F. Mauri, and T. Pichler, Nature, 573, 247-250 (2019).
Appendix 1
q dependence of volume plasmon energy
The q dependence of the volume plasmon energy is given by the following equations, if the electrons in a metal behave like free-electron gases.
Here, ħ=h ⁄ 2π is Planck constant. The parameters of m, e, N respectively express the mass of an electron, the elementary charge of an electron, and the charge density. α is called the dispersion coefficient of the plasmon. EF is the Fermi energy of a metal and EP(0) is the plasmon energy at q = 0.
When the entire free electrons are displaced collectively (without density change) against a uniform positive charge formed by the atomic nuclei in the metal, the displaced electrons induce charges on the metal surfaces to produce the Coulomb force. The Coulomb force acts as the restoring force to the electrons and causes the oscillation of the free electrons. This is the volume plasmon at q = 0.
The plasmon with momentum q ≠ 0 is a charge compressional wave having a wavelength ∝1/|q| in the direction of q. As is seen from equation (1), the plasmon energy increases in proportion to q2. As the q value becomes large, the wavelength of the charge compressional wave becomes small, and then, the charge density increases locally. This is the reason why the plasmon energy increases with increasing q. As q increases and exceeds the critical value (qc), the plasmon rapidly decays and disappears. That is, for q > qc, instead of electrons being excited collectively, electrons are individually excited to the unoccupied states in the conduction band (intra-band transitions), and the charge compressional wave as a collective excitation disappears. The qc of aluminum is estimated to be 1.3 Å-1, and vanishing of the plasmon intensity at the qc is seen in Fig. 2.
Appendix 2
Observation of the anisotropy of volume plasmon energy
The coefficient α of q2 dispersion of the plasmon energy of a metal depends on the charge density N and the effective mass m, which determine the band structure. In a metallic material having an anisotropic crystal structure, the effective mass m differs in the different crystal orientations. Thus, the dispersion relation of the plasmon also differs in the different crystal orientations.
Fig. 3(a) shows the crystal structure of the hexagonal crystal of Cs0.33WO3 (CWO) having low-density carrier electrons (5.4 Χ 1021 e/cm3). The carrier electrons are supplied by the monovalent Cs atoms.
Fig. 3(b) and (c) show its q-EELS spectra over an energy region between 0 and 3 eV. Fig. 3(b) is the spectra measured in a direction q// (a direction of the ab plane), and Fig. 3 (c) is those in a direction q//0001 (c axis direction). The peak A (1.2 eV) in the spectrum at q = 0 Å-1 is a volume plasmon oscillating in the[]direction due to the CWO carrier electrons, and the peak B (1.8 eV) is a volume plasmon oscillating in the [0001] direction. The plasmon energy is larger when the oscillation direction is in the [0001] direction than when the oscillation direction is in the[]direction. Since the effective mass of the carrier electrons in the CWO crystal is known to be small in the [0001] direction and large in the[]direction, it is understood from equation (2) that the plasmon energy in the [0001] direction is larger than that in the[]direction.
The spectrum of q// (Fig. 3 (b)) is a volume plasmon oscillating in the [] direction and shows mainly the peak A (1.2 eV).
In the spectrum of q// (Fig. 3 (b)), the peak A (1.2 eV) of the volume plasmon oscillating in the [] direction is mainly observed. However, the peak B (1.8 eV), which corresponds to the volume plasmon oscillating in the [0001] direction, is also observed near q = 0 Å-1. In the spectrum of q//0001 (Fig. 3 (c)), the peak B (1.8 eV) of the volume plasmon oscillating in the [0001] direction is mainly observed. Similarly, the volume plasmon peak A (1.2 eV) oscillating in the [] direction is also observed near q = 0 Å-1. As a result, the difference in the energy of plasmons oscillating in different q directions can be measured.
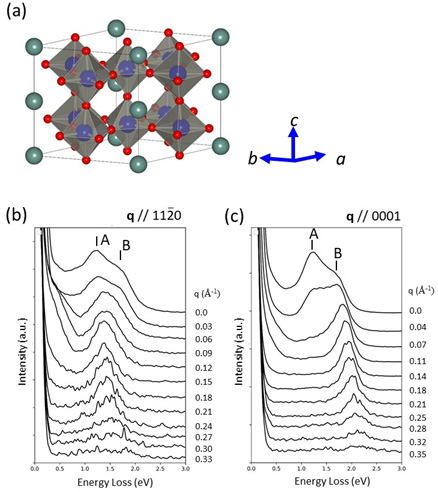
Fig. 3 (a) Crystal structure of hexagonal Cs0.33WO3.
The carrier electrons are supplied from the monovalent Cs atoms. Cs0.33WO3 is a metal having carrier electrons with a density of n = 5.4 Χ 1021 e/cm3. (b) The q dependence of the volume plasmon measured along q// (a direction in the ab plane). (c) The q dependence of the volume plasmon measured along the direction of q//0001 (c axis direction). For the anisotropic metallic materials, the energy of the volume plasmon is different for the different direction of the momentum transfer q. Thus, the anisotropy of the volume plasmon can be measured.
Related Term(s)
Term(s) with "momentum transfer resolved electron energy-loss spectroscopy" in the description
Are you a medical professional or personnel engaged in medical care?
No
Please be reminded that these pages are not intended to provide the general public with information about the products.