micro electron diffraction method, Micro ED
micro electron diffraction method
The micro electron diffraction method is a method to determine crystal structures using electron diffraction patterns with the help of the kinematical diffraction theory (Fourier transform), where the diffraction patterns are acquired while continuously tilting small crystalline specimens against the incident electron beam to reduce the dynamical diffraction effect.
A specimen size to be used is a few µm in diameter, and is tilted up to 30 to 60° at a step of 0.1 to 1 deg/sec. Several series of diffraction patterns are taken as movie or frame images. Then, the crystal structures are determined by applying a method broadly used in X-ray crystal structure analysis (the direct method) to the present diffraction data obtained.
In ordinary electron diffraction, the simultaneous reflection effect (one of dynamical diffraction effects) arises, that is a certain reflection is enhanced via the other reflections simultaneously excited. Thus, X-ray crystallography method based on the kinematical theory (Fourier transform), which does not take account of the dynamical diffraction effect, cannot be applied to electron diffraction. However, when diffraction patterns are acquired while tilting a specimen and summing up the intensities of each diffraction pattern, the diffraction intensity is averaged and the simultaneous reflection effect decreases, and then the obtained diffraction intensities approach to those expected from the kinematical theory. Fig. 1 shows an example of a series of diffraction patterns. Since the angler range and the directions of tilting for one specimen are limited, several series of tilt operations are performed for the specimens with different crystal orientations.Then, the acquired diffraction patterns are combined to form a dataset covering a wide angler range and different orientations. For this data set, the direct method in X-ray crystallography is applied to determine the crystal structure. *1
The features of Micro ED are as follows.
The scattering cross section of a crystal for electrons is 104 times larger than that for X-rays. Thus, sufficiently-high electron diffraction intensities are obtained even from a micro-crystal of 1 µm or less in size. Therefore, Micro ED is effective for structural analysis of organic- and inorganic-compounds from which only micro-crystals are prepared. In the case of X-ray structure analysis, a large-crystal of several 10 µm in size is needed. (It is possible to use a crystal with a size down to several µm when a synchrotron radiation light source is used.) For electron diffraction, it should be noted that a radiation damage of a specimen due to electron-beam irradiation can arise. To avoid this problem, it is required to cool the specimen with liquid nitrogen and to decrease the electron dose.
*1. Note
An electron, a charged particle, is scattered by the electrostatic potential formed by both the nucleus and electrons of the atoms in a crystal. An X-ray, an electromagnetic wave, is scattered by the electrons of the atoms in a crystal (Thomson scattering). It is noted that an atomic nucleus does not contribute to the X-ray scattering because the nucleus is too heavy to be vibrated by X-rays.
Thus, structural analysis using electron diffraction determines the electrostatic potential distribution in a crystal, whereas structural analysis by X-ray diffraction determines the electron density distribution in a crystal. It is known to exist a conversion formula between the electrostatic potential distribution and the electron density distribution in a crystal. Thus, if one is found, the other is found by the conversion.
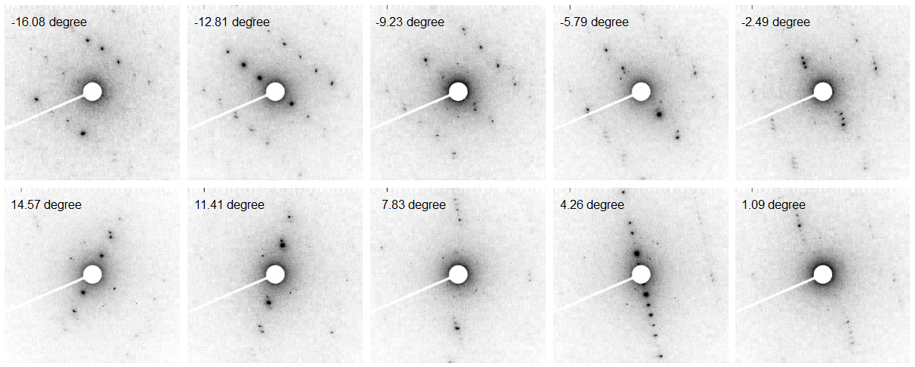
Fig. 1 Tilt-series of electron diffraction patterns obtained from an L-histidine micro-crystal.
Angular tilt range: –16° to +15°. Tilt speed: 0.1°/s. Electron dose: 0.06 e-/Å2/s. Accelerating voltage: 200 kV.
The angles indicated in each frame are the tilt angles at the start of acquiring each diffraction pattern.
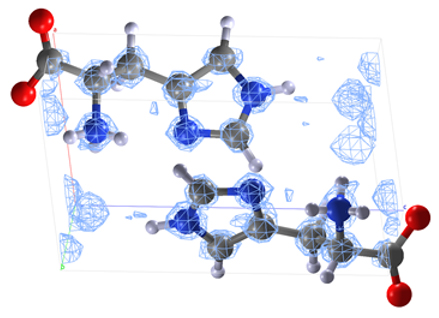
Fig. 2 For L-histidine with a known molecular structure, the Micro ED method was applied.
The grid (mesh) pattern shows the equi electrostatic potential planes (potential map) obtained by the method. A molecular model obtained by neutron diffraction is overlaid on the grid pattern. The reconstruction pattern obtained by the Micro ED method is in good agreement with the already reported structural model. (In the model, the respective elements are indicated by the different colors. C: gray, N: blue, O: red, H: white)
(Reconstruction model: Courtesy of Dr. Yusuke Nishiyama (JEOL RESONANCE Inc.))
Related Term(s)
Term(s) with "micro electron diffraction method" in the description
Are you a medical professional or personnel engaged in medical care?
No
Please be reminded that these pages are not intended to provide the general public with information about the products.