Laue function (interference function)
Laue function (interference function)
The Laue function (interference function) expresses how the amplitude of a reflected (diffracted) wave increases with increasing the number of lattice planes (crystalline planes), as a function of the excitation error of the reflection (called “rocking curve”). The magnitude of the principal maximum of the reflection (central peak) is proportional to the square of the number of lattice planes. The subsidiary maxima rapidly decrease with increasing the number of lattice planes. Normally, as the number of lattice planes contributing to the reflection is sufficiently large, the subsidiary maxima become extremely small and are not actually observed. Furthermore in electron diffraction, owing to the dynamical diffraction effect due to multiple scattering, the real rocking curve is different from the Laue function. The principal maximum stays finite and subsidiary maxima are observed with great intensities. The rocking curve really observed is interpreted by the dynamical diffraction theory.
Derivation of the Laue function G
In order to examine how the amplitude of a Bragg reflection g is decreased against the deviation from the Bragg reflection (rocking curve), the deviation parameter s from the Bragg angle (excitation error) is introduced and k − k0 = g + s. The phases from the lattice planes are added over the whole crystal.
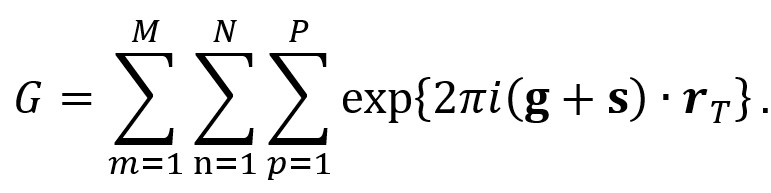
Here, m,n,p express the lattice indices in the three directions of x,y,z,and the sums are taken up to M,N,P. rT is the distance of the T-th lattice point. Since at a Bragg condition, the reflections from all the lattice points are in phase, g・rT=an integer. Then, the above equation is written as follows.
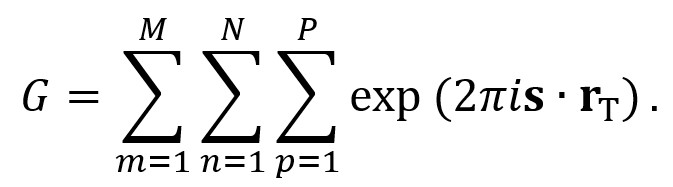
This equation does not include g and thus, G is common to all of the reflections. The three summations (i =1.2.3) can be performed separately. By removing the phase factors, finally the next equation is obtained.
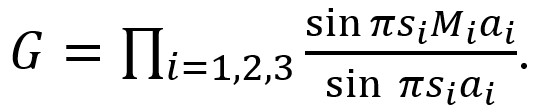
Here, ai is the lattice parameter of the unit cell, and Mi is the maximum number of the lattice. The square of G gives the intensity from the crystal lattices, and the principal maximum (si = 0) is Mi2. That is, the principal maximum is proportional to the square of the size (thickness) of the crystal. Fig. 1 shows two examples of the Laue function.
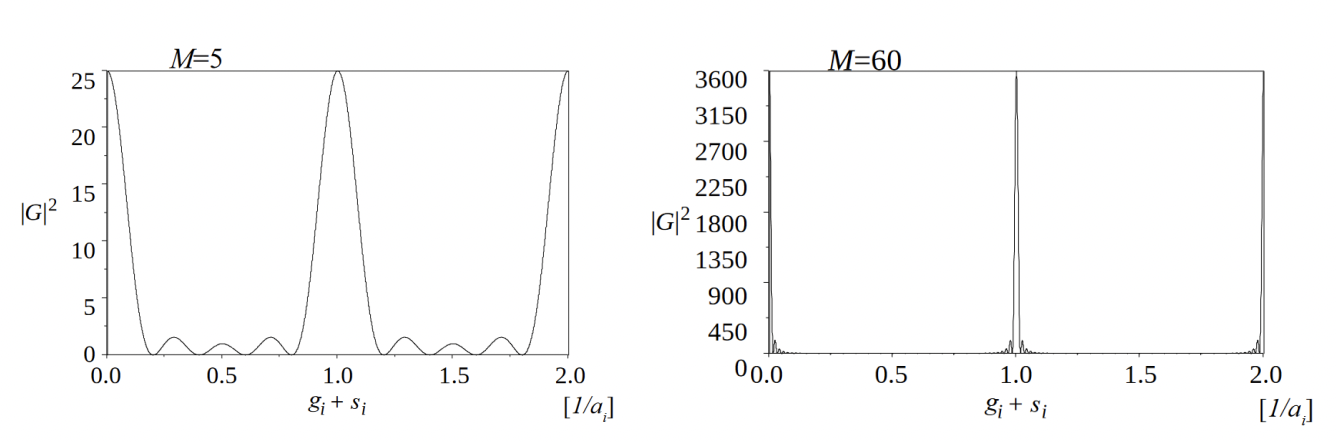
Fig. 1. Example of the Laue functions for M = 5 and M = 60. The principal maximum is seen to be proportional to the square of M. With the increase of M, the principal maximum becomes sharper and the subsidiary maxima become smaller as is seen in the case of M = 60. (reprinted from M. Tanaka, M. Terauchi, K. Tsuda,“Introduction to Electron Diffraction and Elementary Crystallography (in Japanese)”, Kyoritsu Printing Co.,Ltd., 2014)
Rocking curve actually observed
The angular dependence of the diffraction intensity (rocking curve) actually observed is different from the Laue function. This is because the incident electron beam suffers multiple scattering in the crystal. The rocking curve is explained by the dynamical diffraction theory taking multiple scattering effect into account.
Let us write the Laue function in one dimensional manner, and assume s to be small and approximate sin πs as πs. Then, the following equation is obtained.
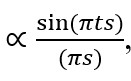
where Ma = t.
According to the dynamical diffraction theory, the Laue function is replaced by the following equation (for details, refer to Ref. 1),
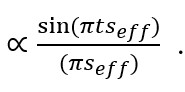
Here,
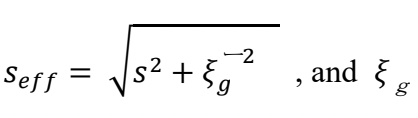
is called “extinction distance” and given by
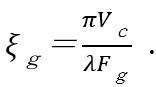
Here, Vc is the volume of the unit cell of the crystal. It is noted that ξg is inversely proportional to the crystal structure factor Fg.
Fig. 2 shows examples of the Laue function (kinematical rocking curve) and the dynamical rocking curve. In the Laue function, the principal maximum increases proportional to the square of the thickness of a crystal, and the width of the principal maximum decreases inversely proportional to the thickness.
On the other hand, the rocking curve obtained by the dynamical diffraction theory is given by a function of seff. As a result, even if the thickness increases, the intensity at s=0 does not diverge with the crystal thickness but remains at a finite value, and the subsidiary maxima slowly decrease along the envelope shown in Fig. 2. Furthermore, the intensity at s=0 does not necessarily take the maximum value (shown in Fig.2(b)).
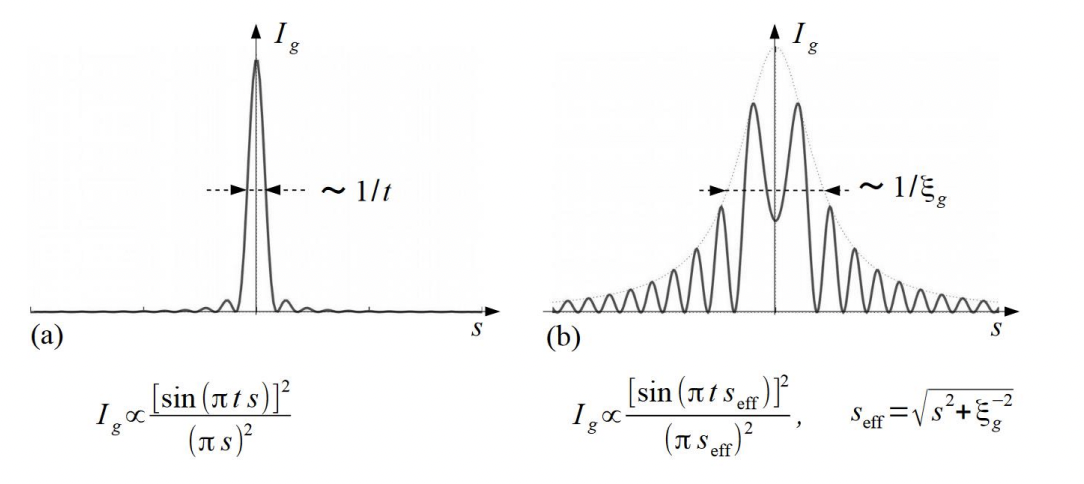
Fig. 2. (a) Laue function (kinematical rocking curve) and (b) dynamical rocking curve. See the explanations in the text.
(reprinted from M. Tanaka, M. Terauchi, K. Tsuda, “Introduction to Electron Diffraction and Elementary Crystallography (in Japanese)”, Kyoritsu Printing Co., Ltd., 2014)
Fig. 3 shows an experimentally obtained rocking curve. It should be noted that the rocking curve shows a good agreement with the dynamical rocking curve shown in Fig. 2(b).
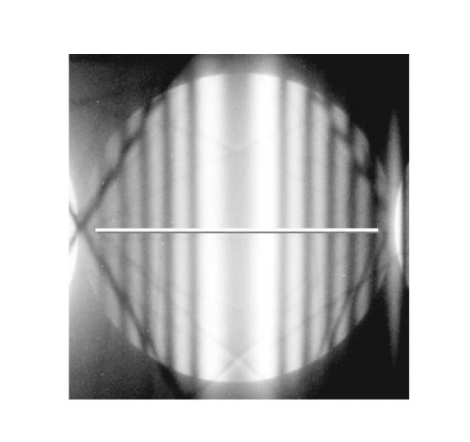
Fig. 3. Rocking curve of the 220 reflection of Si. Angular intensity change is confirmed similar to that in Fig.2(b). (reprinted from M. Tanaka, M. Terauchi, K. Tsuda, “Introduction to Electron Diffraction and Elementary Crystallography (in Japanese)”, Kyoritsu Printing Co., Ltd., 2014)
Ref. 1: M. J. Whelan, Dynamical Theory of Electron Diffraction, in “Diffraction and Imaging Techniques in Material Science”, eds. S. Amelinckx, R. Gevers and J. van Landuyt (North-Holland Publishing Company,1978, ISBN: 978-0-444-85128-4)
Related Term(s)
Term(s) with "Laue function (interference function)" in the description
Are you a medical professional or personnel engaged in medical care?
No
Please be reminded that these pages are not intended to provide the general public with information about the products.