extinction distance
extinction distance
The extinction distance is the distance of a period over which the intensity of electrons incident on a crystalline specimen repeat decrease and increase with the penetration depth.
Consider the case where an electron wave incident on a crystalline specimen causes a single Bragg reflection (called “two-wave approximation”). The incident (transmitted) wave is reflected by a set of crystal lattice planes and damps with the depth of the specimen. The reflected wave increases with the depth. When a certain depth t is reached, the amplitude of the transmitted wave becomes zero and the amplitude of the reflected wave becomes maximum.
As the depth increases further, the reflected wave is reflected toward the transmitted wave. When the depth reaches 2t, the amplitude of the reflected wave becomes zero again and the amplitude of the transmitted wave becomes maximum. In such a manner, the amplitudes of the transmitted and reflected waves alternately decrease and increase with the depth (called “Poendel Loesung” solution in dynamical electron diffraction). The repetition period 2t is termed “extinction distance” ξg.
The extinction distance is expressed by ξg=
. Here, Vc is the unit cell volume of a crystal, λ is the wavelength of an incident electron, and Fg is the crystal structure factor of reflectiong. Since the crystal structure factor Fg corresponds to the reflectivity of reflection g, for a reflection with a larger Fg the transmitted wave is transferred faster to the reflected wave, and then the extinction distance becomes shorter. That is, ξg is inversely proportional to Fg. When the accelerating voltage of the incident electron increases, the interaction between the incident wave and the crystal (or the reflectivity of the crystal) decreases. The extinction distance becomes longer at a higher accelerating voltage or at a shorter wavelength. Thus, the extinction distance ξg is inversely proportional to the wavelength of the incident electron. The wavelength of the electron is inversely proportional to the one-half power of the accelerating voltage.
Fig. 1 illustrates schematically how the transmitted and reflected waves alternate in intensity with the depth of the specimen.
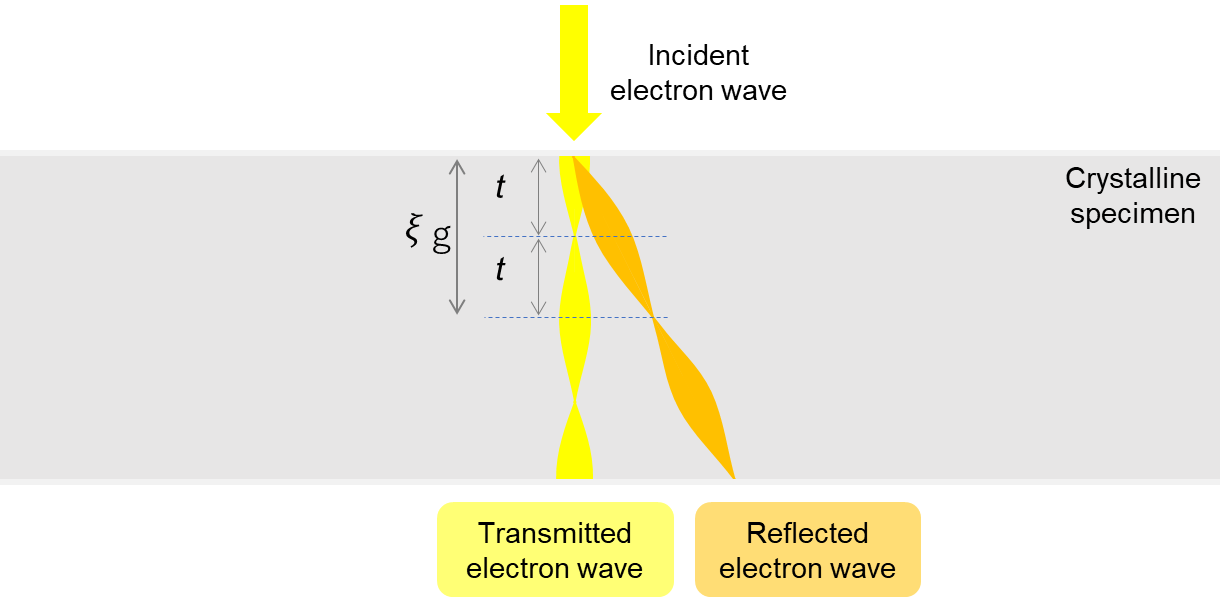
Fig. 1. Schematic of the intensity change of the transmitted and reflected waves in a specimen. The intensities of the transmitted and reflected waves alternately decrease and increase with the depth of the specimen (the repetition period being the extinction distance ξg).
Table below lists the reflection dependence and the accelerating voltage dependence of the extinction distances for Al, Si, Cu and Au. Since the value of the crystal structure factor Fg is larger for lower-order reflections, and is larger for a larger atomic number Z, the corresponding ξg becomes shorter. It is also seen that as the wavelength becomes shorter with the increase of the accelerating voltage, ξg becomes longer.
In experiments, the extinction distance is observed as the equal thickness fringes when using a wedge-shaped crystal.
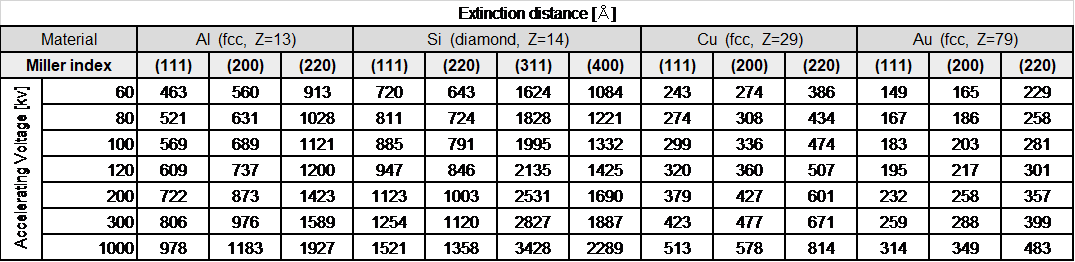
Table: Extinction distances for Al, Si, Cu and Au.
(reprinted from M. Tanaka, M. Terauchi, K. Tsuda, “Introduction to Electron Diffraction and Elementary Crystallography (in Japanese)”, Kyoritsu Printing Co., Ltd., 2014)
Related Term(s)
Term(s) with "extinction distance" in the description
Are you a medical professional or personnel engaged in medical care?
No
Please be reminded that these pages are not intended to provide the general public with information about the products.