(L2, L3), (M4, M5)…spectra
(L2, L3), (M4, M5)…spectra
EELS spectra associated with electronic excitation from the L2 and L3 levels of elements or the M4 and M5 levels to the conduction band. Two similar-shaped spectra appear with an energy difference between the L2 and L3 levels. The spectra set is called (L2 and L3) spectra. For example, the energy difference between the L2 and L3 levels of the 3d transition metals is about 5 to 20 eV. The M4 and M5 spectra show a similar feature to (L2 and L3) spectra.
Due to the spin-orbit coupling, the 2p and 3d inner-shell levels split into two levels. That is, the 2p split levels are expressed as L2(2p1/2) and L3(2p3/2), and the 3d split levels are expressed as M4(3d3/2) and M5(3d5/2) ( ). L2 and L3 spectra are caused by the transition respectively from the levels L2(2p1/2) and L3(2p3/2) to the 3s and 3d components of the conduction band. M4 and M5 spectra are caused by the transition respectively from the levels M4(3d3/2) and M5(3d5/2) to p and f components of the conduction band. Since the final states of the unoccupied states are the same for both transitions, L2 and L3 (M4 and M5) spectra appear as spectra of similar shape separated by the energy difference between the levels L2 and L3 (M4 and M5).
The intensity ratio of the L2 and L3 spectra is expected to be 1:2 from the occupation ratio of the inner-shell L2 and L3 levels. However, the ratio experimentally observed is different from the expected ratio because the density of states of 3d electron in the conduction band is modified and the selection rule for electron transitions becomes different due to the core-hole interaction, the spin orbit coupling at the final state and the Coulomb repulsion of 3d electrons. Utilizing the phenomenon in which the intensity ratio deviates from 1:2, information on the valence of the 3d transition metal can be obtained.
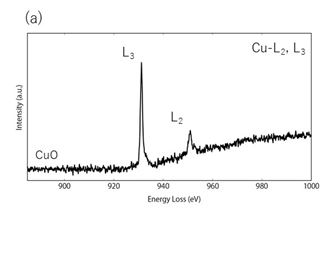
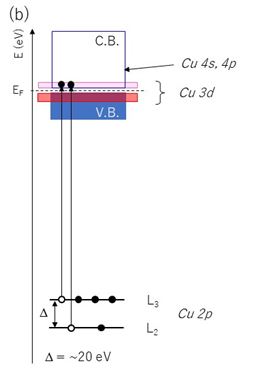
Fig. 1(a) shows L2 and L3 (absorption edge) spectra of copper oxide (CuO). Two peaks of L2 and L3 spectra are separated by about 20 eV. The intensity ratio of L2 and L3 deviates from 1:2. Fig. 1(b) illustrates the electronic energy state of CuO. The L2 and L3 levels have an energy difference of approximately 20 eV due to spin orbit coupling. The observed spectra are interpreted as those from the inner-shell L2 and L3 levels to 3d unoccupied narrow states which is formed at the bottom of the conduction band. The electron configuration of Cu2+ in CuO is [3d9, 4s0] and one hole exists at 3d5/2. The transition selection rule in this case is not determined by the orbital angular momentum change but by the total angular momentum change  due to the spin-orbit coupling. Thus, the transition from 2p3/2(L3) to 3d5/2 is allowed, but the transition from 2p1/2(L2) to 3d5/2 is forbidden. This indicates that the L3 peak should be observed, but the L2 peak should not be observed. However, a weak L2 peak is observed in the experiment as shown in Fig. 1(a). This is because there exist holes at the 3d3/2 orbital component, which are caused by a weak covalent bonding between Cu and O.
The difference of the M4 and M5 energy levels of sixth-period elements is 10 to 120 eV. Two spectra with similar shape successively appear with the energy difference in the EELS spectrum. The intensity ratio of the M4 and M5 spectra is expected to be 2:3 from the occupation ratio of the inner-shell 3d electron levels.
Fig. 2(a) shows M4 and M5 (absorption edge) spectra of Ba in barium titanate (BaTiO3). Two peaks of M4 and M5 levels are seen with an energy difference of approximately 15 eV. The intensity ratio of M4 and M5 is approximately 2:3 as expected. Fig. 2(b) illustrates the electronic energy state of BaTiO3. The M4 and M5 levels for Ba have the energy difference of approximately 15 eV due to spin-orbit coupling. The unoccupied narrow state of Ba-4f component is formed in the conduction band. Thus, transition spectra from the inner-shell M4 and M5 levels to the 4f unoccupied state are observed.
The L2 and L3 absorption edges of barium are reported to be 5247 eV and 5624 eV. Usually, as EELS measurements are performed up to about 1000 eV, it is difficult to observe the L2 and L3 spectra of barium.
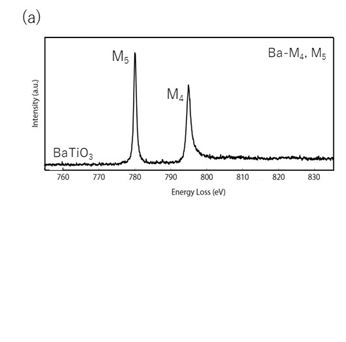
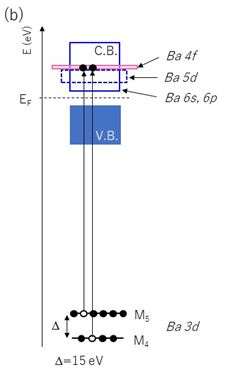
Fig. 2 (a) M4 and M5 (absorption edge) spectra of Ba in barium titanate (BaTiO3). The M5 transition peak appears at 780 eV, and the M4 peak at 795 eV. The intensity ratio of the M4 and M5 spectra is approximately 2:3, indicating that the experimentally obtained ratio is close to the expected ratio. (b) Schematic of the electronic energy state of BaTiO3 and the process of M4 and M5 transitions. The pink part shows Ba-4f orbital component. Since 14 seats of Ba-4f orbitals are unoccupied, the M4 and M5 peaks are observed extremely strong. The Ba-6s and Ba-6p orbitals form a relatively broad conduction band and the density of states is small. The transition to the 6s orbital is forbidden. The transition spectra to the 6p orbitals form broad background. The background is very weak comparing with the M4 and M5 peaks.
For the third periodic elements (Al, Si, etc.), L2 and L3 spectra are created by the transitions from the inner-shell 2p levels to 3s components in the conduction band. Since the energy difference between the L2 and L3 levels is less than 1 eV, L2 and L3 spectra are observed as one absorption edge spectrum without splitting. Then, L2 and L3 spectra in such a case are written as L2,3.
(By Associate Professor Yohei Sato, Tohoku University)
Related Term(s)
Term(s) with "(L2, L3), (M4, M5)…spectra" in the description
Are you a medical professional or personnel engaged in medical care?
No
Please be reminded that these pages are not intended to provide the general public with information about the products.