Solid-state battery
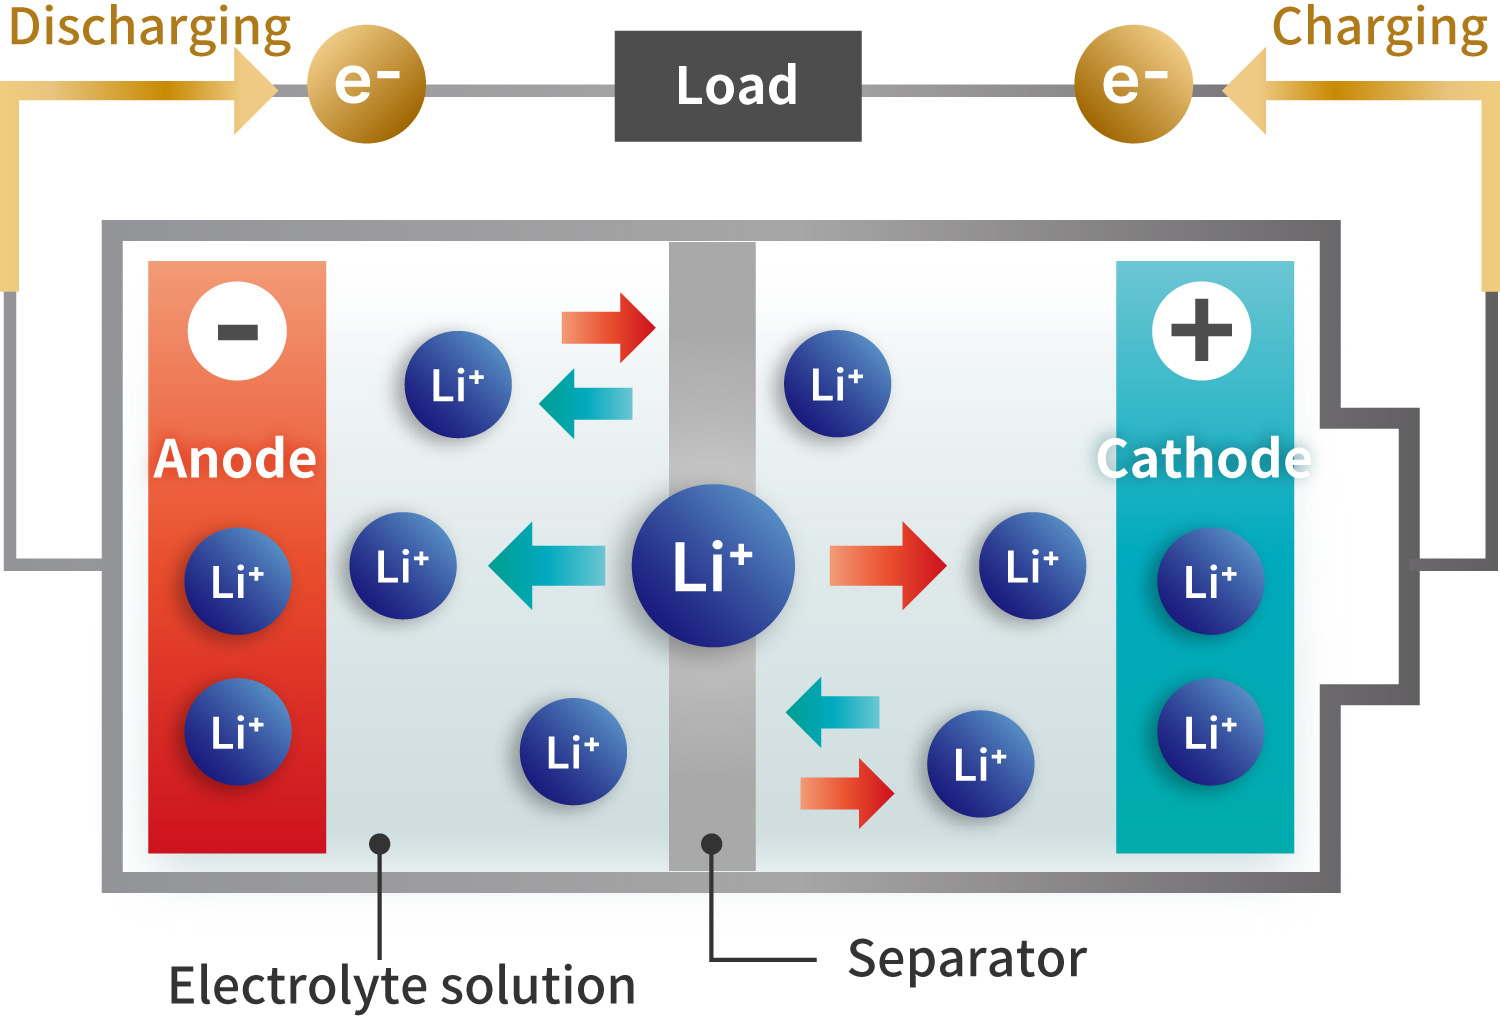
Image of charging and discharging of LIB
Solid-state batteries operate by charging and discharging through the movement of lithium ions, similar to conventional lithium-ion batteries (LIBs). However, instead of using a liquid electrolyte and separator between the cathode and anode, they employ a solid electrolyte. This replacement reduces the risks of smoke and ignition caused by liquid electrolytes, making solid-state batteries more suitable for applications such as battery electric vehicles (BEVs) and large-scale energy storage systems (ESS).
In recent years, the use of lithium-based rechargeable batteries has increased with the growing adoption of BEVs. However, conventional LIBs still face challenges in areas such as safety, driving range, and durability. As a result, expectations for next-generation batteries are high, and development toward practical implementation is actively being pursued by both automakers and battery manufacturers.
Composition of Solid-state Battery
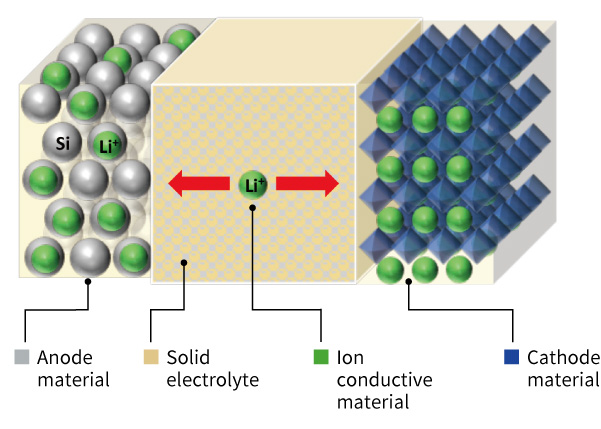
The structure of a solid-state battery (SSB) is illustrated in the figure on the right.
Unlike conventional LIBs, SSBs use a solid electrolyte to conduct ions instead of a polymer separator and liquid electrolyte between the cathode and anode.
Similar to LIBs, the cathode in an SSB consists of lithium transition metal oxide materials and conductive additives. Additionally, a solid electrolyte is incorporated into the electrode structure.
For the anode, while carbon materials are commonly used in LIBs, silicon-based materials have recently gained attention due to their ability to store nearly 10 times more lithium than carbon. As a result, research on silicon anodes is actively progressing.
Since solid-state batteries use lithium just like LIBs, manufacturing under an air-isolated environment is essential to prevent degradation from moisture or air exposure.
Solid-State Battery Note
Research and development of rechargeable battery cells--designed for repeated use--are advancing to support power sources for battery electric vehicles (BEVs) and large-scale energy storage systems (ESS).
To improve both the performance and quality of these battery cells, detailed analysis and evaluation using high-performance analytical instruments are essential.
This Solid-State Battery Note was created using samples provided by Prof. Atsunori Matsuda of the Department of Electrical and Electronic Information Engineering at Toyohashi University of Technology. It aims to offer reference information and potential solutions for the research and development of solid-state batteries, which are emerging as the next generation of lithium-ion batteries (LIBs).
Cathode
Cathode material
Cathode
material
active material of lithium ion rechargeable battery

Aluminum foil (left) and Aluminum foil with cathode material (right)
The cathode of a typical lithium ion battery consists of a current collector, cathode active material, conductive assistant, and binder. Aluminum foil is used for the current collector, and cathode active material and conductive assistant, slurry of binder solved and kneading with solutions are applied on current collector. The left figure shows the aluminum foil current collector before cathode materials are applied. The right figure shows aluminum foil current collector after the cathode material is applied and the black part in the center of the aluminum foil is the applied electrode material.
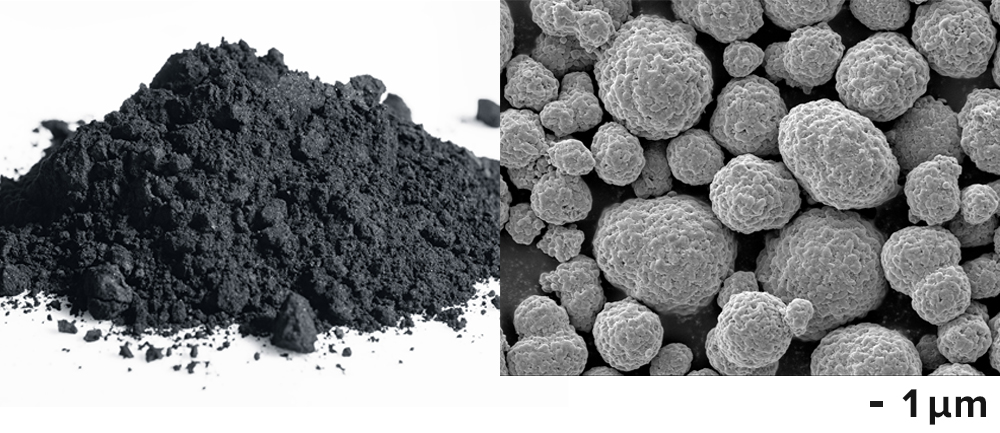
Cathode material powder (left)
Cathode material NMC811
SEM image (right)
Transition metal oxides including lithium are used for cathode active materials. For the material of cathode active materials, there are lithium cobalt oxide, NMC ((Li(Ni1/3Mn1/3Co1/3)O2 - the nickname from abbreviation of each transition element of Ni,Mn,Co) of ternary system cathode material which replaced part of cobalt with nickel and manganese, and NCM consisting of nickel, cobalt, and aluminum. These are used for batteries for electric vehicles such as automobiles. Additionally, LFP (LiFePO4) which uses lithium iron phosphate as a cathode active material is frequently used Iron phosphate-based materials are known for their safety as their crystal structure is less likely to collapse even during internal battery heating, making thermal runaway less likely. This makes them highly suitable for automotive applications. Moreover, as the raw material of iron is less expensive than other transition metals, it is advantageous in terms of production costs. Each cathode material has unique features and is used according to the purpose.
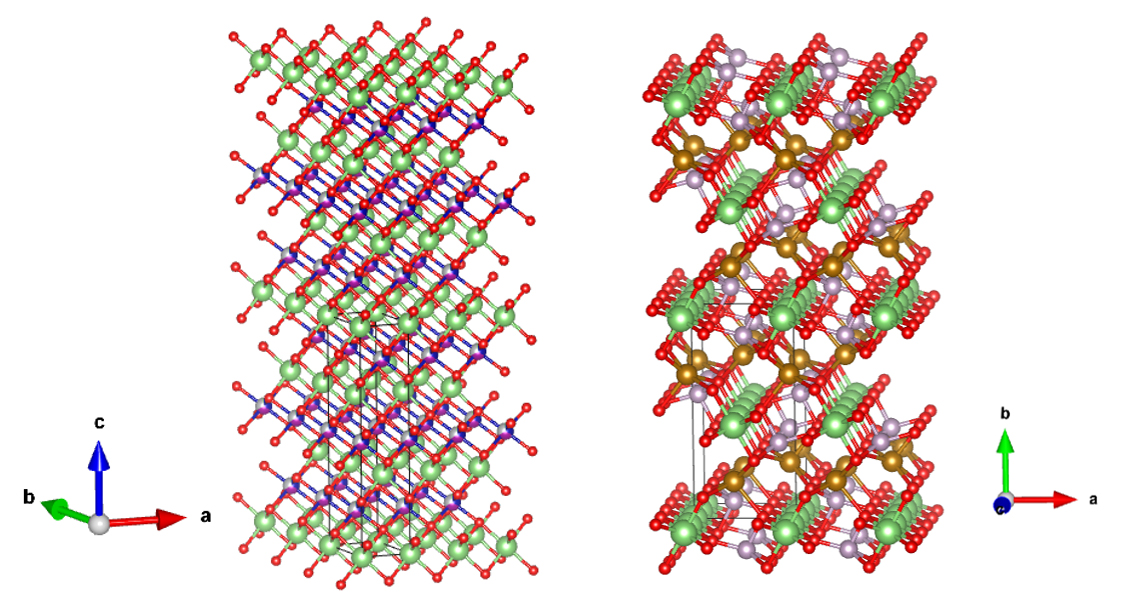
Crystal structure of cathode material
NMC/NCA Layered
Rock Salt Structure
(left)
LFP Olivine Structure (right)
refer to :
J.Appl.Cryst.(2011).44,1272-1276
Each cathode active material has a theoretical capacity which is a conversion of lithium
volume into
electric charge. However, optimization to the maximum capacity has not been implemented.
The development
of the cathode material enabling higher capacity further is being promoted. In research
and development,
a substitution body of each transition metal and a material with a changed Li volume
have been
examined.
In evaluation for research and development, various analyses are required along with
battery features,
such as the stability of a crystal structure accompanied by an insertion and extraction
reaction of Li,
and a surface coating film thickness & compound.
| Cathode material | Average voltage [V] | Theoretical Capacity [mAh/g] | Actual Capacity [mAh/g] | Cycle characteristics | Feature |
|---|---|---|---|---|---|
| LiCoO2 | 3.7 | 274 | 148 | 500~1,000 | Expensive raw material/Relatively low thermal stability |
| NMC | 3.6 | 280 | 160 | 1,000~2,000 | Potential changes are gradual |
| NCA | 3.6 | 279 | 199 | 500~1,000 | High energy density/Relatively tolerant to low temperatures |
| LiFePO4 | 3.2 | 170 | 165 | 1,000~2,000 | Less expensive raw material/Flat potential change/Relatively high stability |
Cathode current collector foil
Aluminum foil is used as the best material for the cathode current collector to hold the cathode
active
material and transfer the electrons to the cathode active material to apply an electric current.
Aluminum foil is a highly corrosion-resistant and conductive material free from lithium ion
doping. Also,
the surface is covered with a natural oxide film and during charging a higher
corrosion-resistant aluminum
fluoride is formed on the surface, enabling a large electric current.
Analysis example of cathode material
Structural
evaluation of
cathode
active material
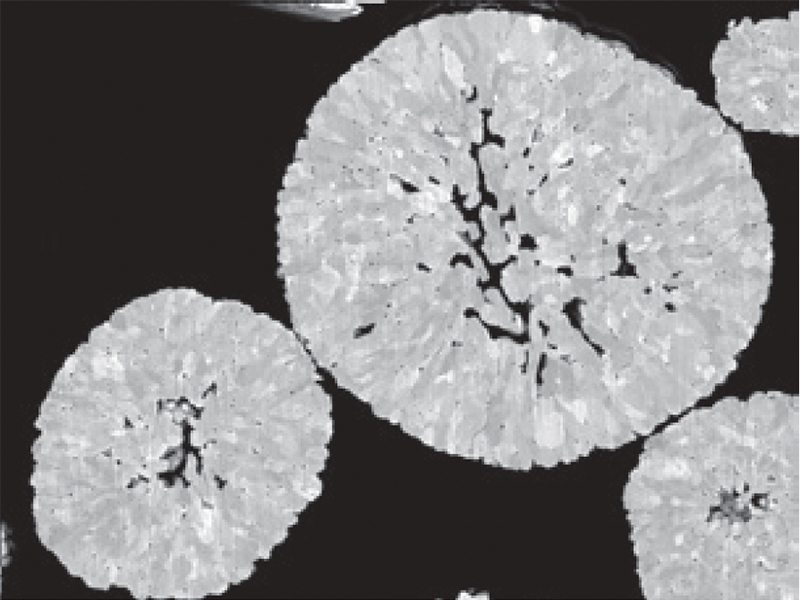
SEM Image of cathode particle cross section
Cathode active material consists of spherical secondary
particles.
The primary particle size varies from several tens nm and several hundreds nm, depending
on the active
material. Cathode active material is the result of these sintered into a sphere. Cathode
active material
containing lithium extracts lithium during charging, and the lithium ions go back from
the anode to the
original crystal lattice position during discharging. However, sometimes, lithium ions
do not go back to
the original crystal lattice position due to various factors such as overcharging to
make different
structure. Evaluation of this structural change is also an important analysis to
determine the mechanism
of battery performance degradation and the degree of degradation. For the structural
analysis, local
structural changes are analyzed by a Transmission Electron Microscope (TEM), in addition
to
understanding the average structure by XRD and evaluation by the Raman shift. The
following examples are
of understanding a crystal structure change from evaluation by Raman installed on a SEM
and electron
diffraction and atomic resolution images from a very small area using a TEM. The other
case is the
analysis of lithium behavior during charging and discharging using solid-state NMR.
The following figure shows the analysis example of structural changes of cathode active material according to the charging rate, using a Raman spectroscopy within a SEM, by SEM-EDS-Raman combined system. The Raman spectrum capturers the structural change of the cathode active material, in the states of uncharged, 50% SOC, 100% SOC, and overcharged, which is not captured by EDS. With the Raman spectrum, the changes of vertical and horizontal vibration between oxygen-oxygen in a crystal structure when Li is extracted by charging, are expressed in Rama Shift as the wavelength shifted against the laser light. The Raman spectrum shows the Raman Shift as a shift in wavelength relative to the laser light, representing the change in longitudinal and transverse vibrations between oxygen and oxygen in the crystal structure as Li is extracted by the charging process.
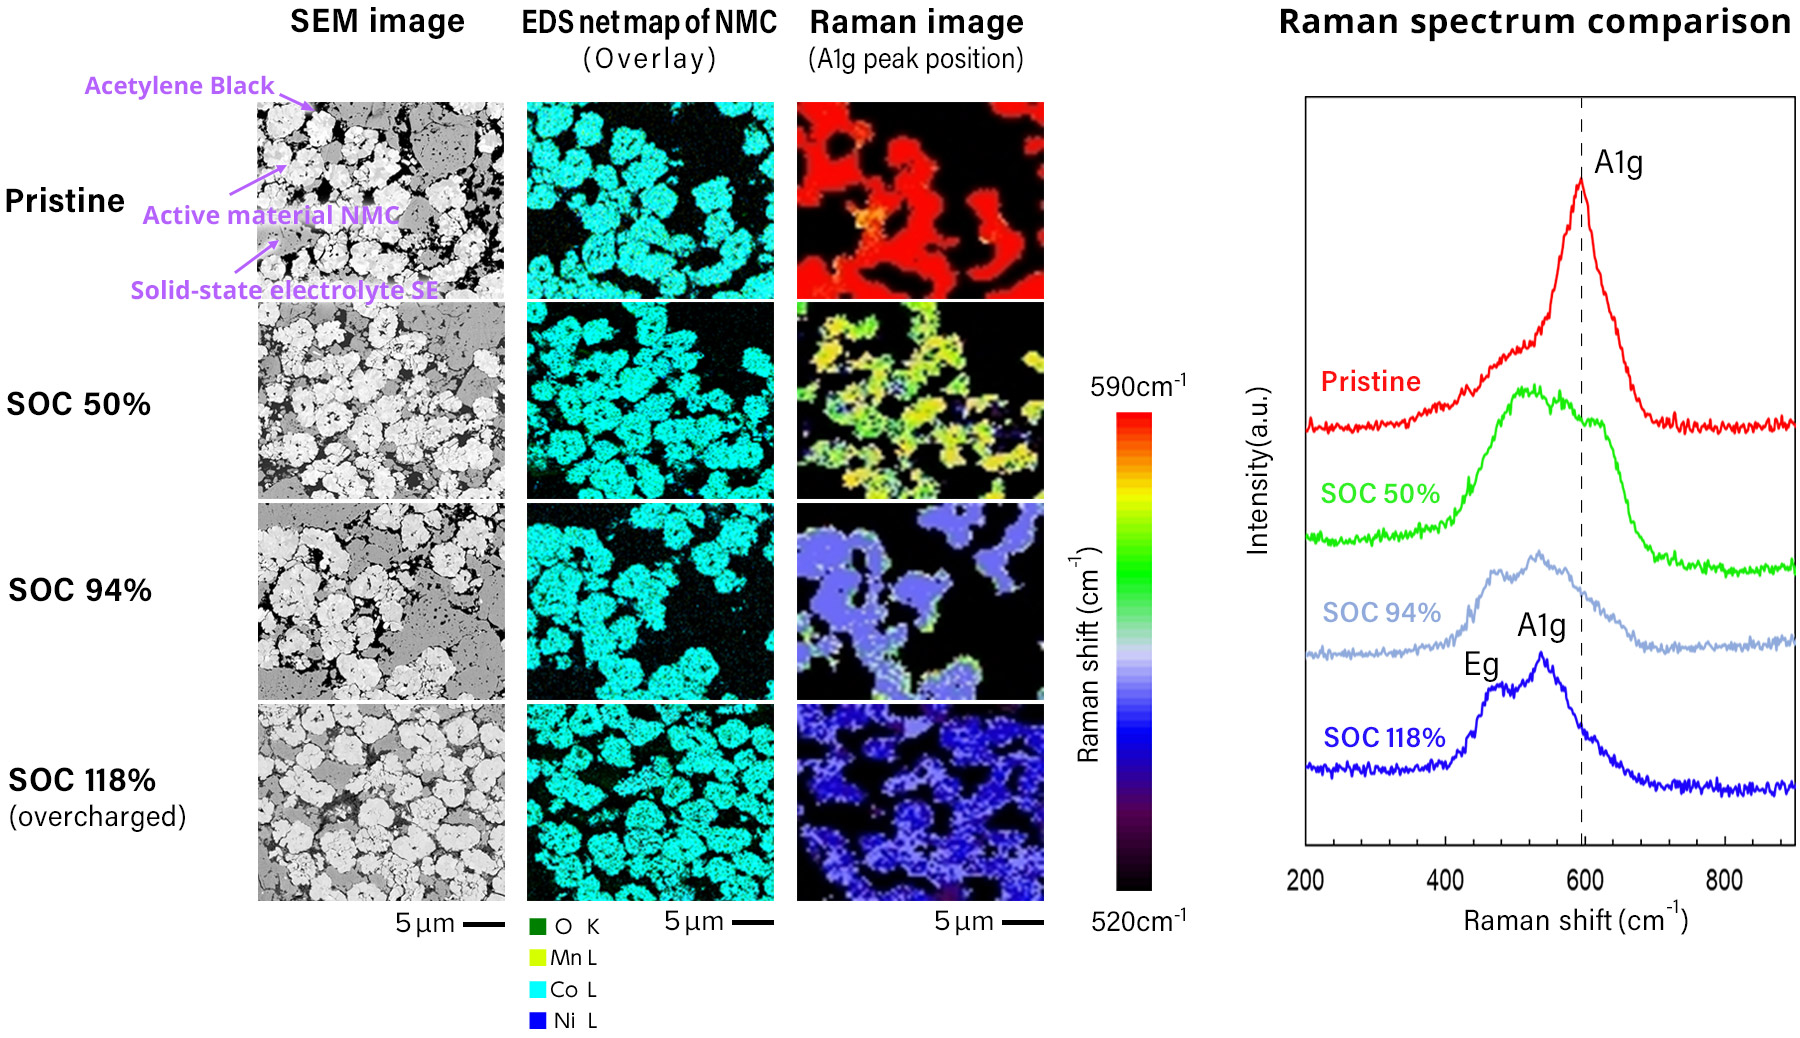
Sample courtesy:
Prof. Atsunori Matsuda
Department of
Electrical and
Electronic Information Engineering
Toyohashi University of Technology
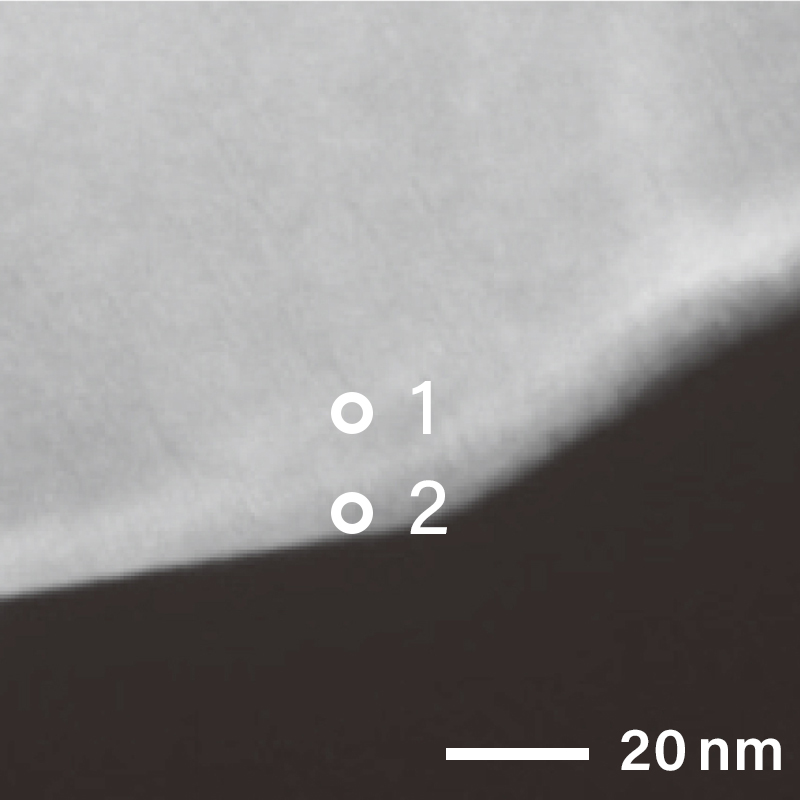
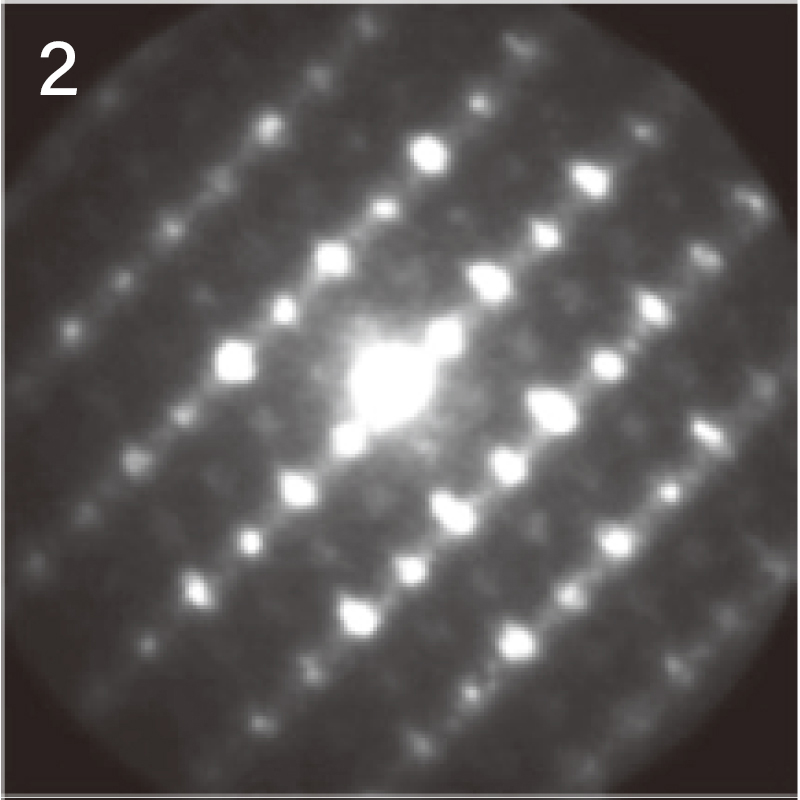
The figure below shows the electron diffraction pattern near the surface of the cathode material particle using a TEM. As different electron diffraction patterns were obtained on the surface and inside of the cathode, it is known that the structures are different. When local electron diffraction is needed, Nano Beam Electron Diffraction (NBD) is used. The NBD method revealed that the diffraction pattern was taken from the [11-20] direction of layered rock salt structure inside the particle at analysis position "1". On the other hand, on the surface at analysis position "2", electron diffraction pattern structure that is different from analysis position "1" can be seen.
NBD patterns obtained from the surface and inside of the particle

The figure below shows the results of crystal orientation and crystal structure analysis of particles within a cathode active material using Precession Electron Diffraction (PED). PED is an electron diffraction method to obtain an electron diffraction pattern with a less dynamical diffraction effect by precessing the incident electron beam under a certain tilt angle(with respect to the optical axis). From the electron diffraction obtained at each point while scanning the electron beam, (a) orientation maps and (b) phase separation maps can be created.
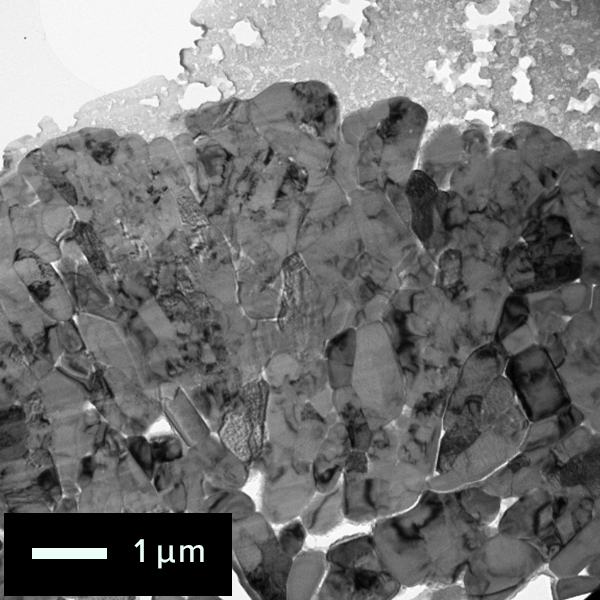
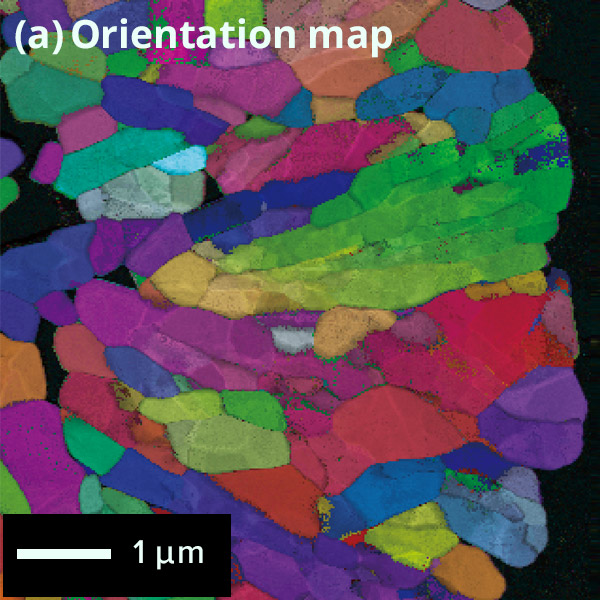
Crystal orientation map of cathode active material
particle
Colored
according to the crystal orientation of particles
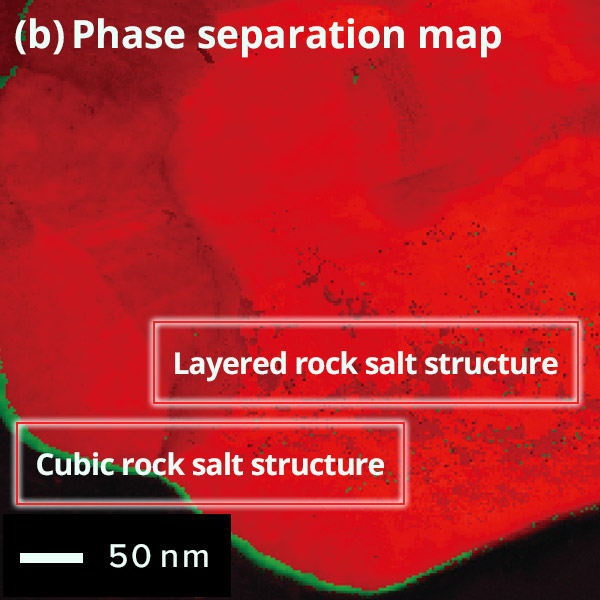
Phase Map of cathode active material particle
Difference of
surface and
inside structures in color
Red: Layered rock salt structure, Green: Cubic rock salt
structure
The figure below shows an example of the surface of a cathode active material particle observed before and after charging/discharging using the atomic resolution HAADF-STEM observation method. The triatomic layer on the electrode surface of the active material particle has changed since before charging/discharging. But almost no atomic bright spots are visible at the sites occupied by lithium and oxygen, which are located in the red frame. It is correct that the STEM-HADAF method does not show anything at the lithium site because light elements are difficult to see. On the other hand, after charging and discharging, atomic bright spots are visible at the lithium occupied site in the red frame. This bright spot reflects the phenomenon (cation mixing) that the transition metal of the compound enters into the lithium site.
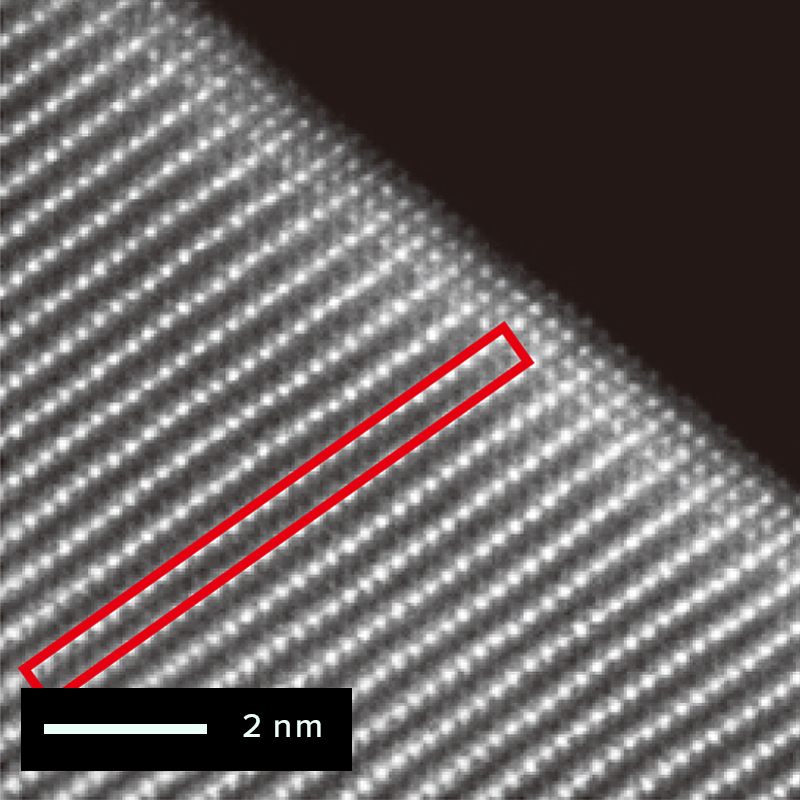
Before charging / discharging
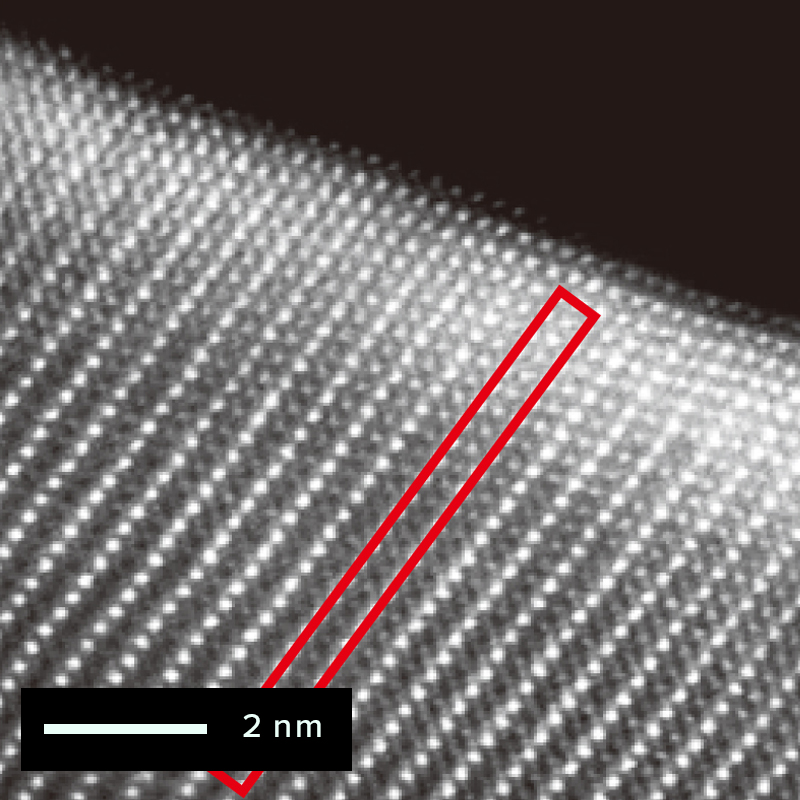
After charging / discharging
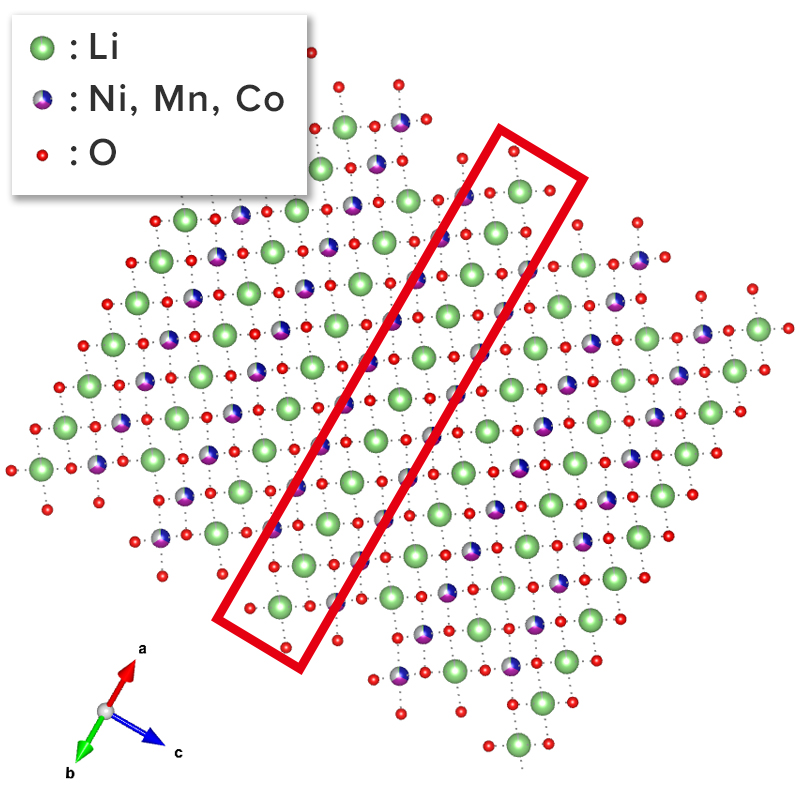
NMC structure
refer to :
J.Appl.Cryst.(2011).44,1272-1276
7Li solid-state NMR is also an effective method for the structural analysis of
cathode active
materials.
Solid-state NMR can observe lithium in the crystal structure of the entire sample. It is also
compatible
with the X-ray diffraction method, and the analysis is supplemental to each other. In addition,
NMR can
support the quantification of minute structural changes in TEM results, which are microscopic
observations
and analysis.
In the lithium spectrum of cathode active materials, a characteristic feature is the broadening
of the
spectrum over several thousand ppm due to the paramagnetic interaction between the transition
metal (TM) and
lithium. A 3.2 mm or 4 mm diameter solid-state MAS (magic angle spinning) probe, which is
commonly used,
does not produce good spectra due to spinning sidebands (SSB) caused by the excitation range and
slow sample
rotation. However, with an ultra-fast MAS probe with a diameter of 1 mm or less, a spectrum can
be obtained
with the SSB shifted away from the original peak (Fig. 1). Furthermore, 7Li spectra without SSB
can be
obtained by combining with the recently developed MATPASS measurement method (Figure 2).
Figure 2 below shows an example of 7Li MATPASS spectrum obtained during charging and
discharging
of a
lithium-rich layered cathode active material
Li1.2Ni0.2Mn0.6O2.
Four major peaks are observed in state #1
when uncharged. The NMR shift value of 0 to 1000ppm in the spectrum is attributed to lithium in
the lithium
layer in the crystal structure, and 1000 to 2000ppm to lithium (LiTM) in the
transition metal
layer. In
addition, peaks appear at different positions when the transition metal near lithium in the
crystal
structure is "Mn only" and when "Mn is replaced by Ni". The signal related to lithium decreases
as lithium
is removed from the structure with charging from #2 to #5, and then recovers at #7 after
discharge as
lithium returns to the structure. With solid-state NMR, the lithium that leaves the structure
during
charging and the structural location when the lithium returns during discharging can be observed
from the
spectral changes associated with charging and discharging. The behavior of lithium associated
with
structural degradation can be analyzed.
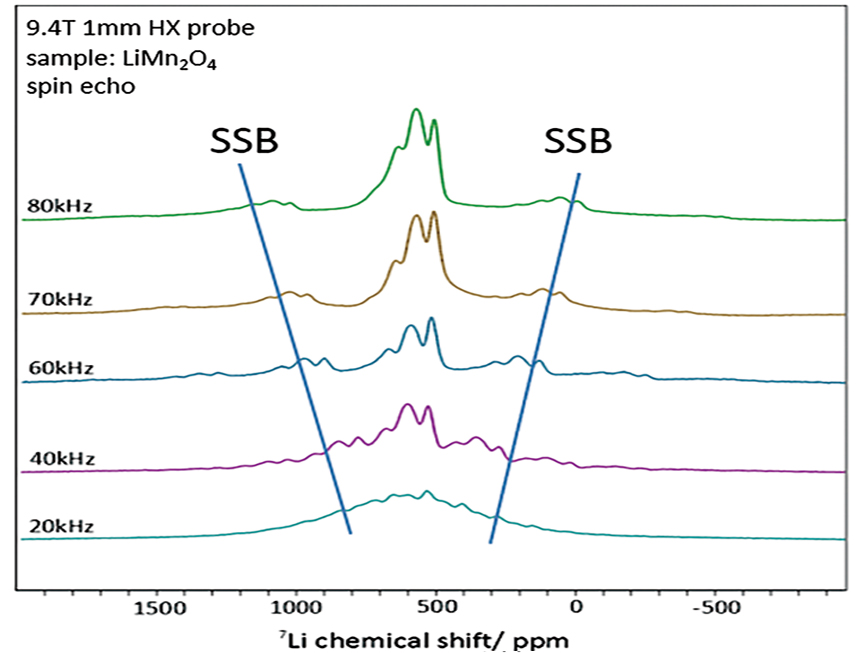
Figure 1 : 7Li Solid-state NMR spectra of MAS frequency dependence
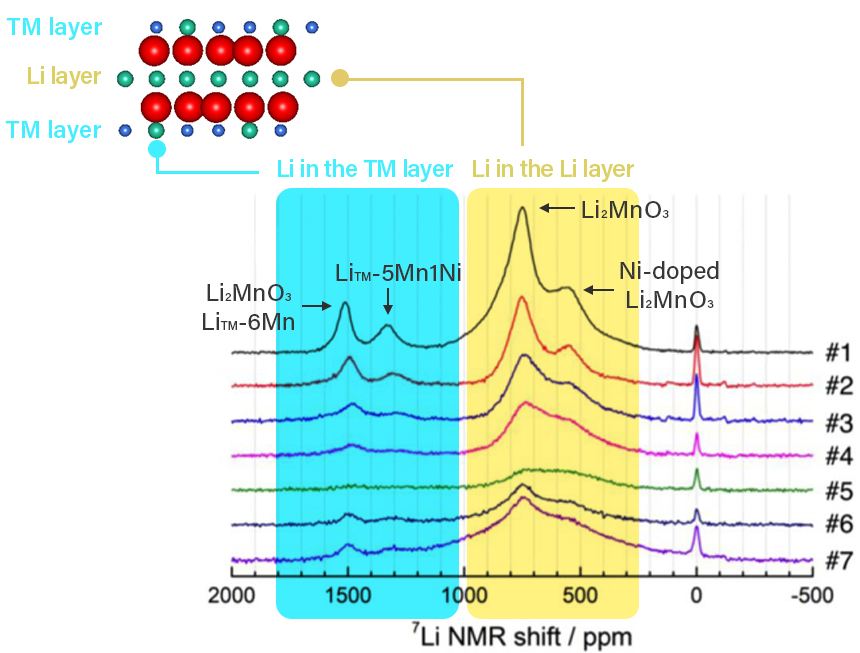
Figure 2 : 7Li MATPASS spectrum reflecting lithium in
cathode
active material structure during charging and discharging
refer to : Scientific Reports (2020) 10 : 10048
Anode
Anode Material
Anode
Active
Material of
Lithium Ion Rechargeable Battery
A typical anode of lithium ion battery is composed of a current collector, anode active material, conductive assistant, and biner. Copper foil is used as a current collector and the same as cathode, anode active material, conductive assistant, and slurry which is binder kneaded by solution, are applied on top of the current collector.
Slurry which are various materials kneaded by solution
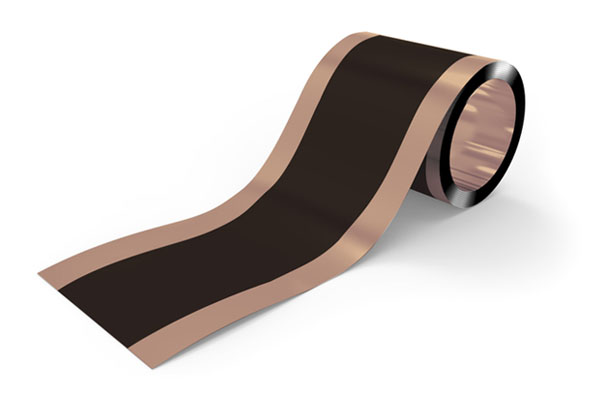
Anode current collector with slurry applied on copper foil
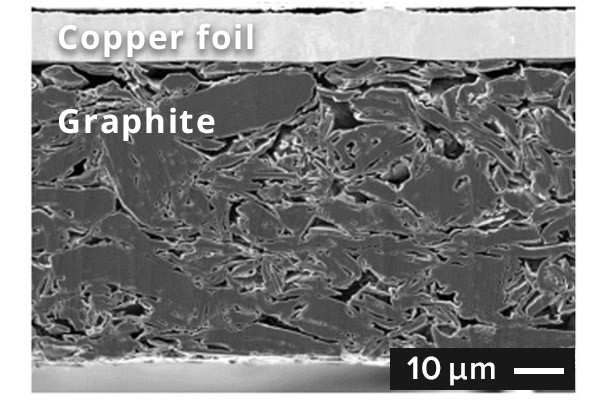
SEM image of graphite anode cross section
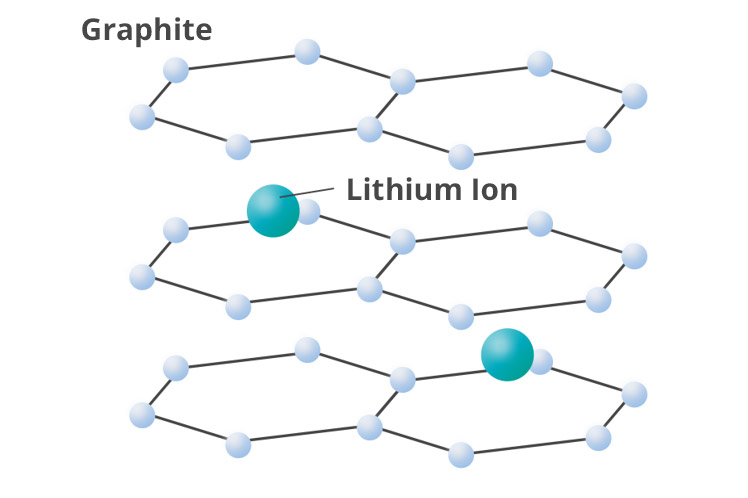
Schematic diagram of graphite with lithium ion inserted
In general, graphite carbons are used for anode active material. The graphite anode is
charged by
lithium from the cathode entering into a layered structure (intercalation). The
theoretical capacity of
the graphite anode is 372 mAh/g. It is not high compared with the capacity of lithium
metal of 3860
mAh/g, the graphite anode is highly safe and is widely used.
On the other hand, the use of silicon anode (4,200 mAh/g) is promoted in research and
development
activities of anode active material. It is attracting people's attention as a material
that can be used
for carbon anode because of its high theoretical capacity and abundance of resources.
Although it has
issues of cycle characteristics due to volume change during charging and discharging,
its application to
solid-state battery is expected.
Current collector foil for anode
Same as the cathode current collector, the copper foil which is used for anode has the feature of electrolyte solution resistance and oxidation resistance, and is used as a corrosion resistant material. The operation potential of an anode using graphite as the active material ranges from 0.1 to 1.5V vs Li+/Li nearby. Aluminum foil is less expensive and light-weighted, but it forms Li-Al alloy at about 0.6 V vs Li+/Li when used for anode, thus leading to degradation of the battery capacity. Therefore, copper foil which is electrolyte solution resistance and oxidation resistance and relatively low costs are used.
Example of Anode Material Analysis
Structural
Evaluation of
Silicon-Based Anode
Materials
Silicon is also considered a promising anode active material for solid-state batteries.
However, silicon anodes face several challenges, such as volume expansion due to lithium insertion and extraction, as well as irreversible capacity loss.
Furthermore, the behavior of lithium within individual silicon particles still requires clarification.
To evaluate anode degradation, measurements of electrical characteristics--including internal resistance--are performed, along with morphological observations and various analytical methods.
For morphological observation, SEM is typically used to analyze the anode layer and silicon particles during charging and discharging cycles.
(See figure below.)
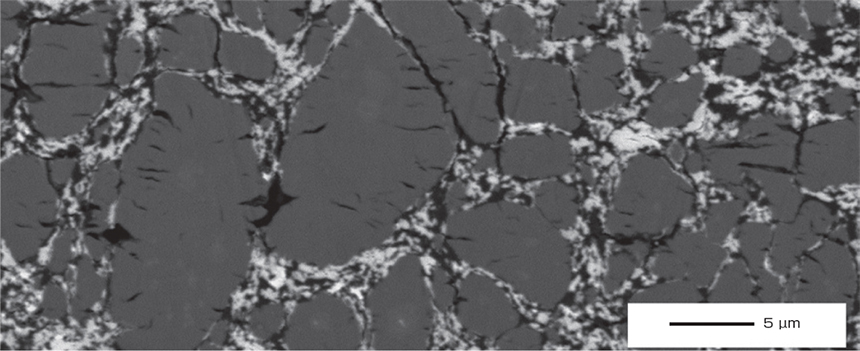
SEM image of silicon anode cross section with crack occurred after charging/discharging.
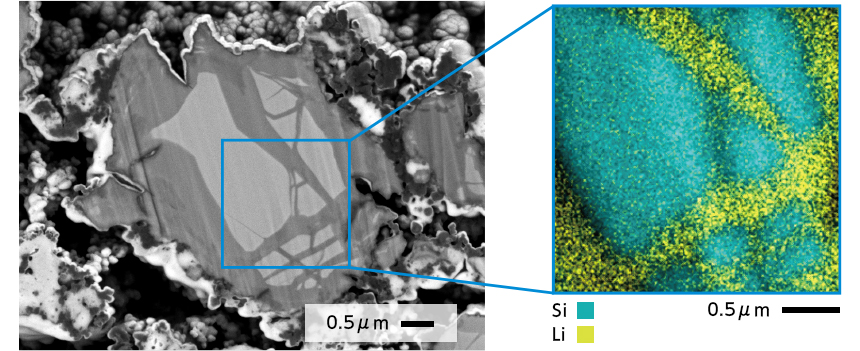
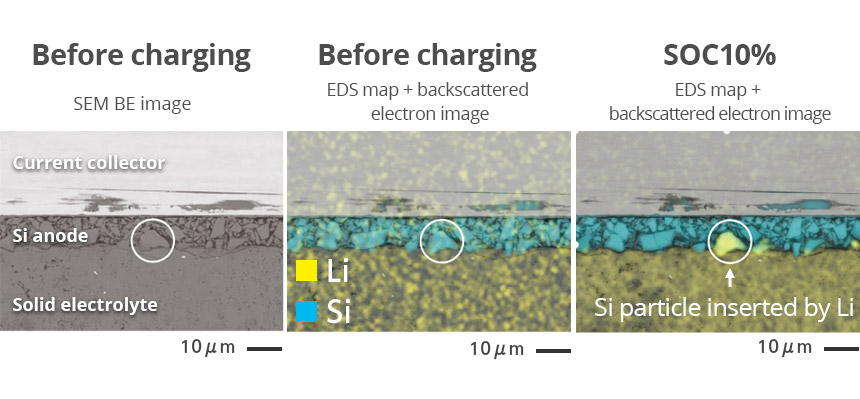
Silicon particle of silicon anode after charging (SEM image and EDS elemental map)
Sample courtesy:
Prof. Atsunori Matsuda
Department of
Electrical and
Electronic Information Engineering
Toyohashi University of Technology
Observations during both charging and discharging provide important information for understanding the underlying mechanisms.
However, preparing a cross-sectional sample at each state of charge is a time-consuming and labor-intensive task.
Moreover, since continuous observation of a single particle is not feasible, behavior must be inferred from multiple experimental data points.
Recently, there has been increasing demand for methods that allow direct observation of the material state during actual charging and discharging.
Analysis Example of Anode Material
In-situ
Observation of Silicon Anode during Charging and Discharging
The following workflow shows a system that enables SEM observation during charging and discharging (see Figure).
This system significantly reduces the number of steps required for cross-sectional preparation at each charge/discharge state.
It also allows for time-resolved observation of the same particle as it changes, along with the analysis of lithium distribution within silicon particles using Gather-X, an EDS system capable of detecting lithium.
Furthermore, the chemical state of silicon at various states of charge can be analyzed using SXES, which provides detailed insights into the chemical changes occurring during the charging process.

The figure below illustrates the workflow and an observation example of a solid-state battery cross-sectioned using a CROSS SECTION POLISHER™(CP), with in-situ observation performed using a SEM.
In-situ charging/discharging observation was made possible by using a dedicated CP-compatible holder and a holder base designed for SEM integration.
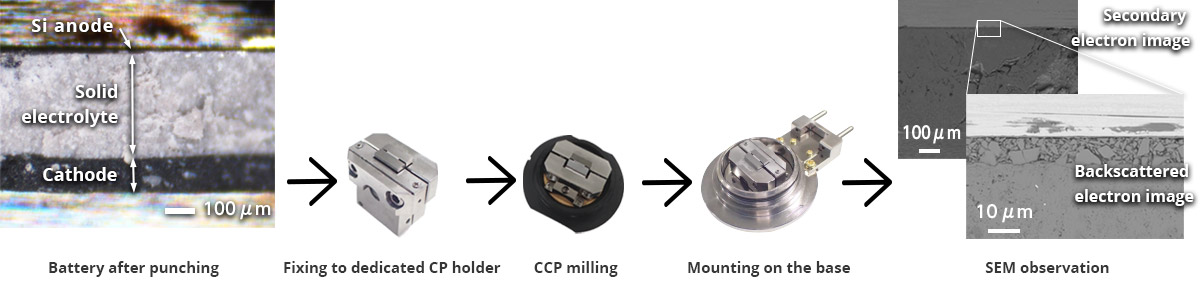
The specially developed stacking pressure charging/discharging CP cell holder allows transfer without air exposure after milling, as it is equipped with a cap for air-isolated transfer from the CP to the SEM. Additionally, when combined with the charging/discharging terminal base, it enables charging and discharging within the SEM.
These dedicated tools eliminate the need for cross-section milling at every charging/discharging step, enabling continuous observation and analysis during charging and discharging in the SEM.
The figure below shows an example of EDS analysis during in-situ SEM observation.
The characteristic X-rays of silicon used in the anode and the nearby lithium can be detected. However, thanks to Gather-X's waveform separation function, the overlapping peaks of Li-K and Si-L can be clearly separated. As a result, lithium introduced and distributed within silicon can be observed in elemental mapping.
Moreover, the playback function of EDS elemental detection allows visualization of integration over time, enabling detailed capture of lithium behavior.
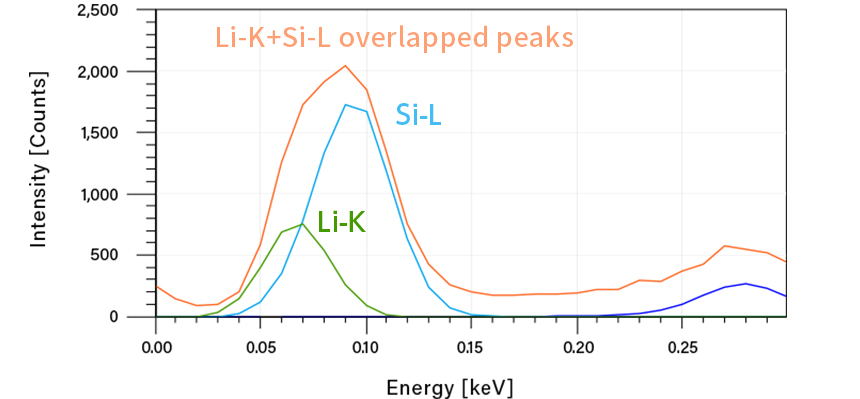
Li-K line(green) and Si-L line(blue) separated by waveform separation of Gather-X
SEM
observation and EDS analysis during charging and discharging
Visualization of lithium behavior with the overlapped image using the play back function
Sample courtesy:
Prof. Atsunori Matsuda
Department
of Electrical and
Electronic Information Engineering
Toyohashi University of Technology
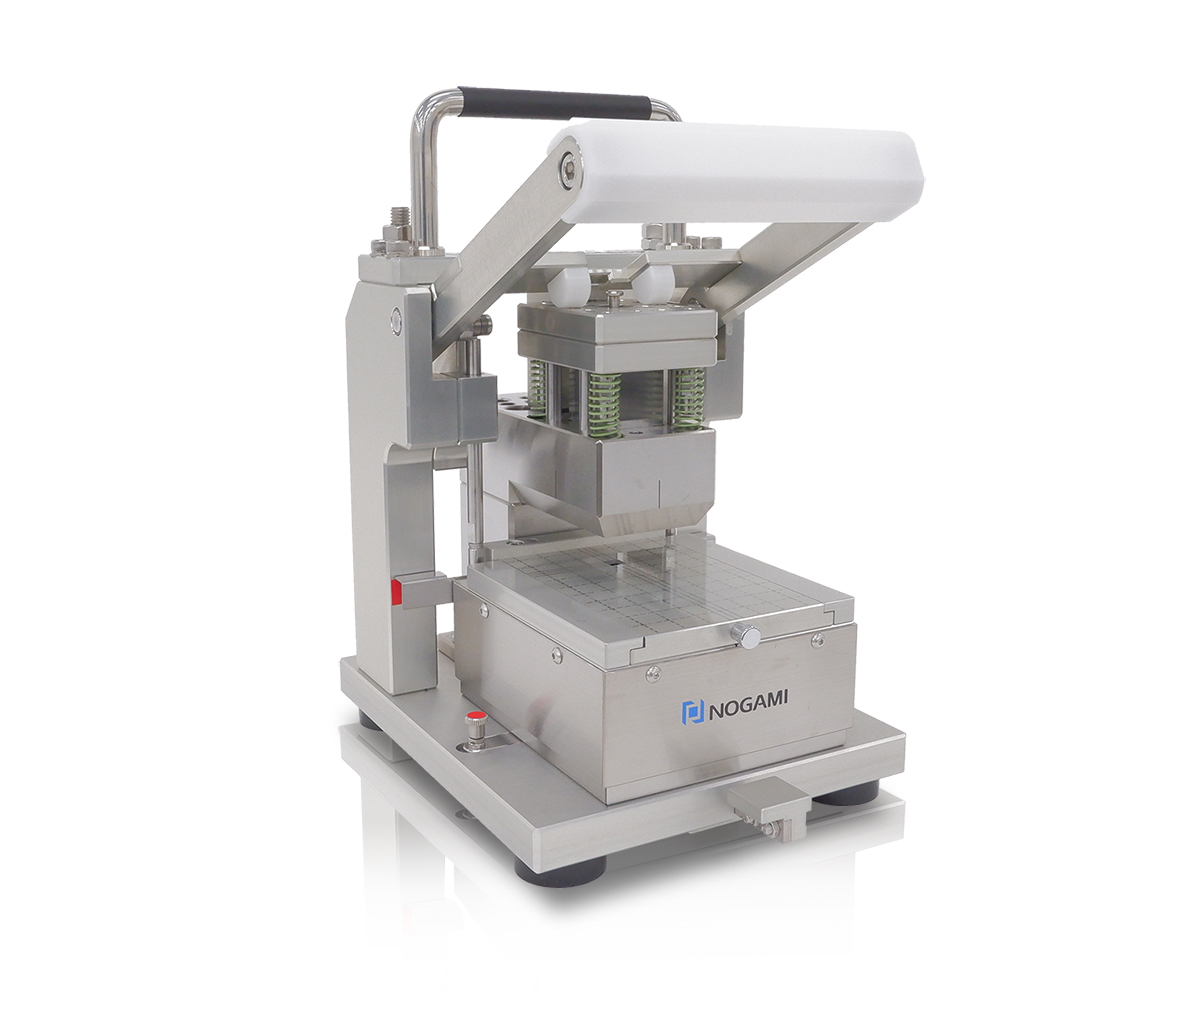
Sample punching tool for cross section observation made by Nogami Giken Co., Ltd.
On the other hand, the solid electrolyte in a solid-state battery is formed by pressing particles of several nanometers in size, giving it brittle characteristics. Handling this brittle material during pretreatment before CP milling is challenging.
For pretreatment, a punching tool is required to cut the brittle material into a predetermined shape with minimal cracking. Here, we use a punching tool manufactured by Nogami Giken Co., Ltd.
For cross-section milling, the sample is punched into a 5 mm square using the punching tool and then fixed onto the stacking pressure charging/discharging CP holder. CP milling is performed on the 5 mm square sample while cooling it to -120°C and applying a uniform stacking pressure of 50 MPa.
A movie introducing in-situ charging and discharging observation・analysis system is
available.
Click
the play button in the box above, and the movie starts. (3 min 33 sec).
Application on anode material
Solid electrolyte
Solid electrolyte
Solid electrolyte of
solid-state battery
A solid electrolyte functions both as an electrolyte solution--transporting lithium ions between the cathode and anode, similar to liquid electrolytes in LIBs--and as a separator to prevent short circuits. Although it is a solid, it exhibits high ionic conductivity and has a wide electrochemical stability window. Conventional organic electrolytes begin to decompose when the battery voltage exceeds around 4 V, limiting the upper voltage of the battery. In contrast, solid electrolytes can enable the use of cathode materials with voltages up to 5 V due to their wider stability window. Additionally, unlike liquid electrolytes, anions other than lithium ions do not significantly affect conductivity in solid electrolytes, reducing side reactions. As a result, solid electrolytes are expected to contribute to longer battery lifespans.
The current mainstream in solid electrolyte research and development focuses on two types of materials: oxides and sulfides. Oxides have lower ionic conductivity compared to sulfides but are stable in air. Sulfides, on the other hand, pose risks such as the generation of toxic gases like hydrogen sulfide, but they are soft and help suppress interface resistance. Solid oxide electrolytes are expected to be used in wearable devices and IoT power supplies, where safety and durability against temperature changes are essential. Solid sulfide electrolytes are highly anticipated for automotive batteries that require large currents, thanks to their high ionic conductivity and low interface resistance.
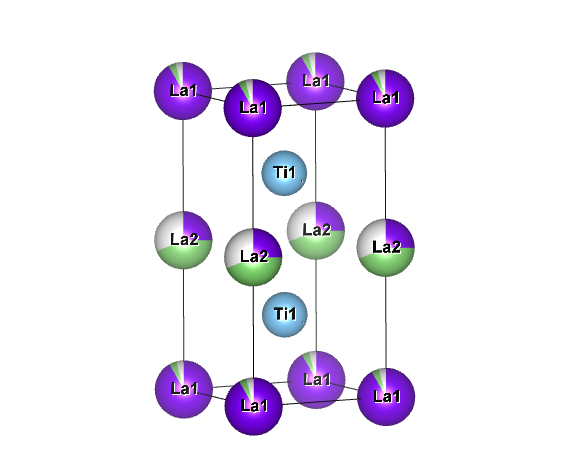
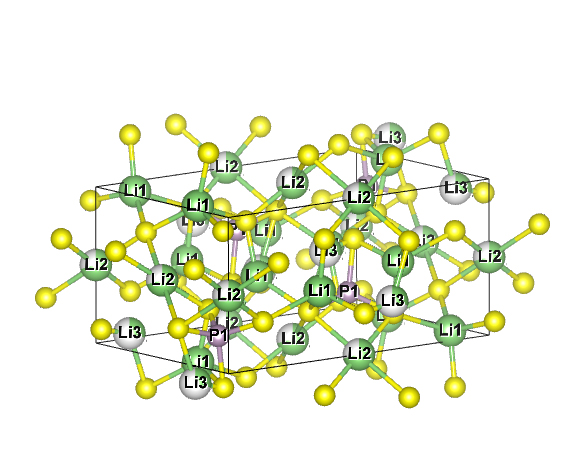
Solid Oxide Electrolyte : LLTO
refer to :J.Appl.Cryst.(2011).44,1272-1276
Solid Sulfide Electrolyte : Li3PS4
refer to :J.Appl.Cryst.(2011).44,1272-1276
Analysis example of solid electrolyte
Ion
conductivity and
diffusion
coefficient
There are fundamental differences between solid electrolytes and liquid electrolyte solutions. Their ionic conductivities also differ significantly. In an electrolyte solution, ions can move freely without restriction. In contrast, ions in solid electrolytes are coupled with surrounding ions and cannot move unless the binding is overcome by thermal energy.
Therefore, solid electrolytes generally exhibit lower ionic conductivity compared to liquid electrolytes. Moreover, for ions to migrate in a solid, vacancies or defects--sites in the crystal structure where ions are absent--are necessary. Ions move to nearby defects facilitated by thermal energy, so the greater the number of defects in the crystal, the higher the ionic conductivity.
For solid electrolytes used in solid-state batteries, achieving high ionic conductivity comparable to that of liquid electrolytes is highly desirable. Consequently, extensive research and development focus on various material compositions and structures, particularly for sulfides and oxides.
Several methods exist to evaluate ionic conductivity. The AC impedance method measures resistance and sample thickness. Nuclear Magnetic Resonance (NMR) can evaluate the self-diffusion coefficient and activation energy of ions. Other techniques include X-ray absorption spectroscopy with wide-area microstructure analysis using synchrotron radiation, and neutron scattering methods. Among these, NMR is advantageous for laboratory-level measurements.
JEOL's NMR systems feature dedicated probes capable of measuring slow diffusion processes, with sensitivity down to diffusion coefficients on the order of 10-14 m²/s.
Below is an example of activation energy measurement for powder and single crystal samples of the oxide solid electrolyte LLTZO. The left figure shows the NMR signal intensity plotted against magnetic field gradient for a single crystal sample, from which the lithium ion self-diffusion coefficient (D) is derived. The right figure shows an Arrhenius plot of D at different temperatures, from which the activation energy for ion diffusion is obtained.
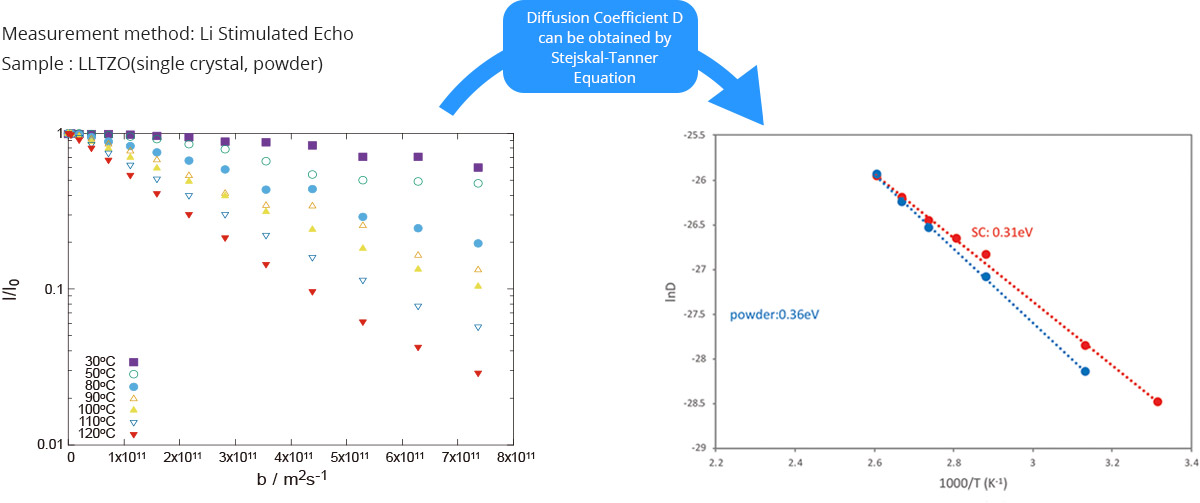
Temperature dependency of diffusion plot (left) and activation energy of ion diffusion movement(Arrhenius pot of diffusion coefficient D)(right)
A movie introducing solid electrolyte analysis by NMR is available.
Click the play button in
the box
above, and the movie starts. (4 min 39 sec).
Solid Electrolyte Analysis
Analysis of evolved
gas by TG-MS
Solid sulfide electrolytes used in solid-state batteries undergo hydrolysis when exposed to trace amounts of moisture, generating hydrogen sulfide and other gases. Understanding the trace gases evolved from battery materials during charging and discharging greatly contributes to improving the quality and safety of solid-state electrolytes.
Analysis of evolved gases involves measuring the species of gases released by heating the residual components in solid materials. The most commonly used technique is TG-MS, which combines thermogravimetry (TG) and mass spectrometry (MS).
In TG-MS, a sample is heated in a thermogravimetric analyzer to vary its temperature while simultaneously observing weight changes and endothermic/exothermic reactions. Meanwhile, the gaseous components released from the sample are analyzed by MS in near real time.
For MS data analysis, a 2D plot with mass and time as horizontal axes and intensity as the vertical axis allows the analysis of gas components generated over time (Figure 1). In TG measurements, the horizontal axis corresponds to temperature. By combining these two methods, TG-MS can determine the temperature at which any gas of a given mass evolves. In this example, a solid electrolyte was analyzed by TG-MS to study both its weight change and the evolved gas species (Figure 2).
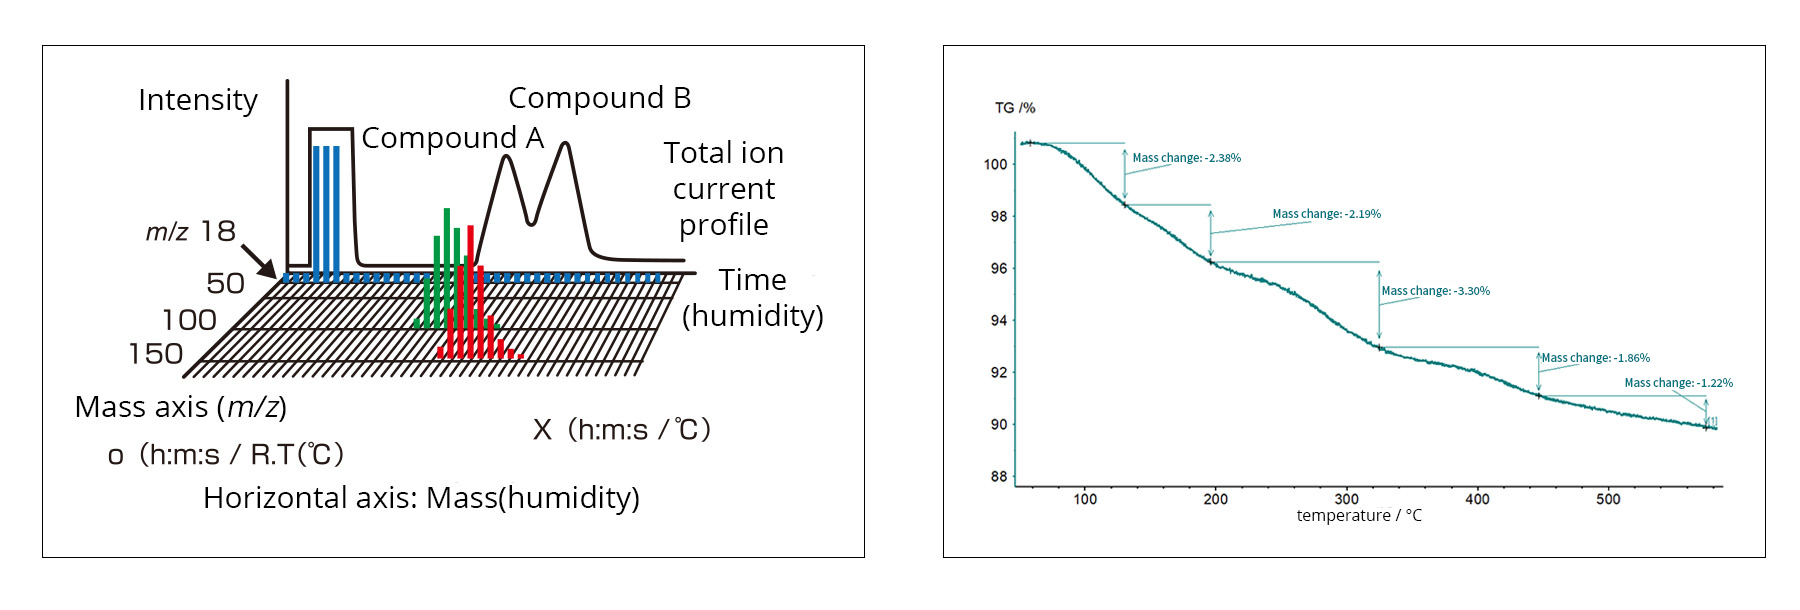
Fig. 1: MS data (left) and TG data (right)
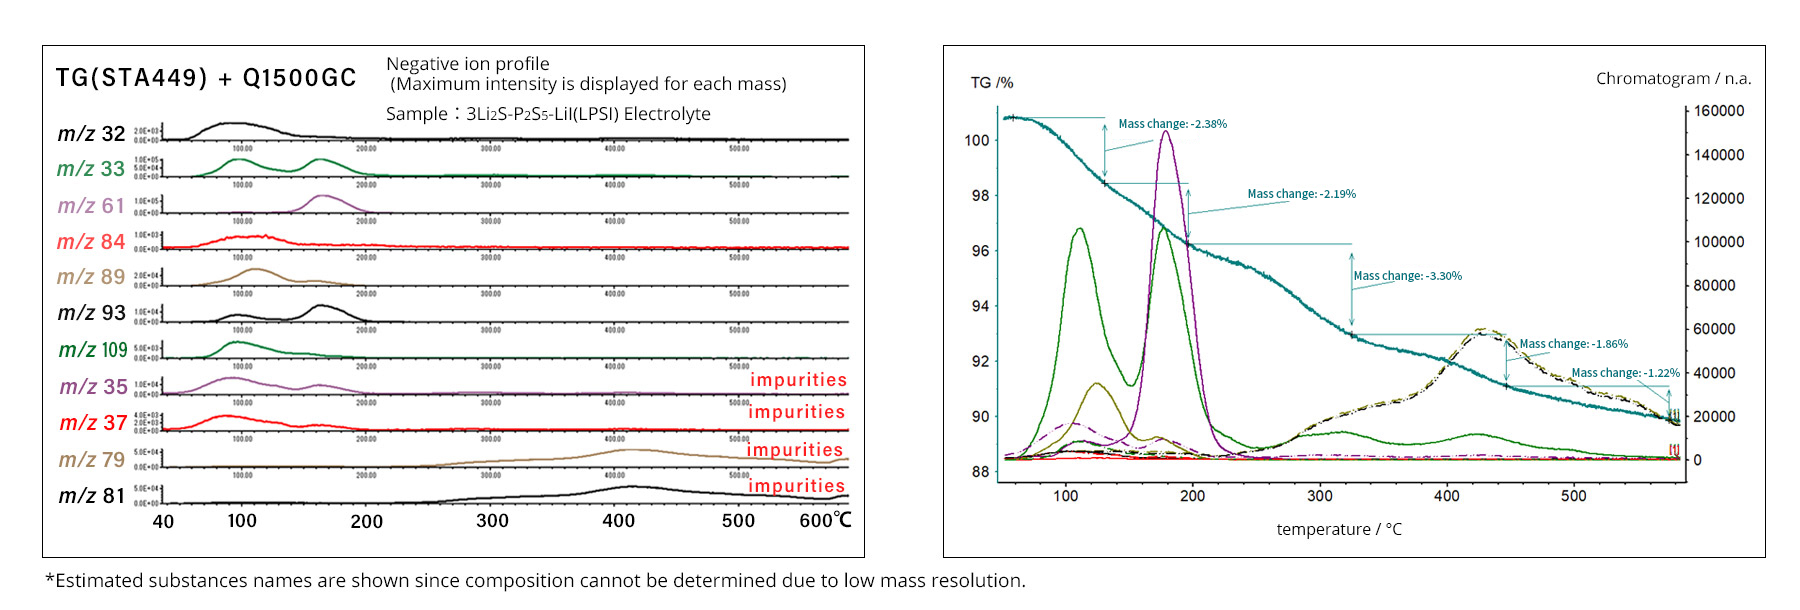
Figure 2: Intensity by temperature by mass (left) and data combined with TG (right)
Sample courtesy:
Prof. Atsunori Matsuda
Department of
Electrical and
Electronic Information Engineering
Toyohashi University of Technology
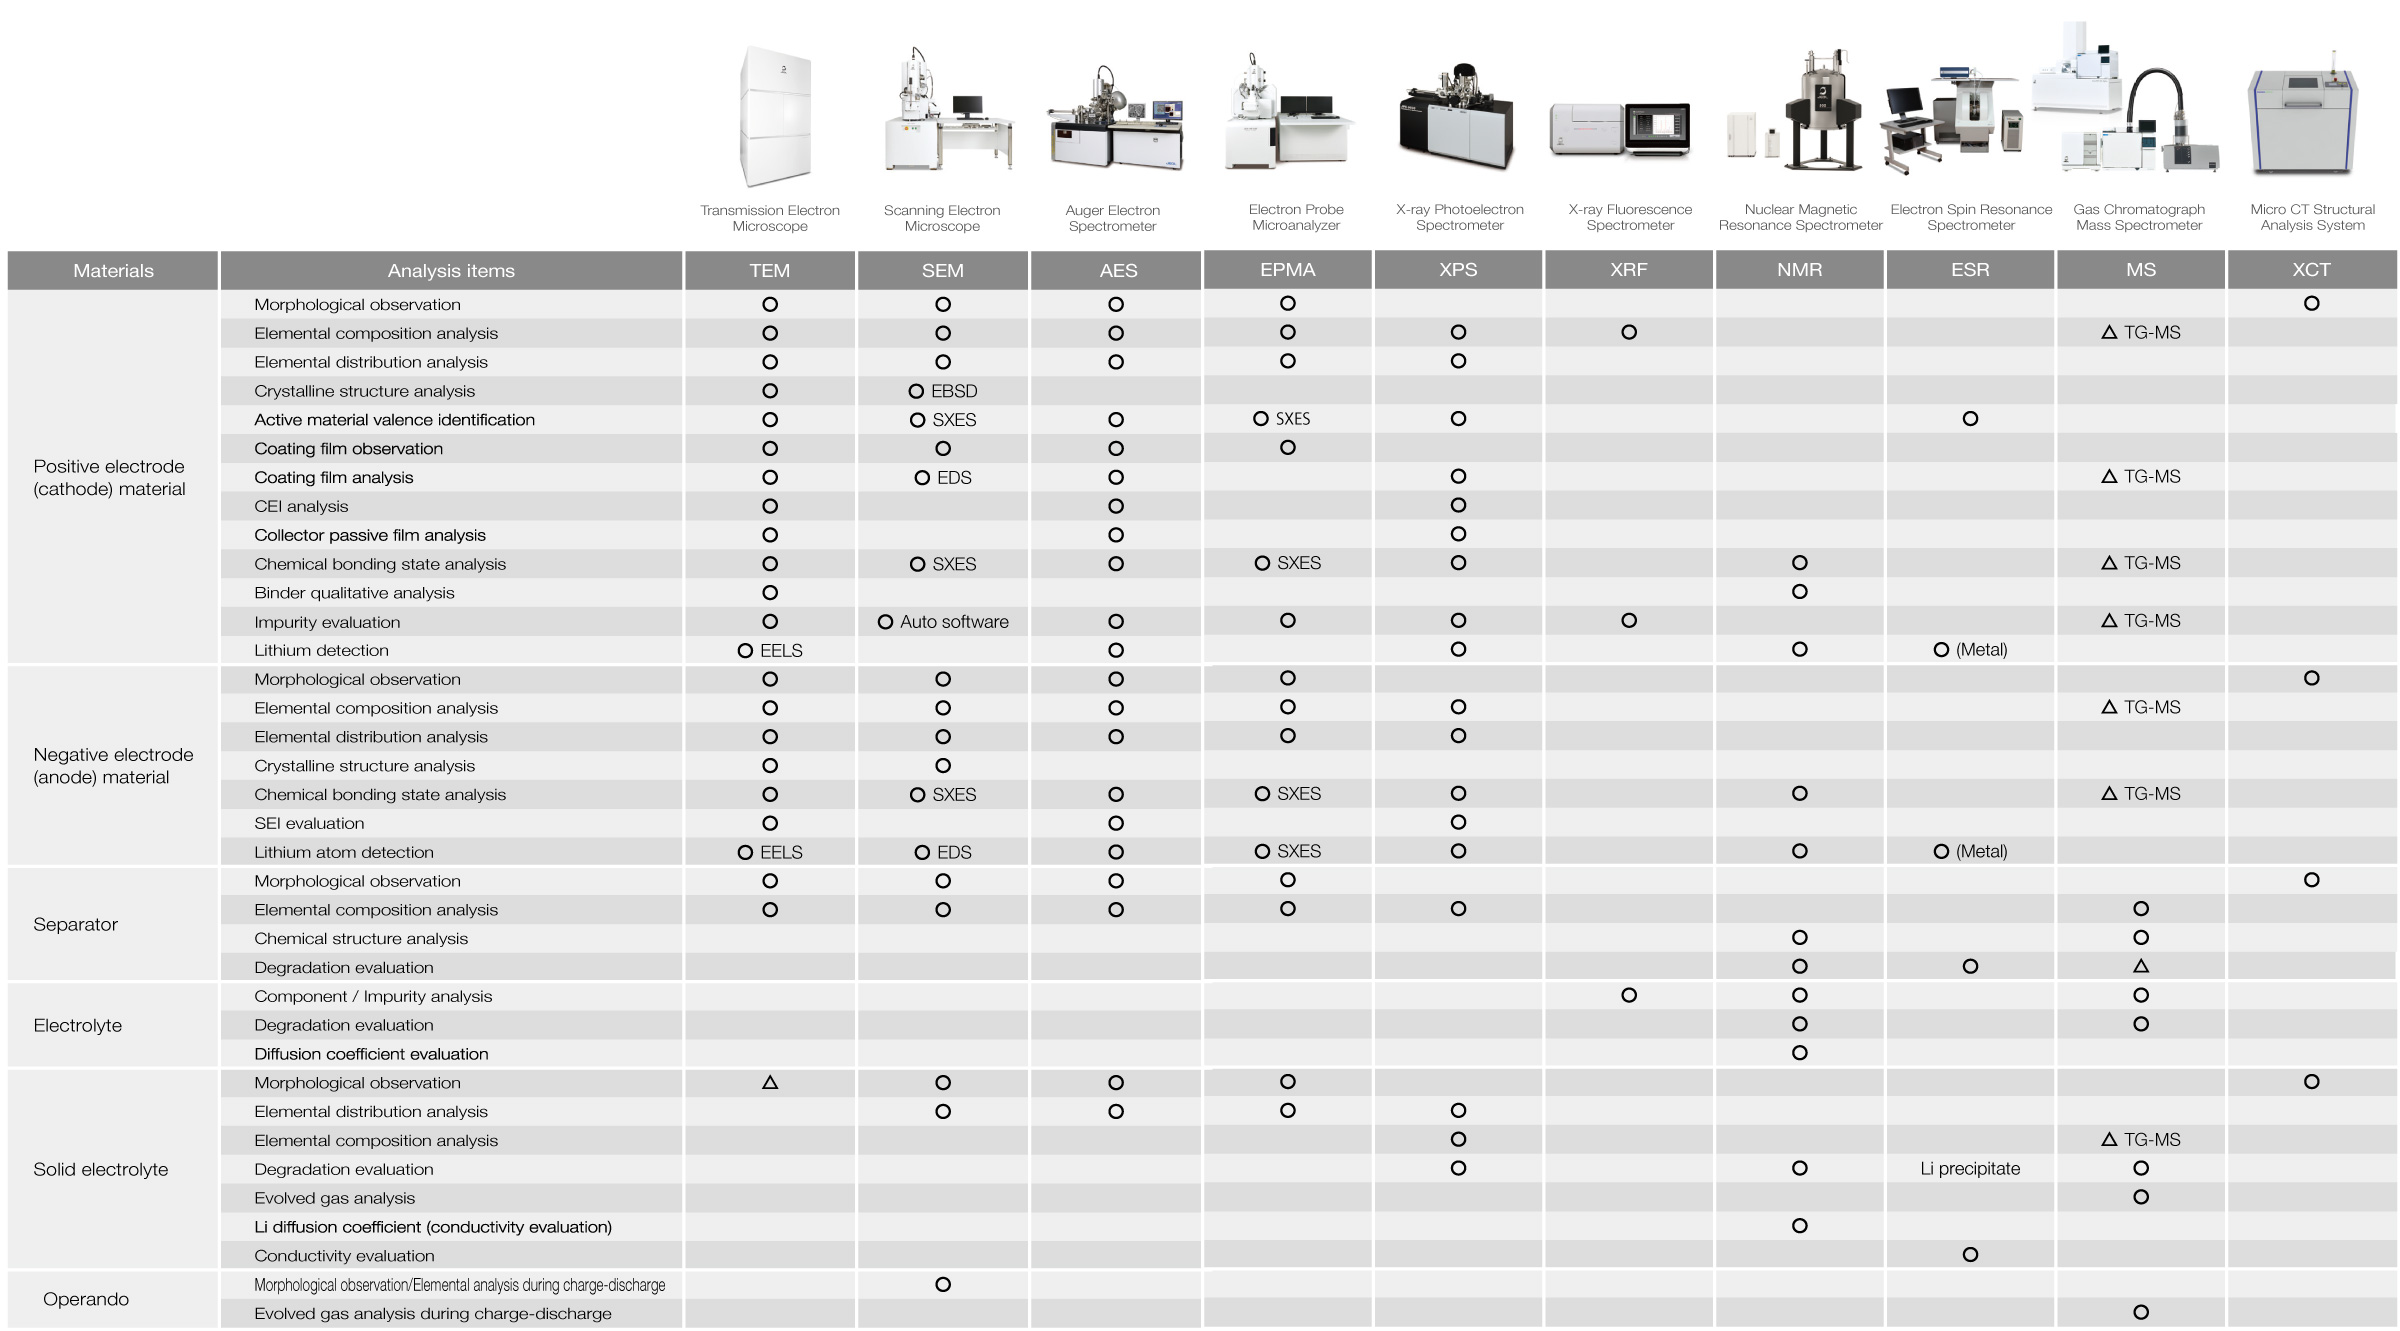
Lithium Ion Batteries (LIB) Analysis Items and Corresponding Instruments of JEOL
The table below shows JEOL's instruments for the applications according to the purpose of analysis/evaluation. For more information on their applications, please refer to catalogs and technical materials for each instrument or contact JEOL.
Importance of air-isolation transfer in battery analysis
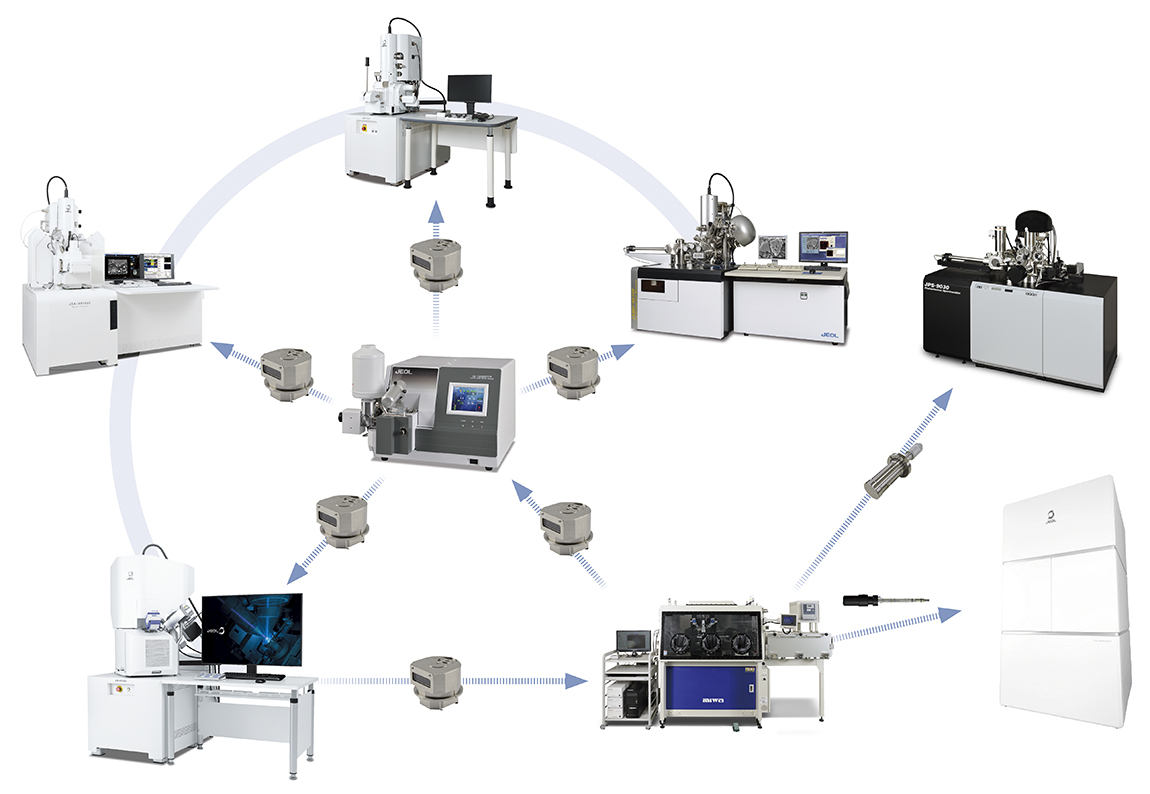
Materials used in batteries are using highly reactive lithium. The risk of modification exists when exposed to air. An air-isolation environment such as a dry room is required during manufacturing, and analysis of materials needs specimen preparation/observation/analysis in an air-isolated environment. The air-isolated instrument and system linked between different analysis instruments are effective for lithium ion batteries.
JEOL's instrument line-up establishes the system allowing processing, observation, and analysis in an air-isolated environment.
Click the button below to return to Battery TOP
Contacts
JEOL provides a variety of support services to ensure that our customers can use our products with peace of mind.
Please feel free to contact us.