Qualitative and Comparative Analyses of Impurities in Isopropanol using Two Different GC Columns
MSTips No.513
General
Isopropanol (IPA), for its superior solubility and volatility, is playing an indispensable role as a cleaning agent or solvent in the semiconductor industry. Quality control of high purity IPA products directly determines the stability of fabrication processes and the performance of resulting devices, making it necessary to detect and identify trace impurities contained. Because varying impurity compositions among IPA products, which are produced and refined differently, are likely to affect microstructure formation in semiconductor fabrication processes, comparative analysis of different compositions is in increasing demand.
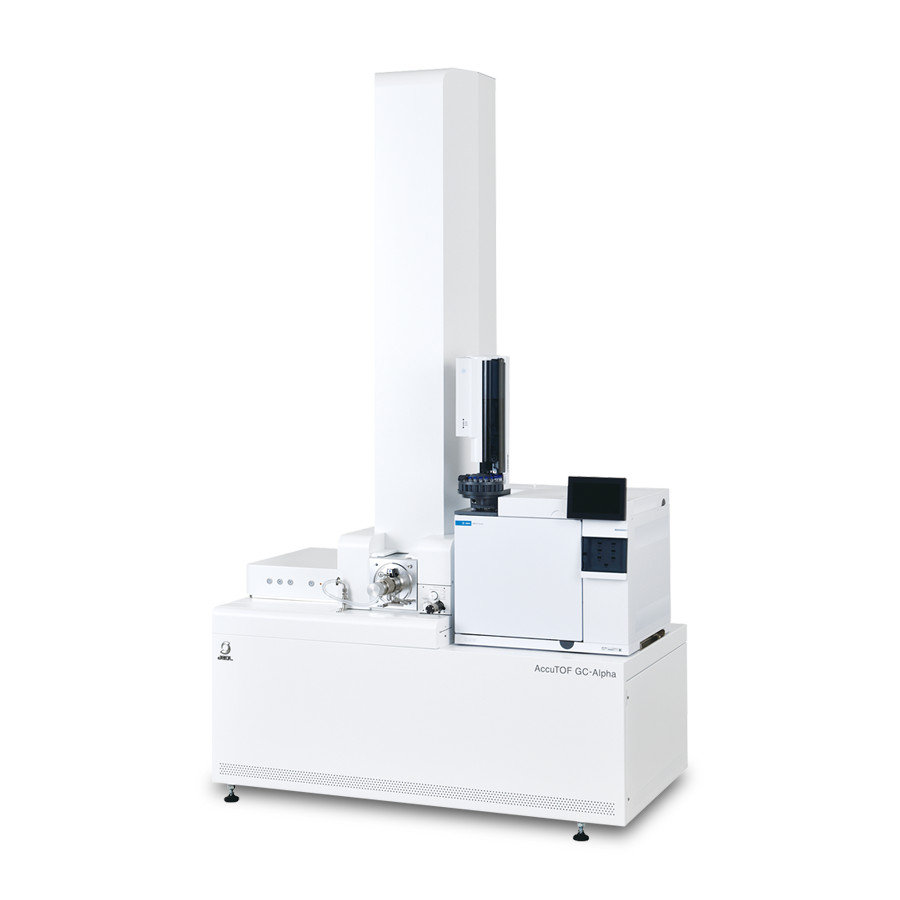
In this work, we conducted a comprehensive analysis of impurities contained in two different commercial IPA products, using a JMS-T2000GC, one of JEOL’s gas chromatography-high resolution mass spectrometers (GC-HRMS). We also used two different GC columns to identify impurity components to examine polarities and diverse molecular structures of the compounds.
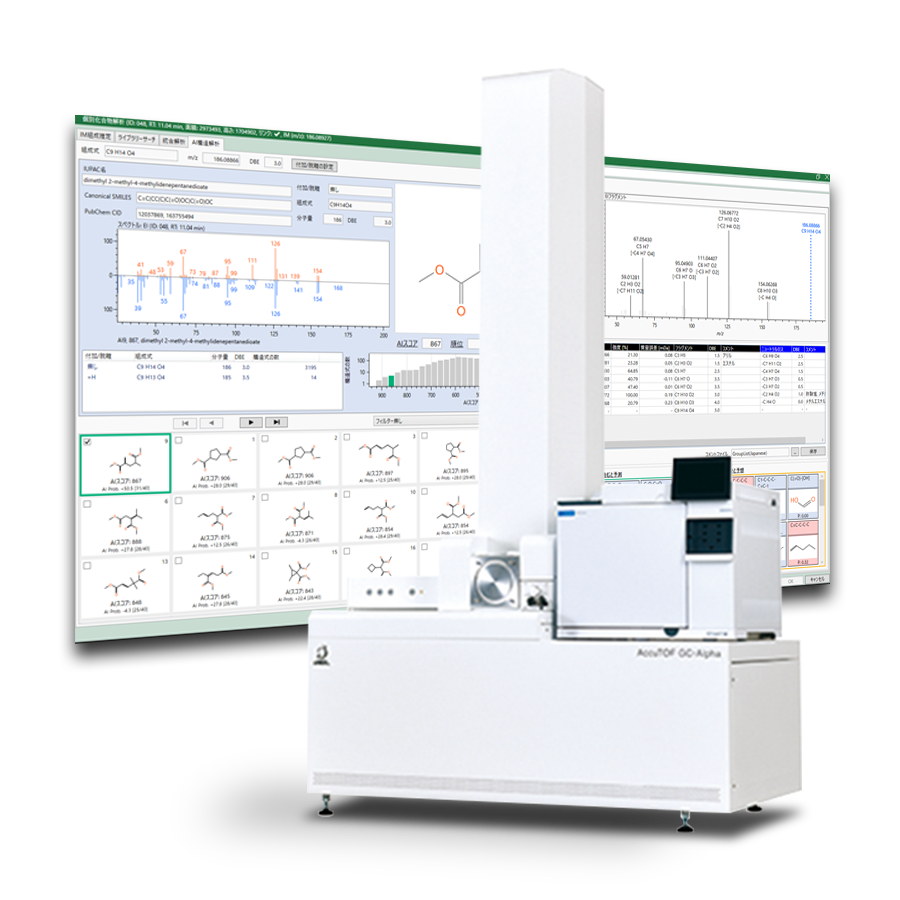
Our objective is to prove the effectiveness of the JMS-T2000GC combined with its qualitative analysis software, msFineAnalysis AI, in qualitative analysis of trace organic impurities contained in different IPA samples, so that we can contribute to enhancing the performance level of solvent quality control in semiconductor fabrication.
Experiment
Two unopened commercial IPA products (≥99.5%) were used as samples. Sample A was stored in a glass vessel with molecular sieves; sample B was stored in a glass vessel without sieves.
As a GC column, Rtx-BAC PLUS1 and Stabilwax-MS were used because polarity components similar to IPA were expected to be impurities. EI and FI (Field Ionization) were used as ionization methods. msFineAnalysis AI was subsequently used for analysis of the acquired data. Table 1 shows the measurement conditions.
Results and Discussion
Figure 1 shows the total ion current chromatograms (TICCs) obtained with GC column 1 and GC column 2. In the figure, the TICC of Sample A is marked by blue while the TICC of Sample B is marked by red respectively, showing the compound structures estimated by msFineAnalysis AI. The compound structures framed in red were estimated by the AI database because their formulas predicted from the molecular ions did not agree with the results of NIST compound search.
Water and low alcohols were detected when GC column 1 was used while apolar compounds such as carbon disulfide and n-hexane and polar compounds such as acetone, aldehyde, and carbonic acid were detected when GC column 2 was used.
Table 1. Measurement and analysis conditions
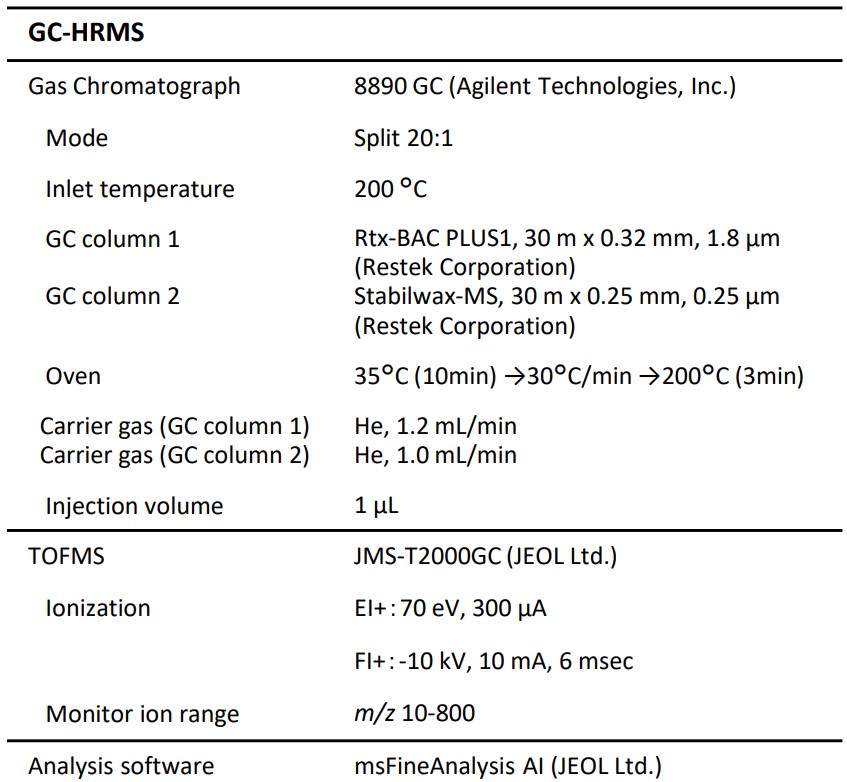
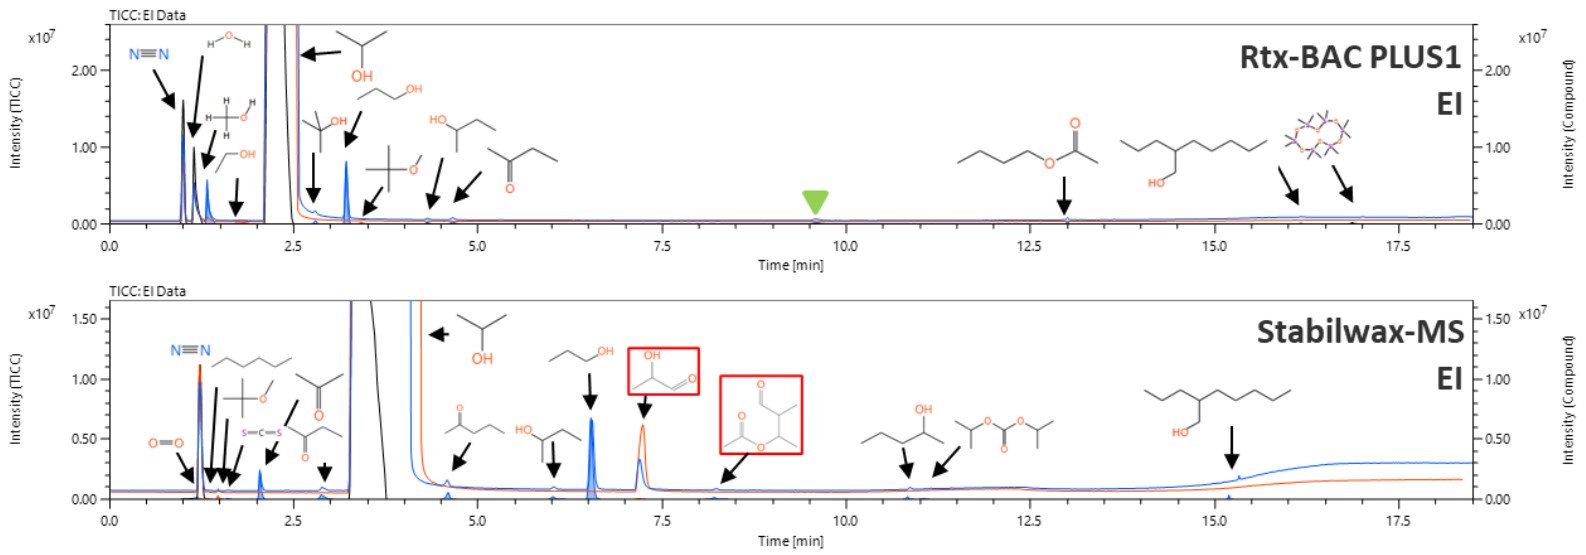
Figure 1 . EI TICCs of IPA using different GC columns
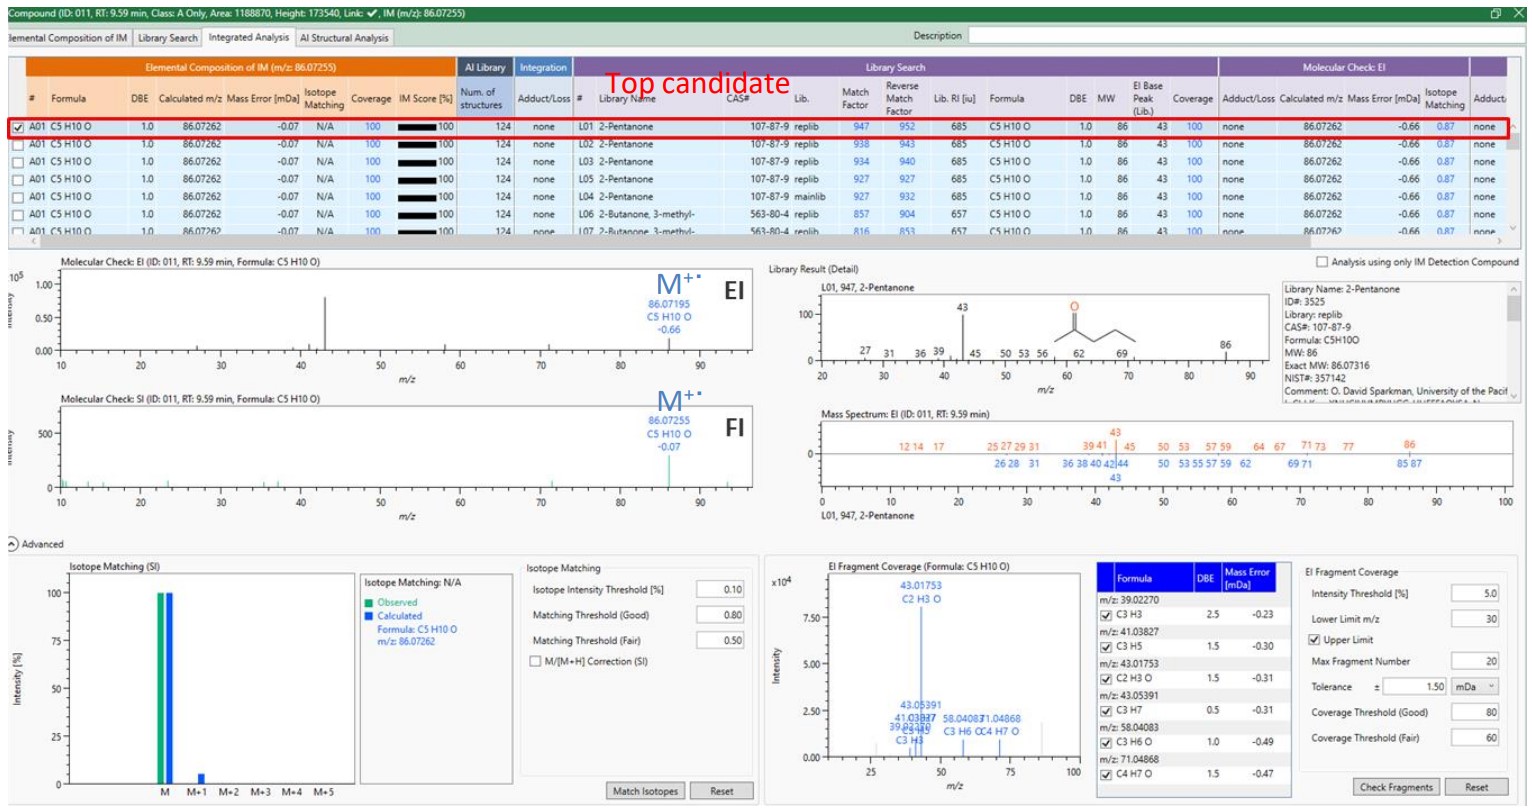
Figure 2. EI and FI mass spectra of the component at a retention time of 9.59 minutes
Figures 2 shows the mass spectrum and predicted formula of the peak marked by ▼ in Figure 1, which was detected at a retention time of 9.59 minutes.
In Figure 2, the EI mass spectrum mostly detected a fragment ion while the FI mass spectrum detected a molecular ion as a base peak. The exact mass of the molecular ion detected suggested C5H10O as its chemical formula. The suggested chemical composition of the major EI fragment ion was also consistent to the chemical formula of the molecular ion. The NIST database search resulted in 2-pentanone as the highest degree of similarity. msFineAnalysis AI presented 2-pentanone as a compound candidate because the chemical composition of 2-pentanone agrees with the chemical composition calculated from the exact mass.
Figure 3 shows the volcano plots of the results from the GC columns. In Sample A, a number of impurities were identified, including 2-propylheptanol, carbon disulfide, methanol, and 1-propanol, dimethylsiloxane. In Sample B, tert-butyl ether, ethanol, and n-hexane were specifically identified. The water content of the samples was more or less the same because the products were unopened.
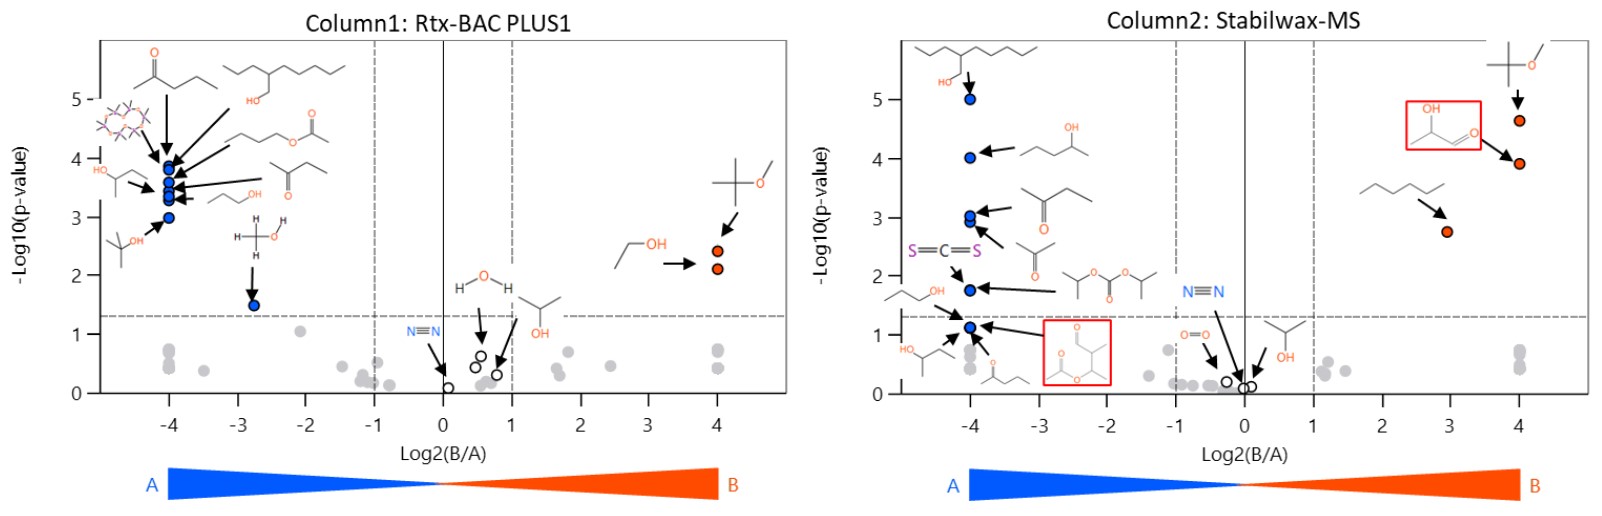
Figure 3. Volcano plots using different GC column data
Summary
The results of this work suggest that the IPA products, although comparable in purity, are likely to produce different residual impurities as long as they are manufactured, refined, and stored in different manners. msFineAnalysis AI is a powerful tool for qualitative analysis, capable of predicting chemical formula and structure while saving time and labor. The JMS-T2000GC combined with msFineAnlaysis AI is expected to contribute to improving overall solvent quality control because identifying solvent impurities is effective in selecting refining methods to elevate the purity level at process steps.
Solutions by field
Related products
Are you a medical professional or personnel engaged in medical care?
No
Please be reminded that these pages are not intended to provide the general public with information about the products.