Differential Analysis of Aroma Compounds in Red Wines from Different Regions Using GC-O-TOFMS
MSTips No. 502
Introduction
Food flavor compounds are important elements of good taste, while off-flavor compounds, such as rancid odors, significantly affect food quality. Gas chromatography-mass spectrometry (GC-MS) is widely used for the analysis of food aroma compounds, as it is well-suited for separating and detecting highly volatile compounds in complex mixtures.
Furthermore, gas chromatography-olfactometry mass spectrometry (GC-O-MS) enables simultaneous sensory evaluation by human olfaction and chemical identification via mass spectrometry (MS), making it an effective method for elucidating the sensory contributions of aroma components.
In qualitative GC-MS analysis, compound identification is commonly performed by library searching using commercially available electron ionization (EI) mass spectral databases, such as the NIST database (DB). However, not all compounds are registered in the NIST DB. To determine the molecular formulas of unknown compounds that are not listed in the database, we propose an “integrated analysis”1) approach that combines electron ionization (EI) and soft ionization (SI) data obtained using time-of-flight mass spectrometry (TOFMS). Furthermore, by using automated structure analysis software called “msFineAnalysis AI” which uses artificial intelligence (AI) to predict EI mass spectra from chemical structures2), it is possible to estimate the structural formula.
Therefore, in this MSTips, we report on the measurement of aroma components in red wine using GC-O-TOFMS with headspace solid-phase microextraction (HS-SPME), along with the analysis results obtained using msFineAnalysis AI.
Experimental
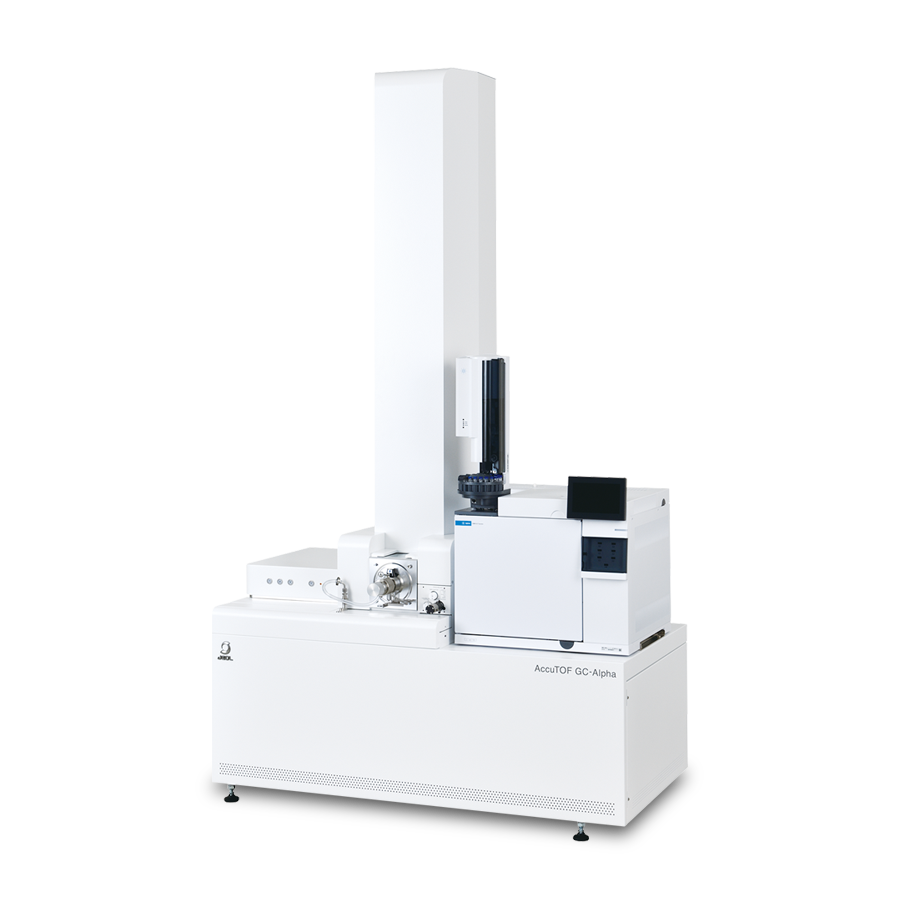
Commercial red wines produced in Tuscany, Italy (vintage 2022), and Bordeaux, France (vintage 2018), were used as samples. A 10 mL aliquot of each red wine transferred into a 20 mL headspace vial, which was then sealed (Figure 1).The SPME mode of the HT2850T autosampler (HTA S.R.L.) was used as the sample preparation device, and volatile components in the headspace area of the vials were targeted for the measurement. A sniffing port (OP275 Pro II, GL Sciences Inc.) and a GC-TOFMS system (JMS-T2000GC AccuTOF™ GC-Alpha, JEOL Ltd.; Figure 2) were used for the measurements. GC-O measurements were conducted twice for each sample by a panelist who was able to accurately identify the reference odor (from Daiichi Yakuhin Kogyo Co., Ltd.) used for panel selection. We performed GC-MS measurements using both EI and Field Ionization (FI) modes with a combination EI/FI ion source. The analysis used measurement data obtained by EI (n = 3) and FI (n = 1).The qualitative data processing was performed with msFineAnalysis AI (JEOL Ltd.). Detailed measurement conditions are shown in Table 1.

Figure 1 Red wine samples

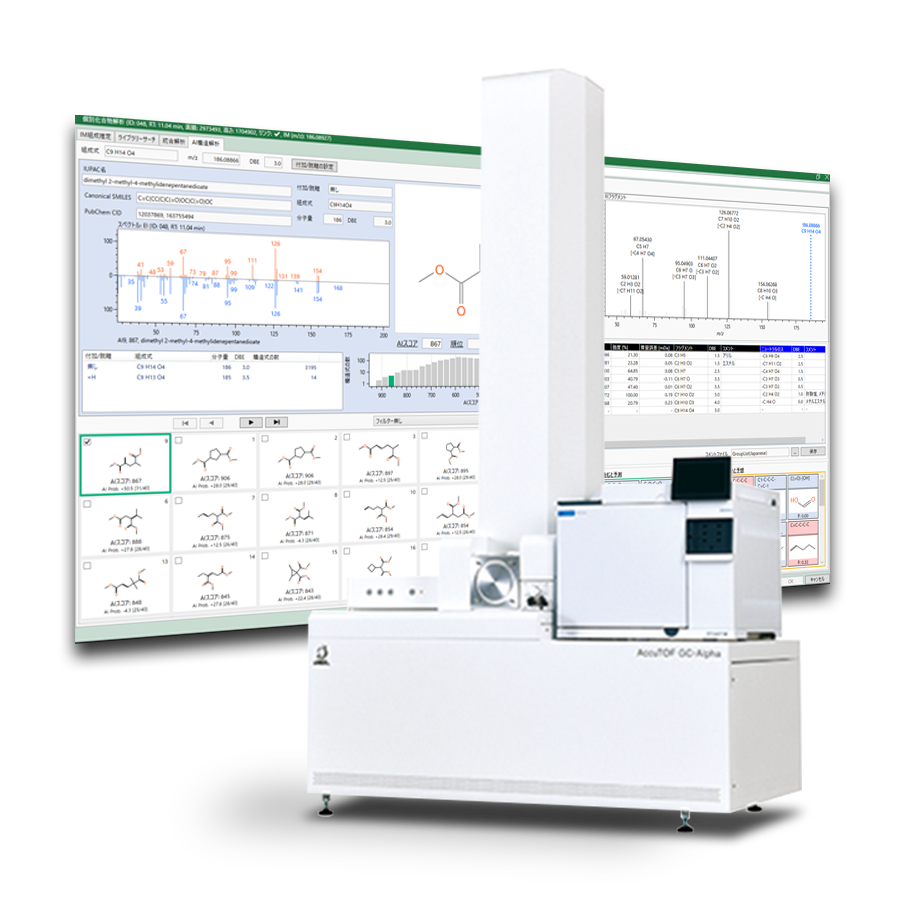
Figure 2 JMS-T2000GC with HT2850T autosampler
Table 1 Measurement condition

Results and Discussion
TICC and differential analysis result
Figure 3 presents the total ion current chromatogram (TICC) obtained from EI data, along with annotations for the six most intense compounds. High intensities of aroma compounds were detected such as esters (e.g., Hexanoic acid, ethyl ester, Decanoic acid, ethyl ester), aromatic alcohols (e.g., Phenylethyl Alcohol).
Figure 4 shows volcano plot of differential analysis result. This visualization enabled the identification of both common and distinct components across the samples. Specifically, 15 compounds were characteristic of the French wine, 6 compounds were characteristic of the Italian wine, and 28 compounds were common to both. Detailed analysis of the characteristic components for each sample is provided in the following section.

Figure 3 Total ion current chromatograms of EI data

Figure 4 Volcano plot
Integrated qualitative analysis result of characteristic components of each sample
Table 2 and 3 shows the integrated qualitative analysis result of each sample (Table 2: French wine, Table 3: Italian wine). Compounds listed as “mainlib” or ‘replib’ in the “Lib.” column indicate compounds with a match factor of 700 or higher in the NIST database (DB) search. These results indicate that compounds detected in French wines include branched fatty acid esters such as butanoic acid, 2-methyl-, ethyl ester (ID: 011) and butanoic acid, 3-methyl-, ethyl ester (ID: 012), as well as compounds presumed to be terpene derivatives such as 2(1H)-naphthalenone, 3,4,4a,5,6,7-hexahydro-1,1,4a-trimethyl- (ID: 040). Branched fatty acid esters, which are characteristic of French wines, have been reported to be produced during the aging process.³) These are thought to be characteristic of this wine, which was produced in 2018.
On the other hand, linear fatty acid esters, presumably derived from yeast, were strongly detected in the Italian wine, which may reflect the characteristics of this wine, which was produced a short time ago.
Additionally, multiple unknown compounds (denoted as "AI" in the Lib." column) with match factors of less than 700 in the NIST DB search were detected in both samples. Of these, Figure 5 shows the top 18 candidates resulting from AI structure analysis of a compound (ID: 042) that was characteristic of French wine. The candidates included a wide variety of structures, but many were identified as being similar to lactones. Lactones are aroma compounds produced during the fermentation and aging processes. Fermentation-derived lactones (e.g., γ-butyrolactone) are found in young wines, while aging-derived lactones (e.g., oak lactone) are found in barrels and are found in mature wines.4⁾ As mentioned above, aroma components presumably derived from aging have been detected in French wines, and since compound ID:042 also contained many candidates showing lactone structures in the top rankings, it is highly likely that it is a lactone produced during aging.
Table 2 Characteristic compounds in French wine

Table 3 Characteristic compounds in Italian wine

Figure 5 AI structure analysis result of ID: 042
GC-O Analysis Result
GC-O measurements were performed twice for each sample, and the odor information and TICC data are integrated in Figure 6 (white: first measurement; color: second). For French wine, 24 aroma information were obtained in the first measurement and 23 in the second measurement. For Italian wine, 22 aroma information were obtained in the first measurement and 20 in the second r measurement. Reproducible results were obtained for both samples. Good reproducibility was obtained for both samples.
Next, we investigated the relationship between TICC peak intensity and odor intensity. Butanoic acid, 2-methyl-, ethyl ester (ID: 011) and butanoic acid, 3-methyl-, ethyl ester (ID: 012), which are components characteristic of French wines, were detected by GC-MS analysis as components unique to French wines, but were also detected in Italian wines. The TICC peak intensities of butanoic acid, 2-methyl-, ethyl ester (ID: 011) and butanoic acid, 3-methyl-, ethyl ester (ID: 012) were approximately 2.7-fold and 2.6-fold higher, respectively, in the French wine compared to the Italian wine, indicating notable differences in their abundance (Figure 7). In the GC-O analysis, butanoic acid, 2-methyl-, ethyl ester (ID: 011) exhibited a strong sweet aroma in both measurements of the French wine. In the Italian wine, it was perceived as a medium pineapple-like aroma in the first measurement and a weak sweet aroma in the second. In the GC-O analysis of butanoic acid, 3-methyl-, ethyl ester (ID: 012), the French wine exhibited a medium fruity aroma in the first measurement and a stronger sweet aroma than that of the previously mentioned compound in the second. In the Italian wine, the compound was perceived as a sweeter-than-pineapple aroma in the first measurement and a medium sweet aroma in the second.
These compounds tended to exhibit stronger aromas in the French wine, which was consistent with the higher TICC peak intensities observed in the GC-MS measurements (Figure 7).

Figure 6 Integration of TICC and odor information by GC-O analysis results

Figure 7 Peaks of Butanoic acid, 2-methyl-, ethyl ester and Butanoic acid, 3-methyl-, ethyl ester
Conclusions
In this MSTips, we analyzed differences in aroma compounds between red wines from different regions using GC-O-TOFMS and msFineAnalysis AI. The differential analysis suggested that the French wine was characterized by branched fatty acid esters, likely formed during aging, while the Italian wine contained linear fatty acid esters, presumably derived from yeast. In addition, AI structure analysis suggested the presence of a compound in the French wine that is presumed to be a lactone, which is not registered in the NIST DB. GC-O analysis also showed differences in aroma perception for butanoic acid, 2-methyl-, ethyl ester and butanoic acid, 3-methyl-, ethyl ester, in agreement with the GC-MS peak intensity data. These findings support the usefulness of GC-O-TOFMS and msFineAnalysis AI in the analysis of food aroma compounds.
Reference
1) M. Ubukata et al, Rapid Commun Mass Spectrom., 2020, 34, e8820.
2) A. Kubo et al, Mass Spectrom., 2023, 12, A0120.
3) M. C. Díaz-Maroto et al, J. Agric. Food Chem., 2005, 53, 3503–3509.
4) A. I. Pardo-Garcia et al, J. Agric. Food Chem., 2015, 63, 18, 4533–4538.
Solutions by field
Related products
Are you a medical professional or personnel engaged in medical care?
No
Please be reminded that these pages are not intended to provide the general public with information about the products.