Qualitative and Quantitative Analysis of Organic Acids in Urine by Gas Chromatography-High Resolution Mass Spectrometry with Hard Ionization and Soft Ionization
MSTips No. 477
Introduction
The test of urine organic acids is an essential component of the study of inherited metabolic diseases, such as inborn error of metabolism. Urine contains a variety of organic acids that forms through diverse sources, including normal and abnormal metabolism, drugs and drug metabolism, or even xenobiotics and dietary supplements. The gas chromatography - mass spectrometry (GC-MS), especially GC - single quadrupole MS(GC-QMS) is generally chosen for the analysis of urine organic acids. However, since GC-QMS lacks the ability to the accurate identification of organic acids in urine due to its complicated mixture especially when creating a new method, GC-high resolution MS (GC-HRMS) is a more qualified system instead.
JMS-T2000GC, a GC-HRMS system that incorporates a combination ion source of electron ionization (EI) and field ionization (FI), is capable of switching between the EI and FI modes without breaking the vacuum. The analysis of data acquired by the 2 ionization methods through msFineAnalysis AI software leads to the estimation of chemical structures as well as compositions, which is practical for the determination of compounds in organic acids.
In this work, the qualitative analysis of the chemical composition and structure of organic compounds in urine and the quantitative analysis of target organic acid using JMS-T2000GC with msFineAnalysis AI was executed.
Measurement
The organic acids as sample solutions were extracted from acidified urines by liquid–liquid extraction with ethyl acetate, followed by trimethylsilyl (TMS) derivatization to increase the volatility of organic acids. 1 μL of the sample solution was then injected in JMS-T2000GC by an autosampler. The msFineAnalysis AI software was used for the qualitative analysis and the Escrime™ software was used for quantitative analysis. The detailed GC-HRMS measurement conditions are presented in Table 1.
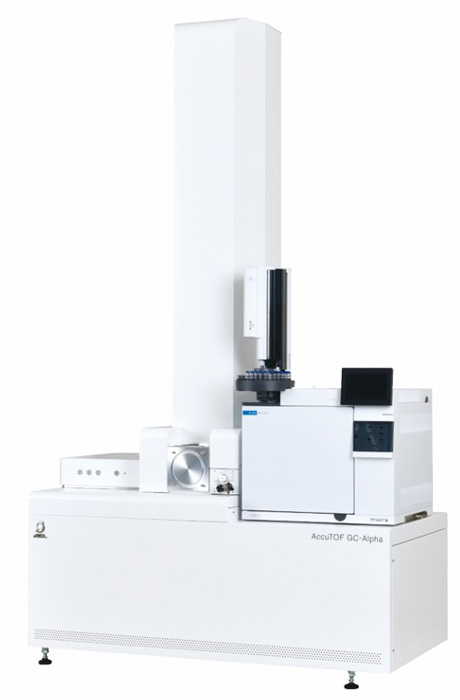
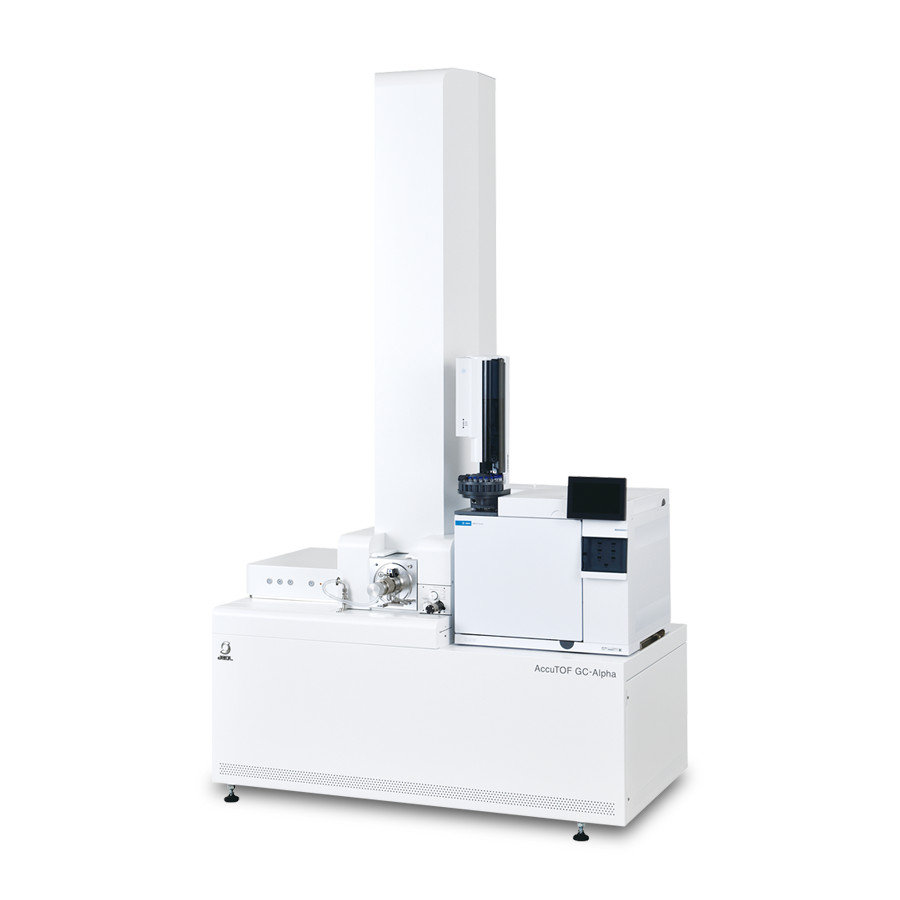
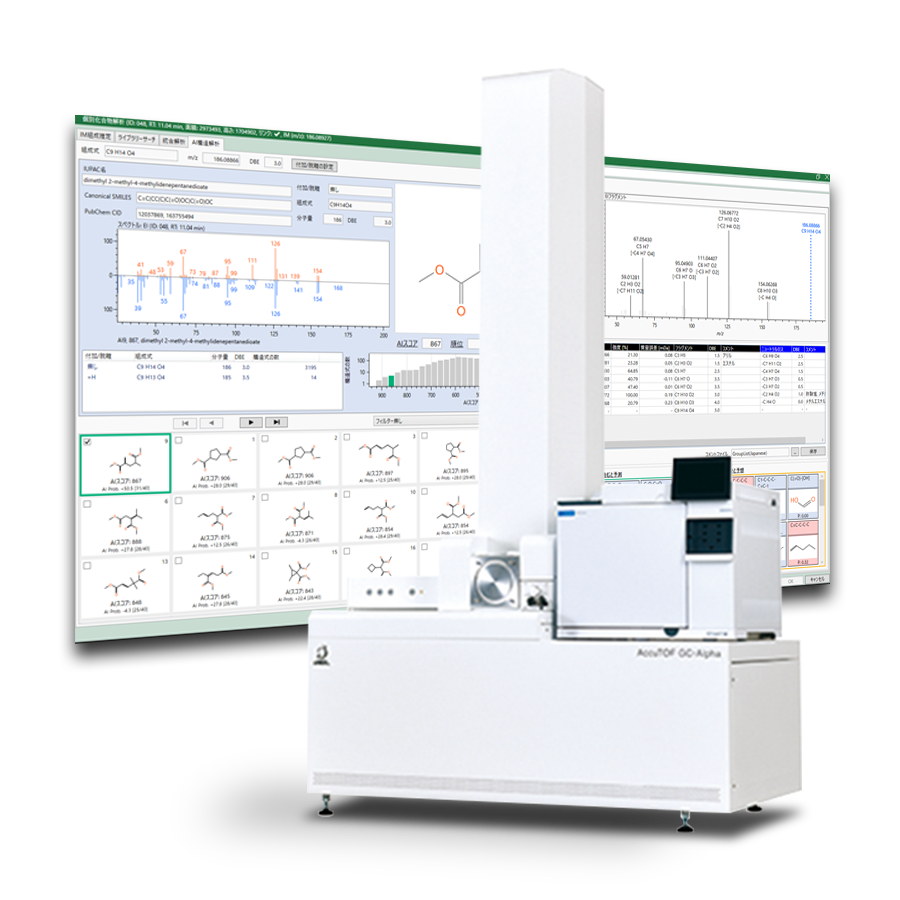
JMS-T2000GC "AccuTOF™ GC Alpha"
Table 1. Measurement conditions
| GC-HRMS | JMS-T2000GC (JEOL Ltd.) |
|---|---|
| GC inlet mode | Splitless |
| GC inlet temperature | 280°C |
| GC Column | DB-5MS, 30 m x 0.25 mm, 0.25 μm |
| GC Oven | 60°C (1 min) →10°C/min →300°C (3 min) |
| Carrier gas | He, 1.0 mL/min |
| MS Ionization | EI+: 70 eV, 300 μA FI+: -10 kV with JEOL 5 μm emitter (10 mA, 6 msec) |
| MS Monitor ion range | m/z 45-800 |
| Analysis software | Qualitative: msFineAnalysis AI (JEOL Ltd.) Quantitative: Escrime™ (JEOL Ltd.) |
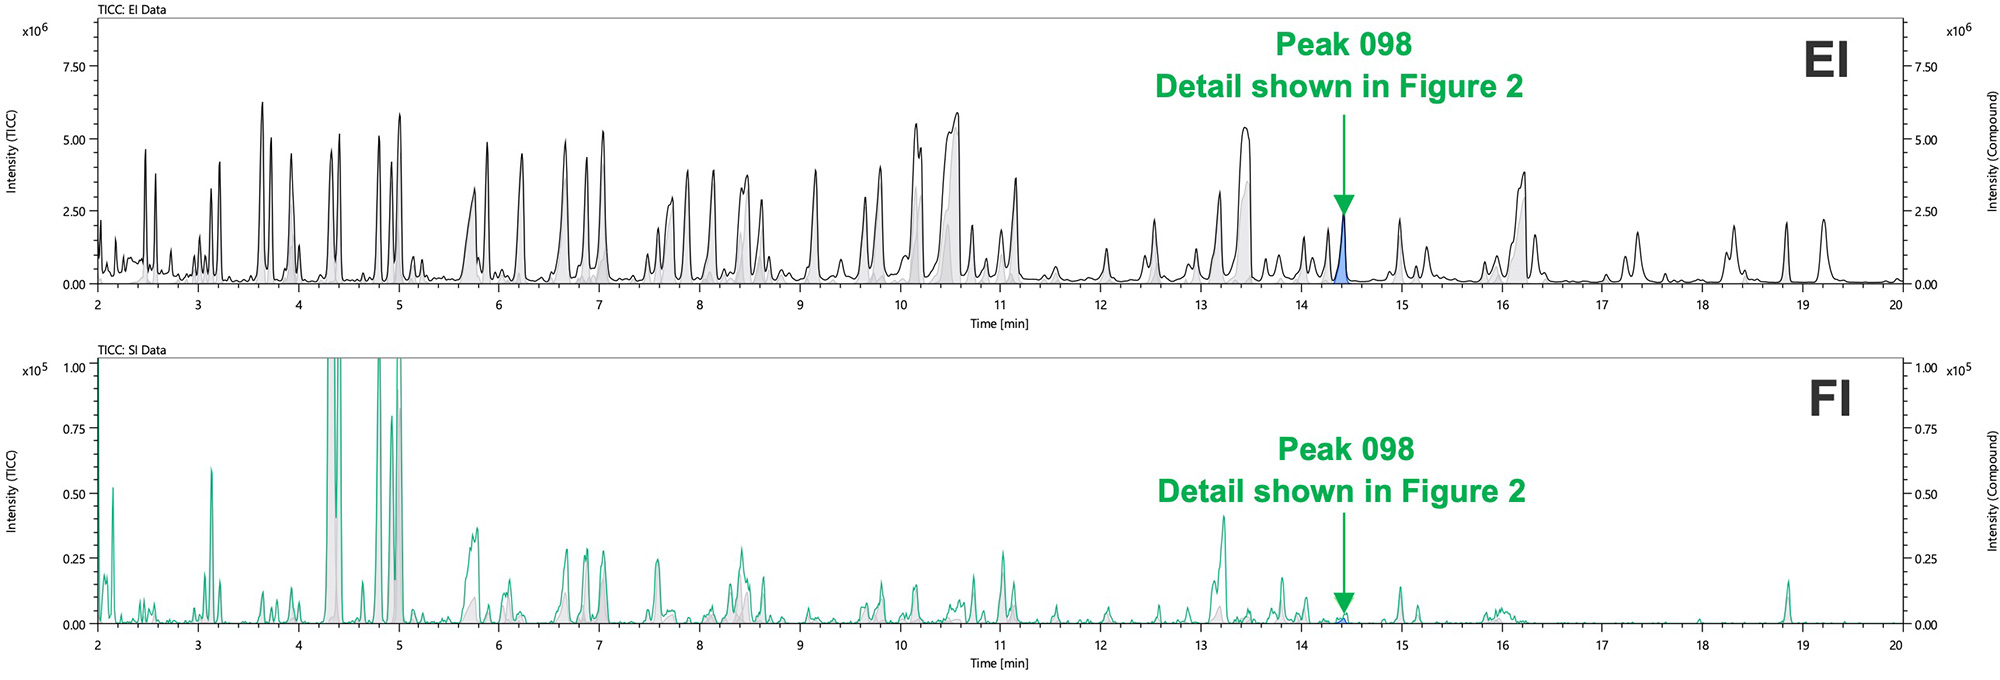
Figure 1. TICCs of a urine organic acid from sample (top: EI, bottom: FI)
Qualitative Analysis Results
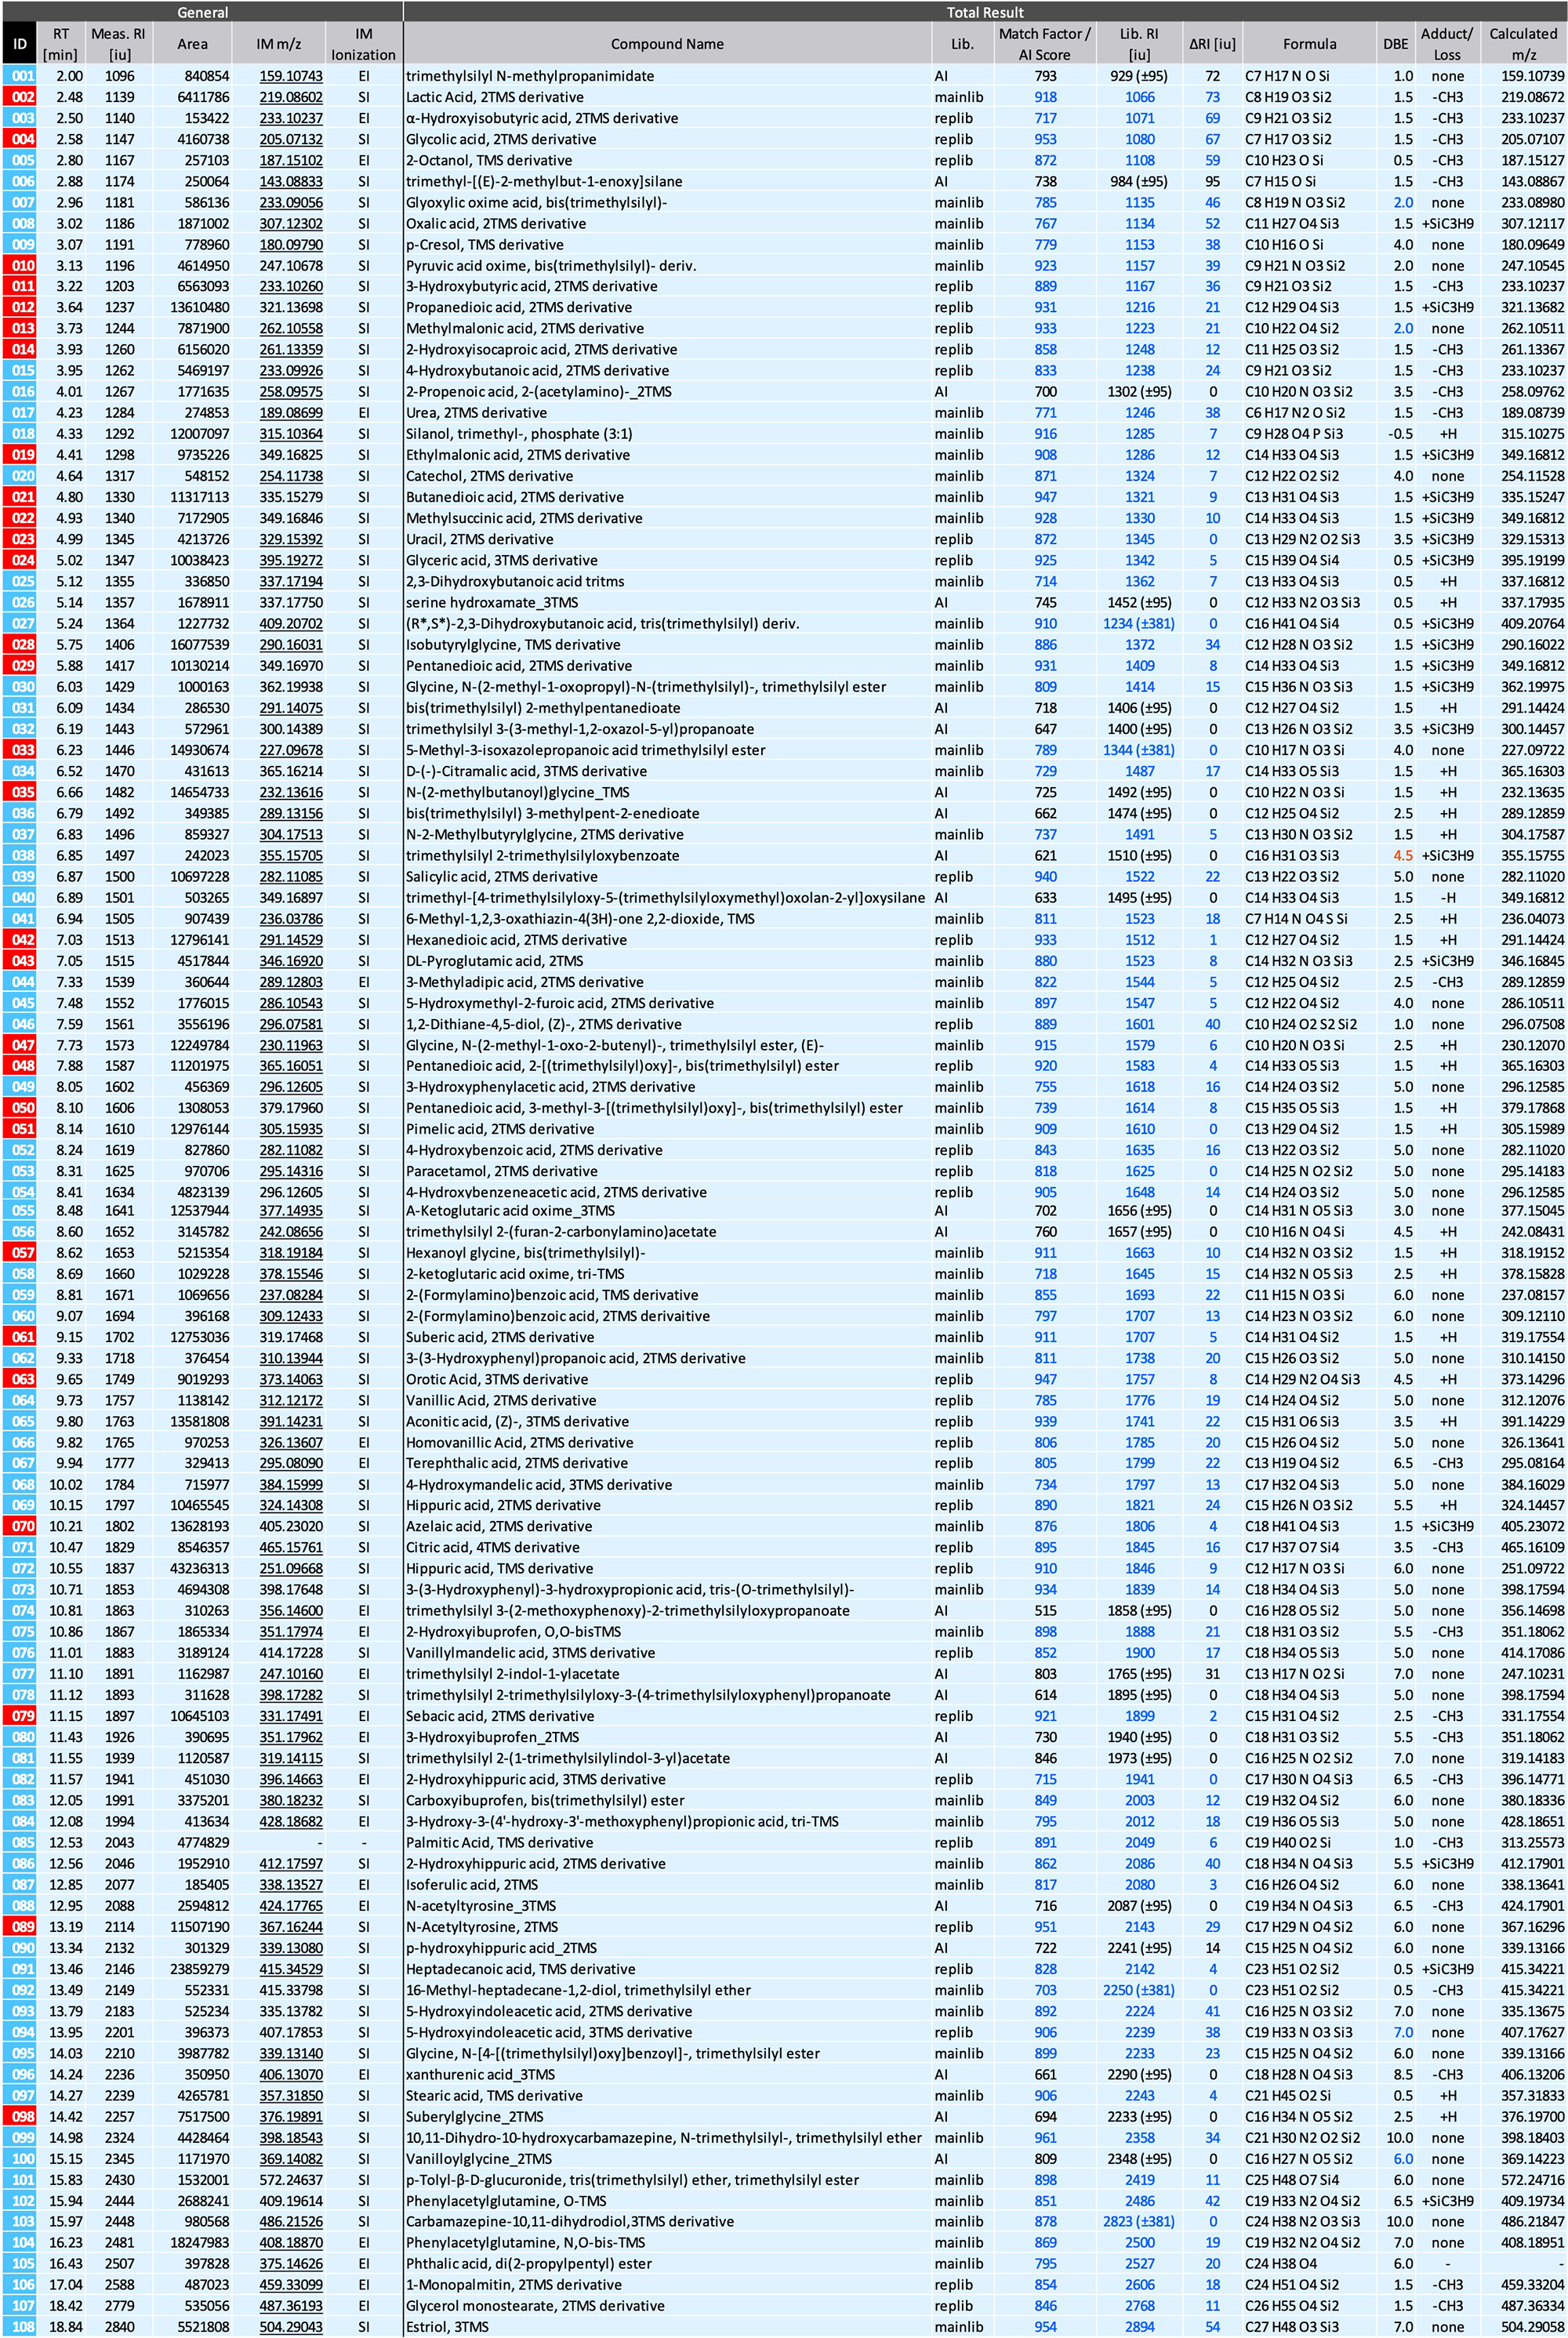
Figure 1 shows both the EI and FI total ion current chromatograms (TICCs) of urine organic acids from the sample, resulting in the detection of 108 compounds including 29 target organic acids, whose msFineAnlaysis AI analysis results are shown in red columns in Table 2. Peak [33] was assigned as 5-Methyl-3-isoxazolepropanoic acid trimethylsilyl ester, a TMS derivative compound from oximated succinyl acetone. Some co-eluted components due to the failure of chromatographically separation such as peak [023] and [024] were however detected separately by the deconvolution function of msFineAnalysis AI.
The results of both integrated analysis and AI structural analysis of peak[098] acquired by msFineAnalysis AI were shown in Figures 2 and 3 respectively. Molecular ion was not detected in the EI mass spectrum of Figure 2 while the [M+H]+ ion was detected in the FI mass spectrum, which implies the importance of the combination analysis of soft ionization methods. The chemical formula was estimated to be C16H34NO5Si2 from the exact mass of the detected [M+H]+ ion, which did not match the estimated chemical composition from the molecular ion or the candidate compound from the NIST database search results. However, msFineAnalysis AI obtained an AI library that contains plenty of EI mass spectra of compounds which are not registered in the NIST database, and compounds that match the chemical composition estimated from the molecular ion and have a matching EI fragment ions pattern were shown as candidates in the search result of AI library (Figure 3).
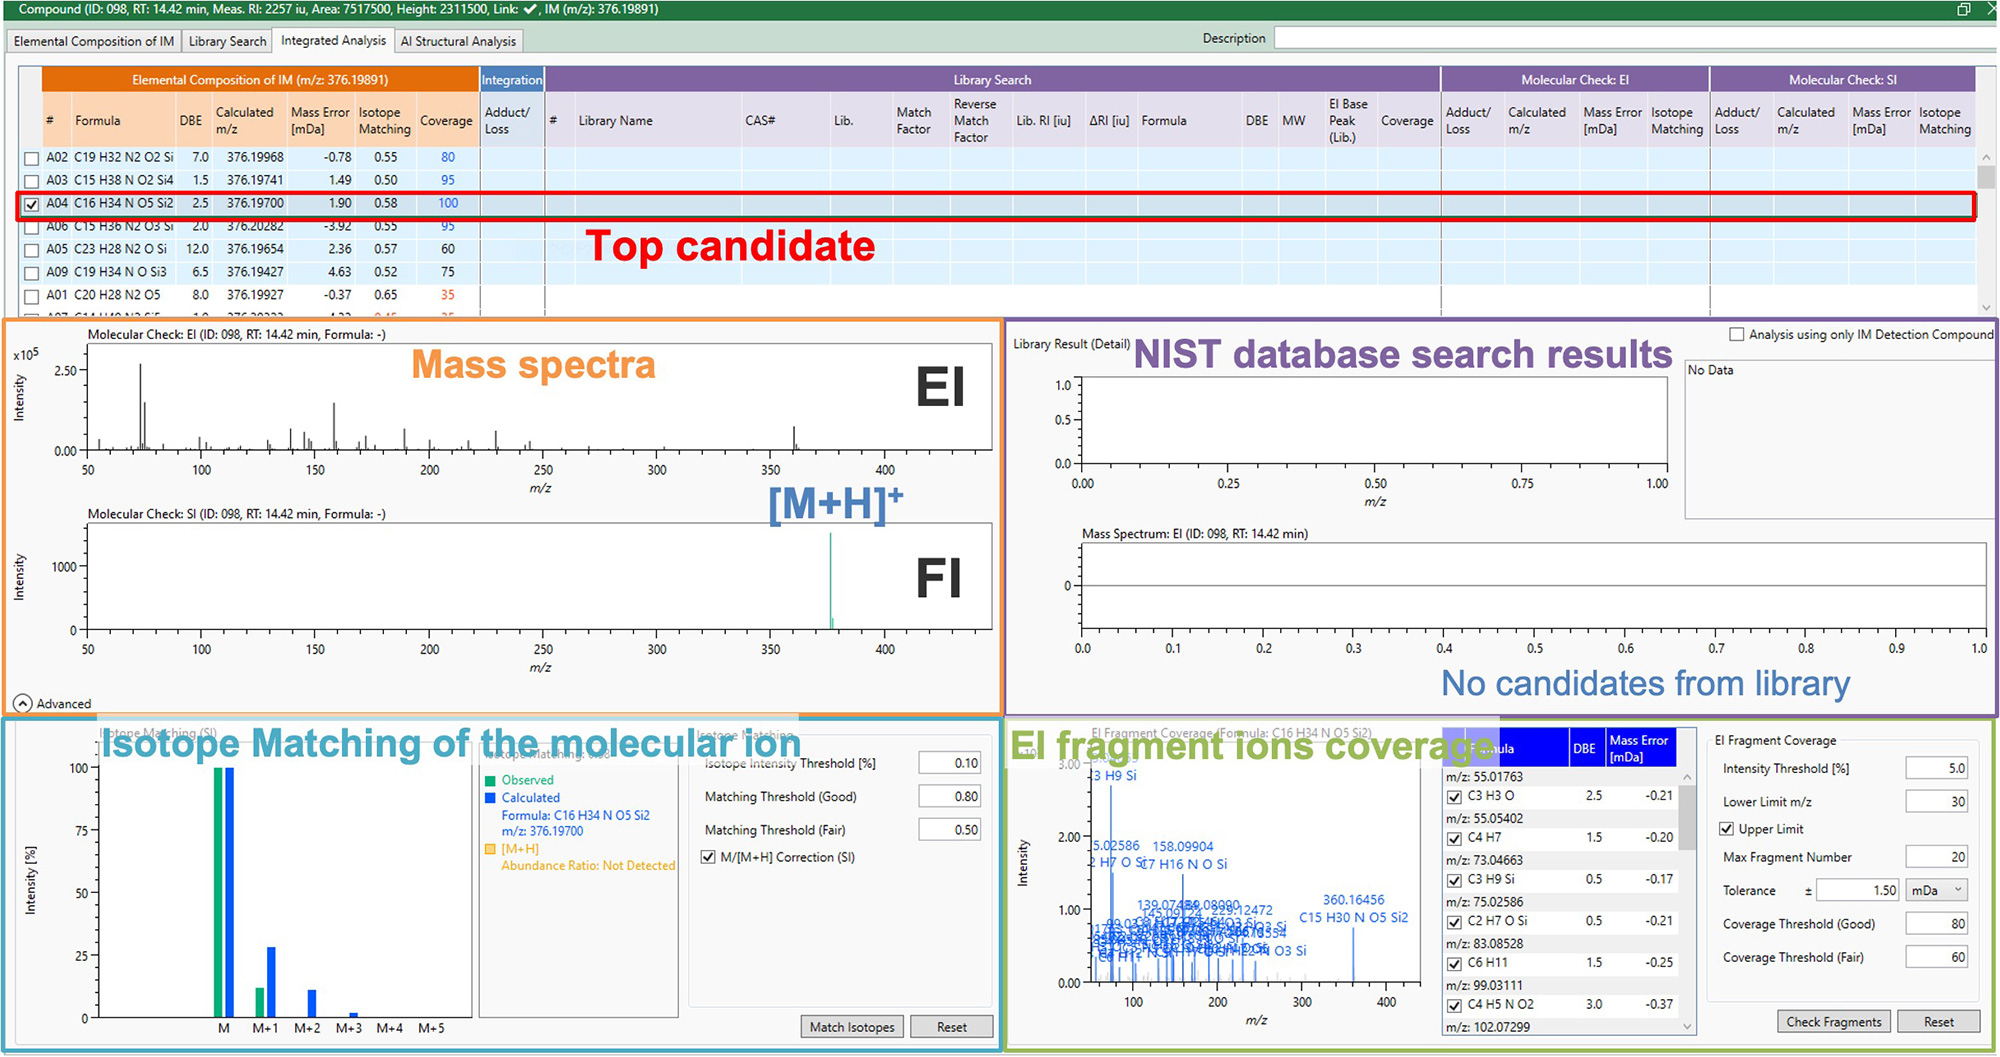
Figure 2. Integrated Analysis results of peak 098
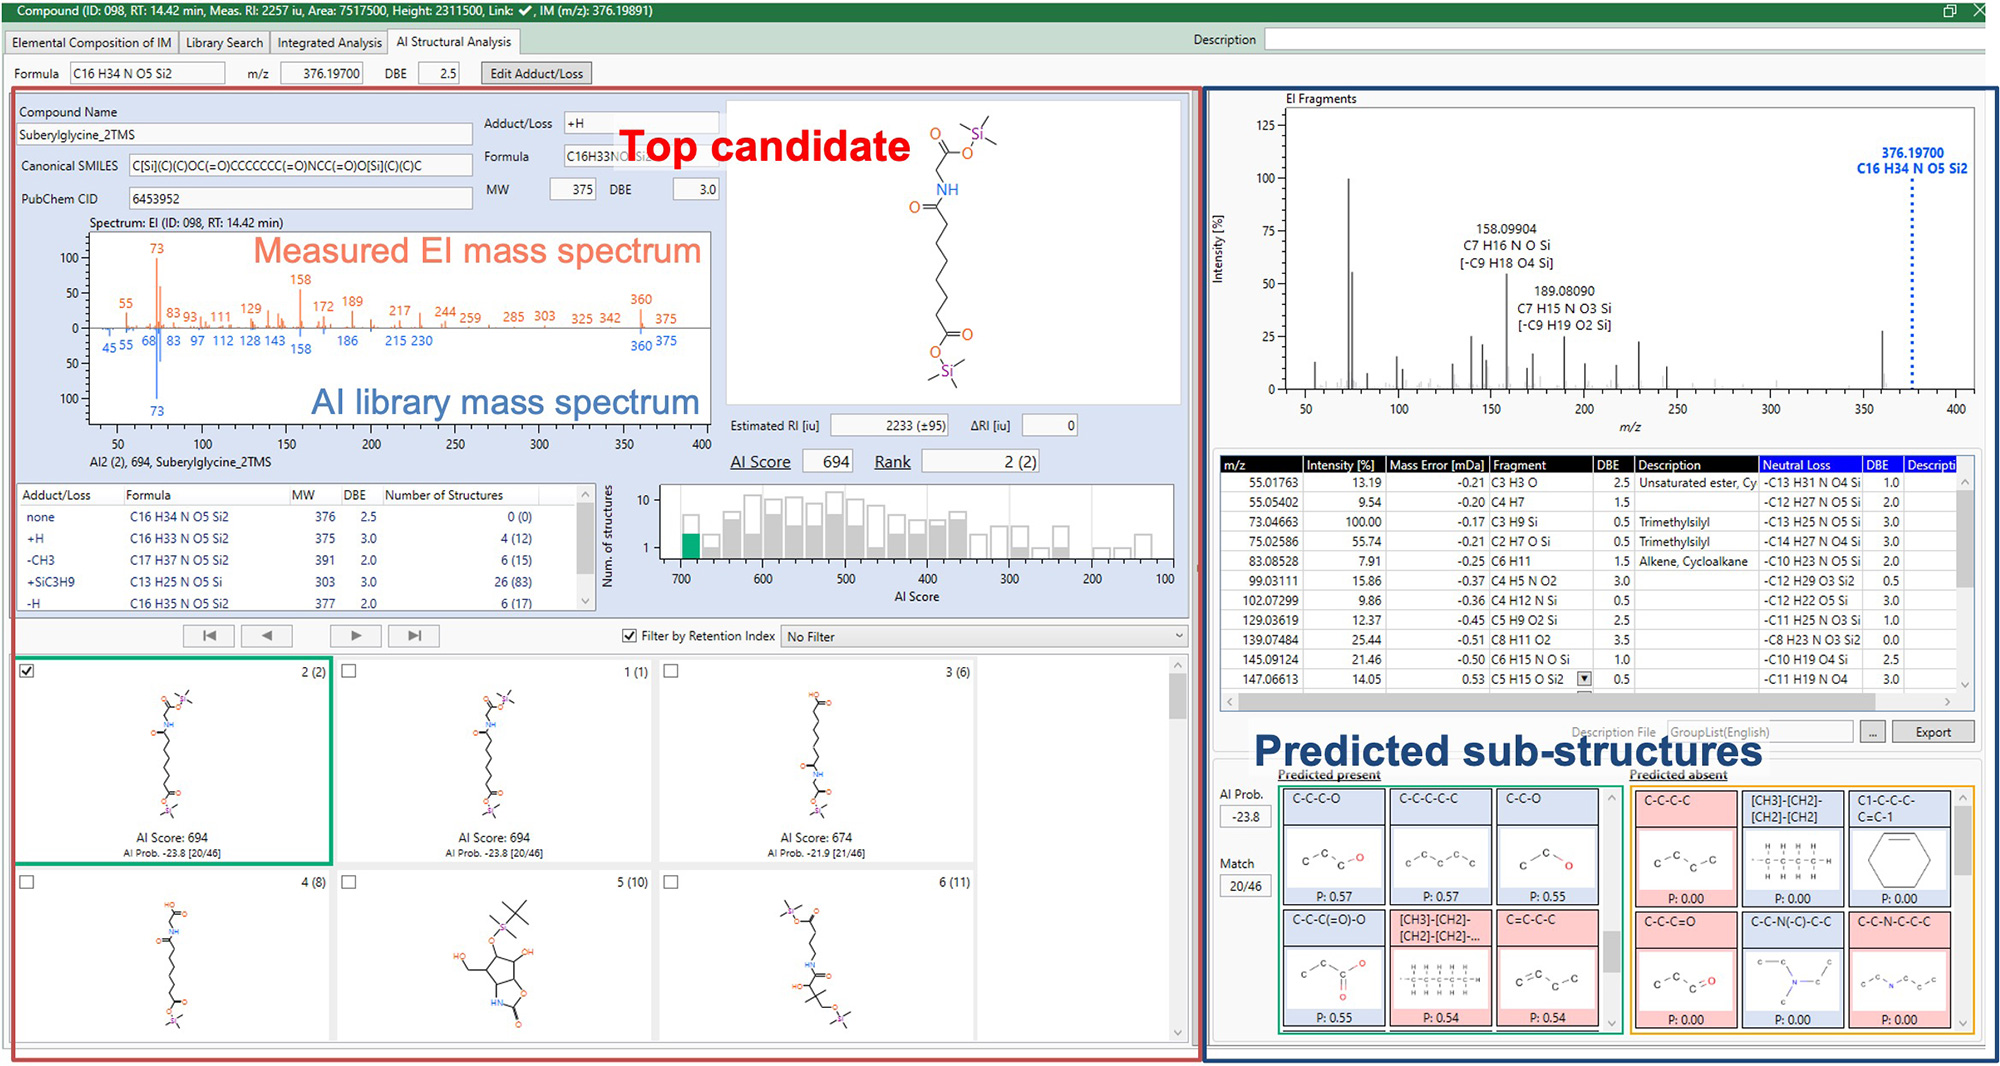
Figure 3. AI Structural Analysis results of peak 098
Table 2. msFineAnalysis AI results
Quantitative Analysis Results
Figure 4 shows the EI TICC and extracted ion chromatograms (EICs) of three target organic acids: 2TMS-lactic acid, 2TMS-glycolic acid and 2TMS-pyruvic acid oxime. Multiple peaks were detected in TICC for the complicated components in urine. However, the EICs created by the accurate m/z signal manages to detect the target compound while limiting the influence of other compounds to the minimum.
All organic acids, including co-eluted organic acids, show detectable peak shapes for quantitation analysis (partially presented in Figure 4). As an example of quantitative analysis, the quantitative values of target organic acids in several urine samples shown in Table 3 were calculated from the area ratio with reference samples at known concentrations.
Table 3. Quantitative values of target organic acids (Unit: μM)
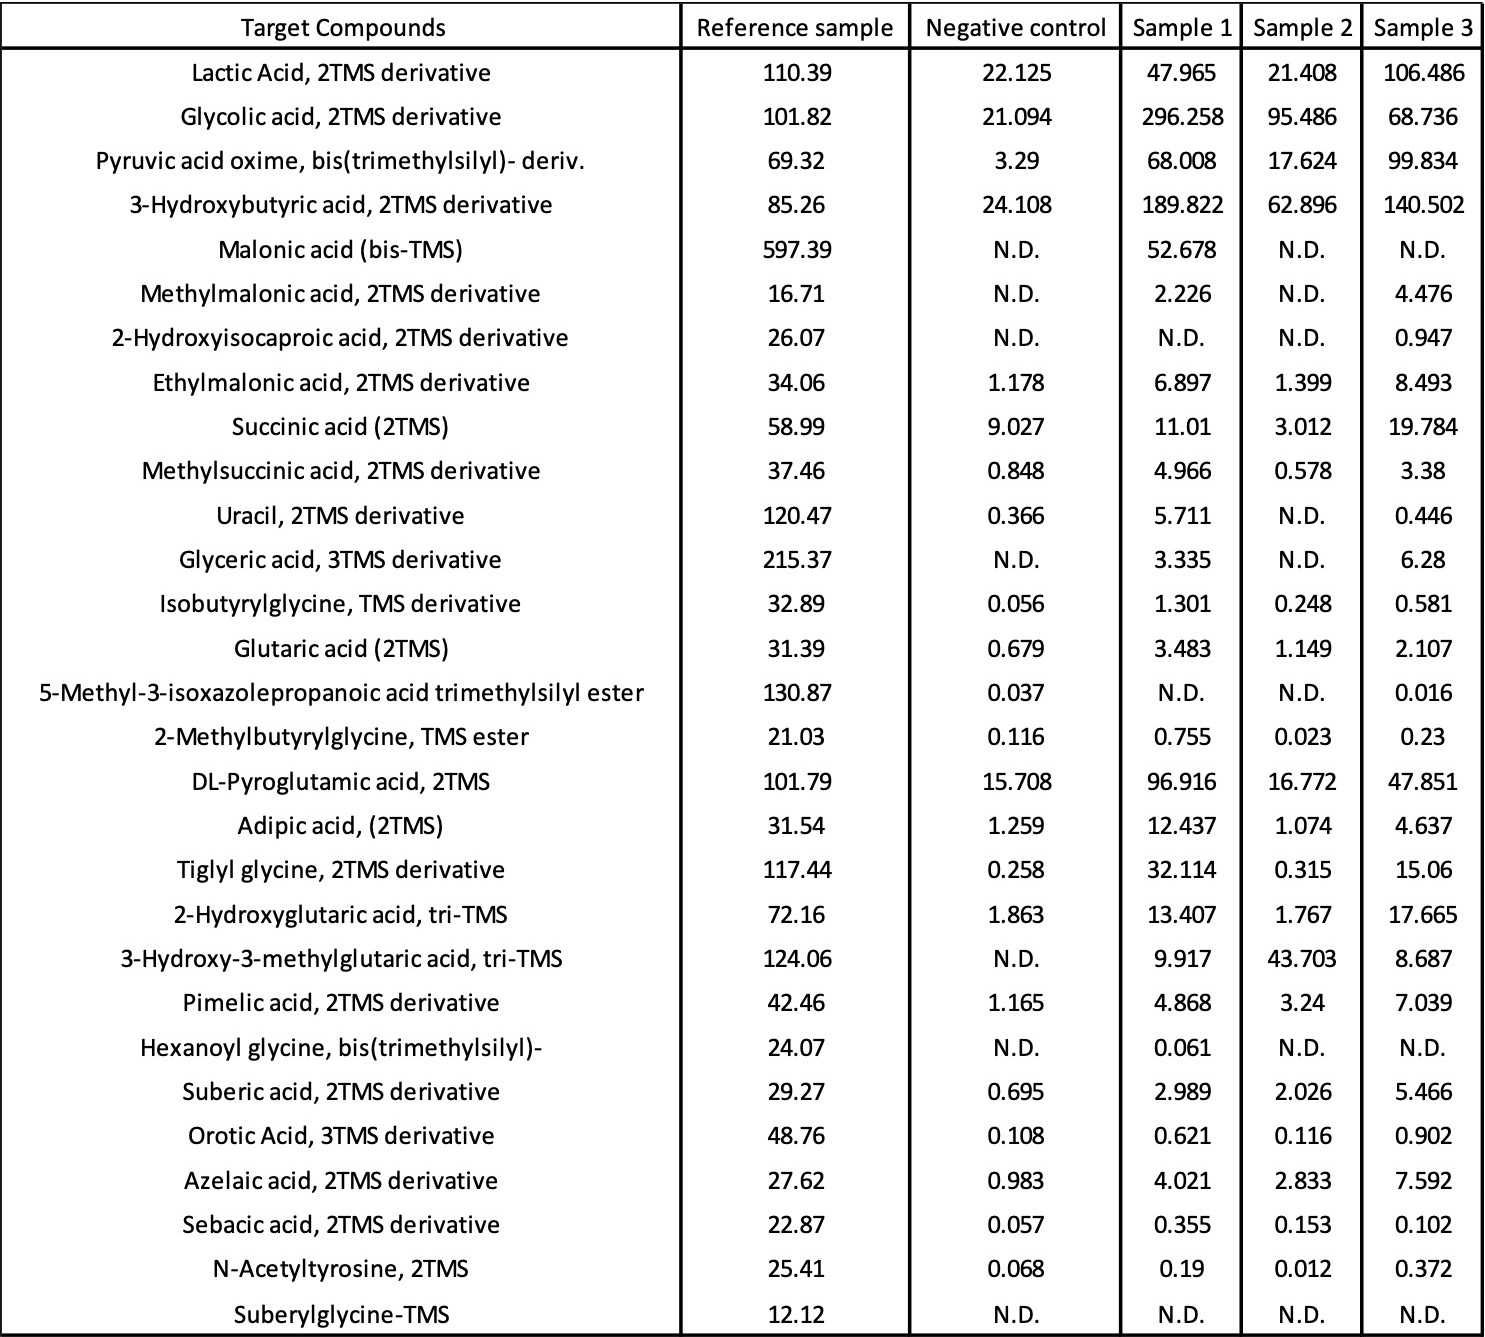
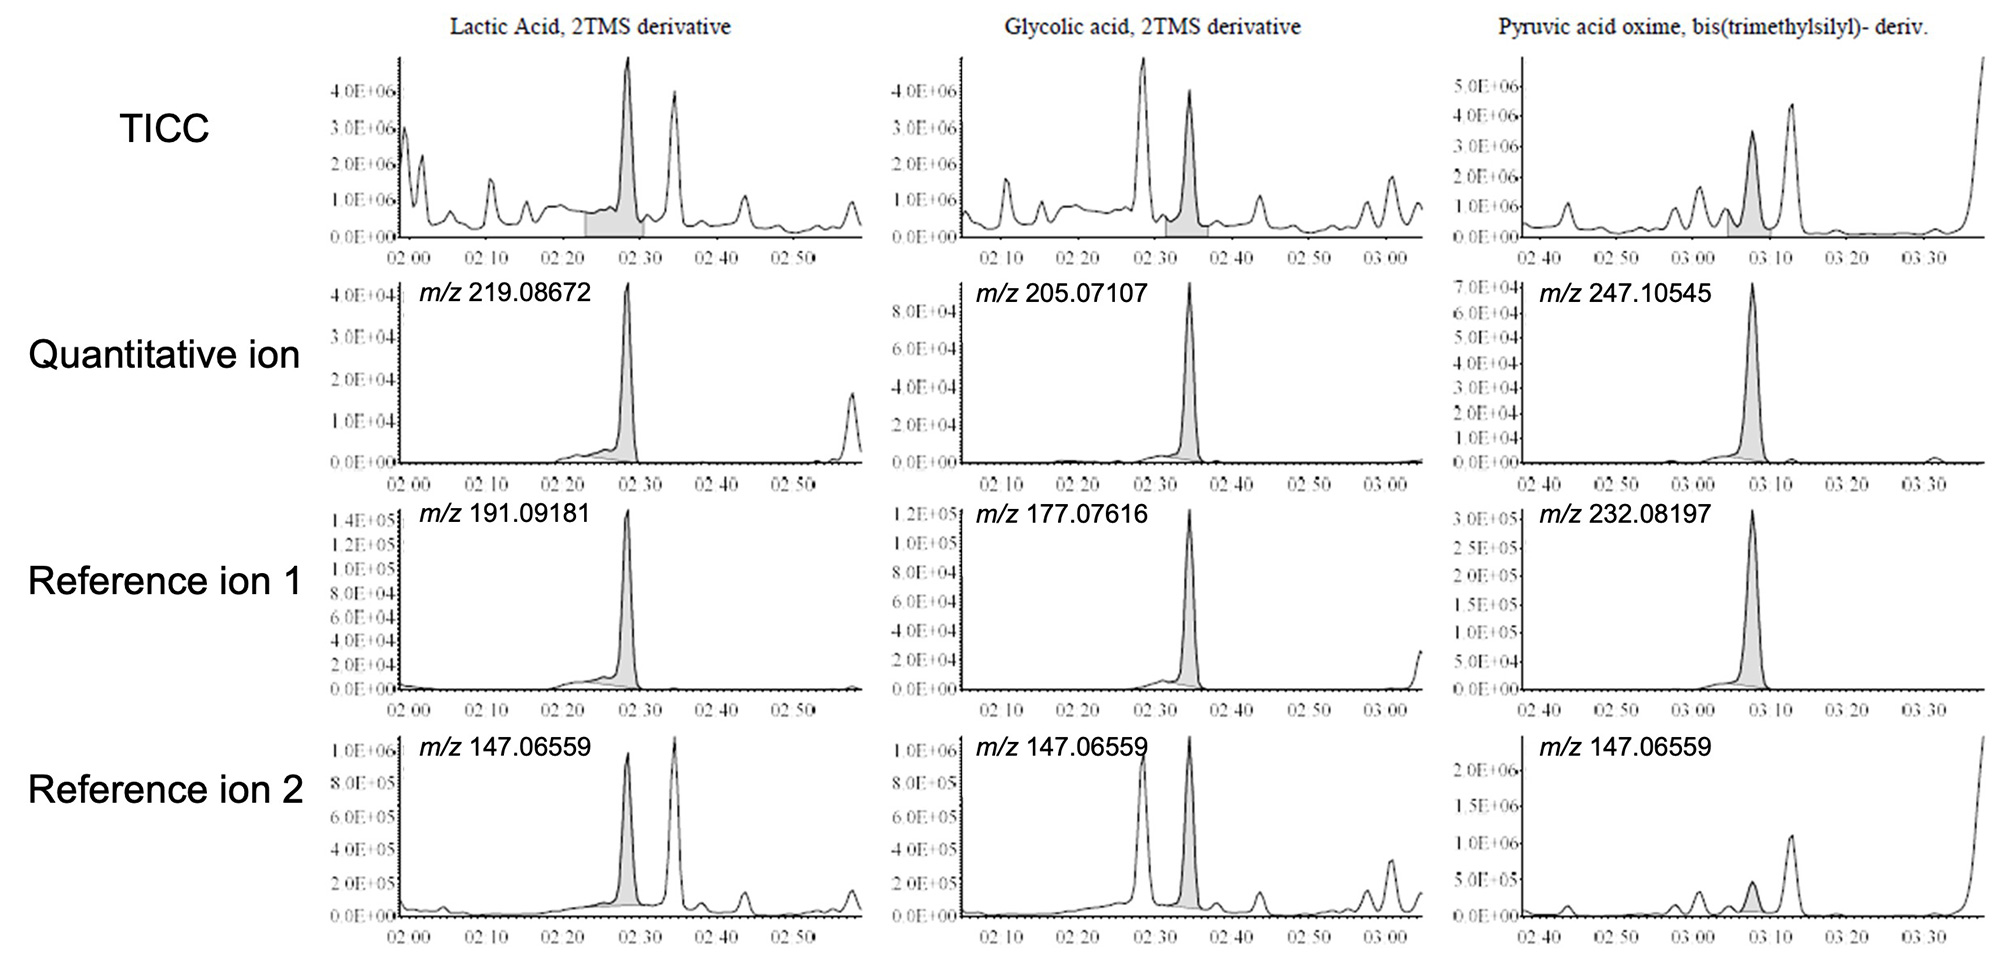
Figure 4. TICC and EICs of extracted urine sample.
(Right: 2TMS-lactic acid, Center: 2TMS-glycolic acid, Left: 2TMS-pyruvic acid oxime)
Summary
The JMS-T2000GC with msFineAnalysis AI is a powerful tool for the identification of the chemical composition and chemical structure of components such as TMS derivatives of organic acids in urine, and for the quantitative analysis by EICs which are created by accurate m/z. The JMS-T2000GC with msFineAnalysis AI is expected to have a wide range of applications for metabolomics and clinical analysis in the future.
Solutions by field
Related products
Product category
Are you a medical professional or personnel engaged in medical care?
No
Please be reminded that these pages are not intended to provide the general public with information about the products.