Structural analysis of EO-PO copolymers using high-resolution MALDI-TOFMS and NMR
MSTips No.423
Ethylene oxide-propylene oxide (EO-PO) copolymer is one of copolymer type nonionic surfactants (nonionic surfactants) that combines hydrophilic EO and hydrophobic PO. It is used in various fields such as lubricants, antifoaming agents, emulsifiers, solubilizers, detergents, and antistatic agents. The physical properties of EO-PO copolymers are controlled by the sequence of EO/PO, such as random copolymerization or block copolymerization, and the number of added moles. In this application note, structural analyzes of EO-PO random copolymers and block copolymers were performed complementary by matrix-assisted laser desorption/ionization time-of-flight mass spectrometry (MALDI-TOFMS) and solution nuclear magnetic resonance (NMR). MALDI is one of the typical soft ionization methods, and since ions derived from polymers are mainly singly charged ions, the m/z on the mass spectrum is the mass of the polymer ions. The use of high-mass-resolution MALDI-TOFMS makes it possible to easily identify polymer series due to differences in the composition of repeating units and end groups, and to calculate the molecular weight distribution of each. Using the KMD method, it became possible to easily visualize polymer series contained in complex high-mass-resolution mass spectra. From NMR, we can expect to obtain detailed structural information (random and block structures) of copolymers that are difficult to analyze by MS.
Experiment
A commercially available EO-PO random copolymer (EO-ran-PO, Mn~2500) and a PO-EO-PO triblock copolymer (PO-EO-PO, Mn~2700, EO 40%wt) were used as samples. In the MALDI-TOFMS experiment, DCTB was used as the matrix, and sodium trifluoroacetate (NaTFA) was used as the cationizing agent. The mass spectra were obtained using the SpiralTOF positive ion mode of JMS-S3000 “SpiralTOF™-plus2.0”. The mass spectra were deisotoped and applied KMD analysis by msRepeatFinder V6. In the NMR experiment, the 13C NMR spectra of the samples dissolved in Chloroform-d were measured with JNM-ECZL 500R.
The results of MALDI-TOFMS
Figure 1 shows mass spectra and KMD plots (Base unit PO) (c) of EO-ran-PO(a) and PO-EO-PO(b).From the mass spectra, it can be seen that both have a molecular weight distribution with a molecular weight around 3000. However, the mass spectra are very complicated, and it is difficult to understand the difference in composition between the two. Therefore, the deisotoped peak lists for both are shown in a KMD plot (Base unit PO). In this plot, the distribution of PO is plotted along parallel to the horizontal axes, and the distribution of EO is plotted diagonally upward to the right. The KMD plots show that the distributions of EO and PO differ greatly between the two; EO-ran-PO has a broader EO distribution than PO, and PO-EO-PO has similar EO and PO distributions. For PO-EO-PO, homopolymers of PO oligomers were observed in the low-molecular region.
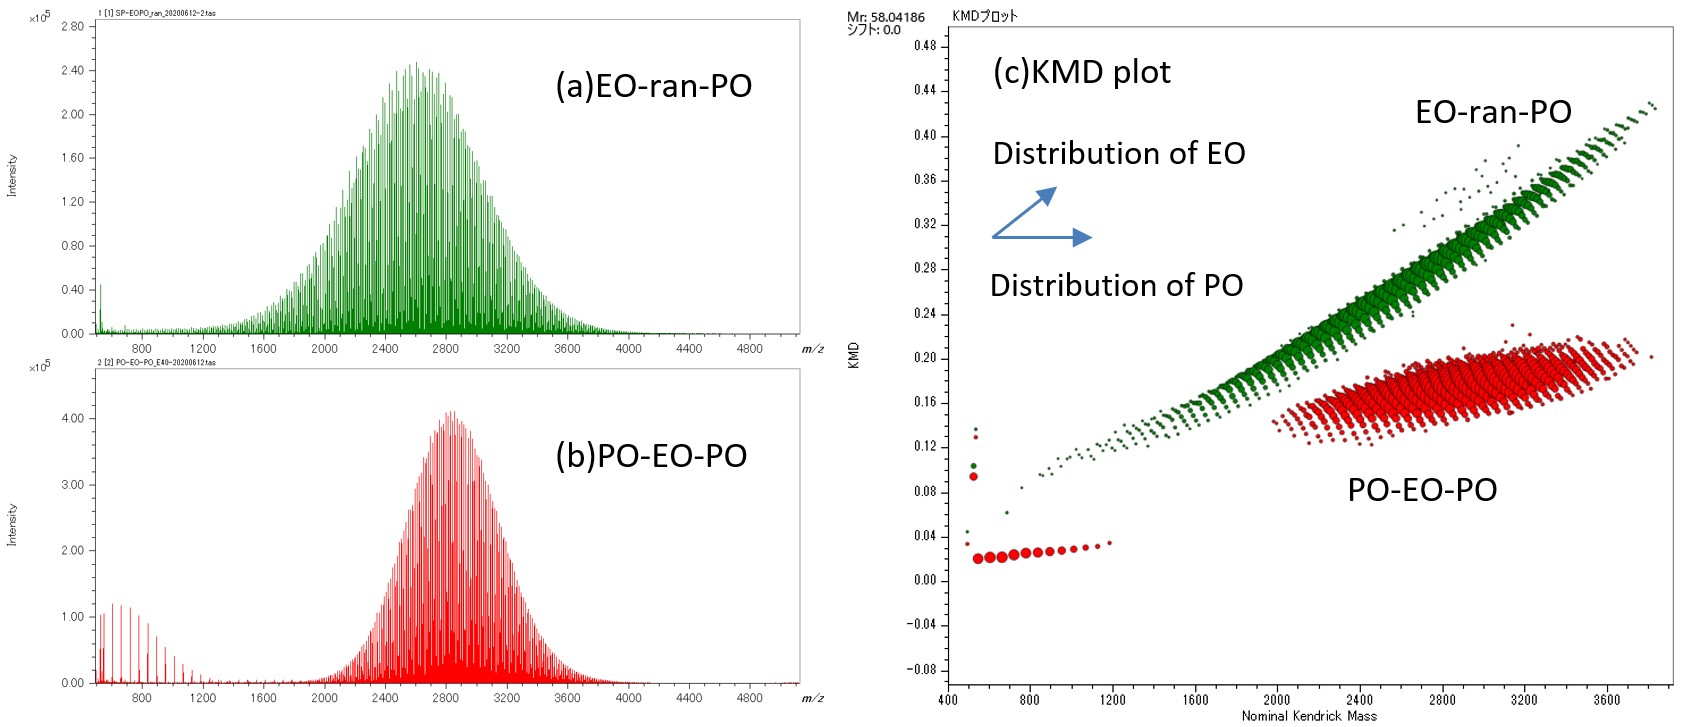
Figure 1 Mass spectra of EO-ran-PO(a), PO-EO-PO(b) and KMD plot of their deisotoped peak lists (c).
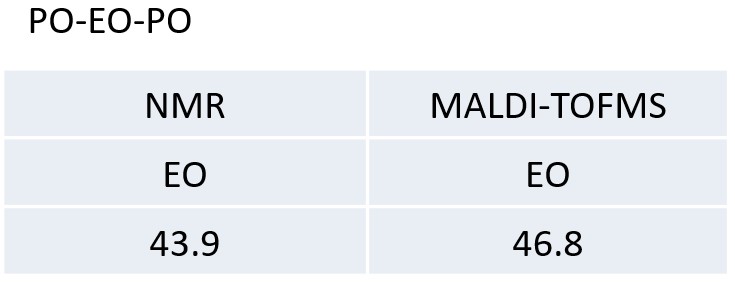
However, the KMD plot does not reveal the distribution of each degree of polymerization. Therefore, we used the search function for binary copolymers, which is a new function of msRepeatFinder V6. This function searches the peak list for binary copolymer peaks by specifying the composition of two monomers, the composition of both end groups, and the adduct ions. Here, the search was performed under the conditions shown in Table 1. A degree of polymerization(DP) plot is displayed as one of the results (Figure 2). The DP plots show the degree of polymerizations of EO (Y-axis) and PO (X-axis) and their ion intensities (area of the plots) in EO-ran-PO(a) and PO-EO-PO(b) binary copolymers. The molar ratio and weight ratio of EO and PO can also be calculated from the intensity distribution of the DP plots. The weight ratio of EO in PO-EO-PO was calculated to be 40.1%, which is in good agreement with the catalog value of 40%. A comparison of the EO/PO composition ratios obtained from 13C NMR and MALDI-TOFMS will be described later.
Table 1 Search condition for the two types of measured EO-PO copolymer

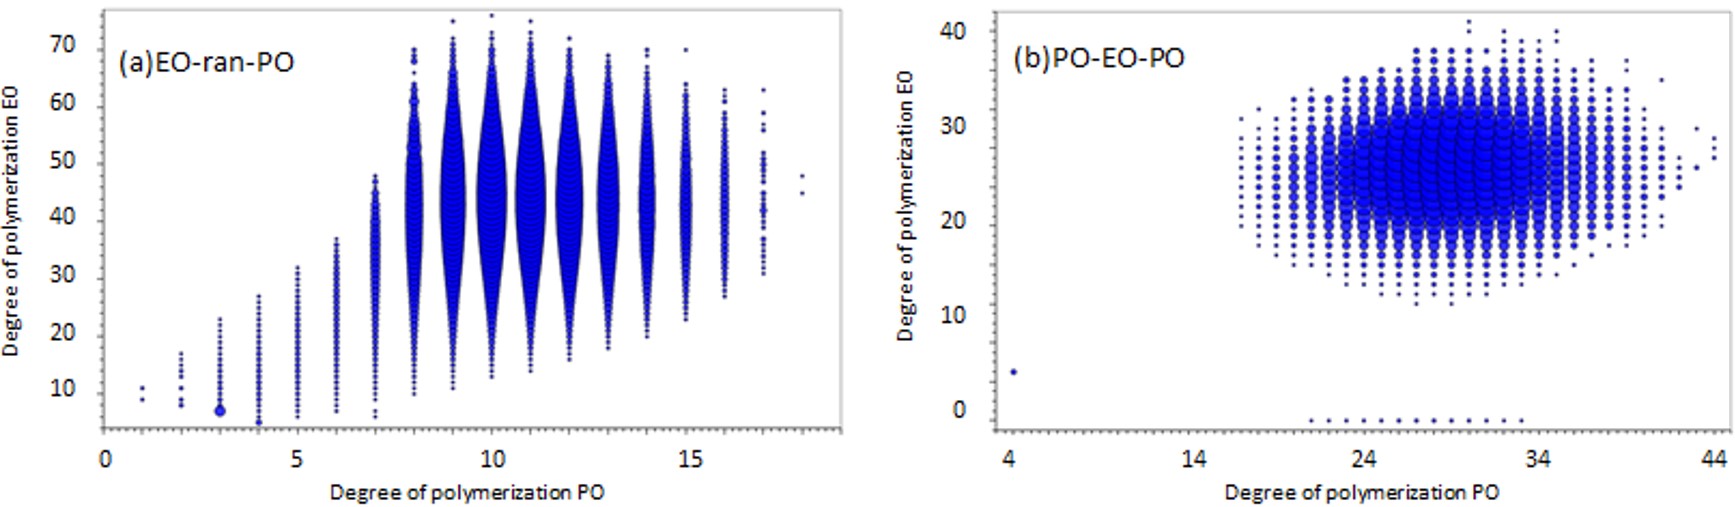
Figure 2 DP plots of EO-ran-PO(a) and PO-EO-PO(b).
The results of 13C NMR
Figure 3a shows the 13C NMR spectrum of PO-EO-PO, which provides a lot of stereoregularity information about the chain structure of PO (Figure 3b).
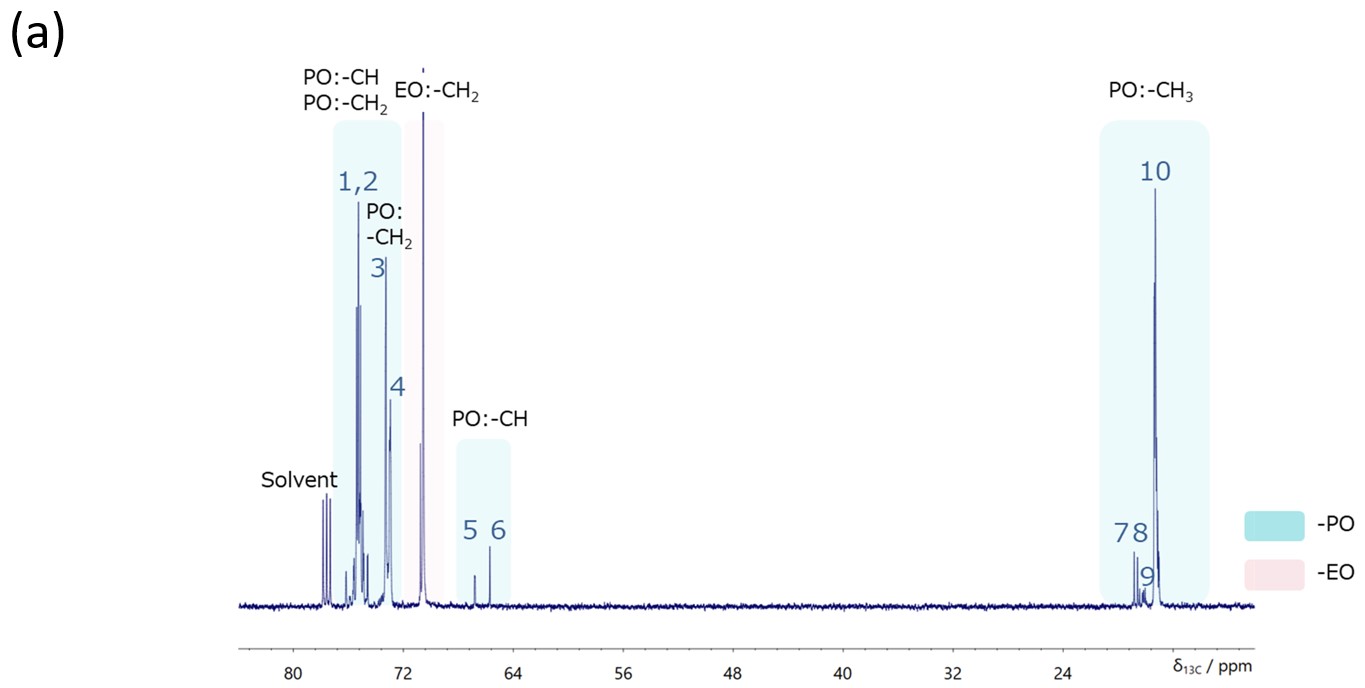
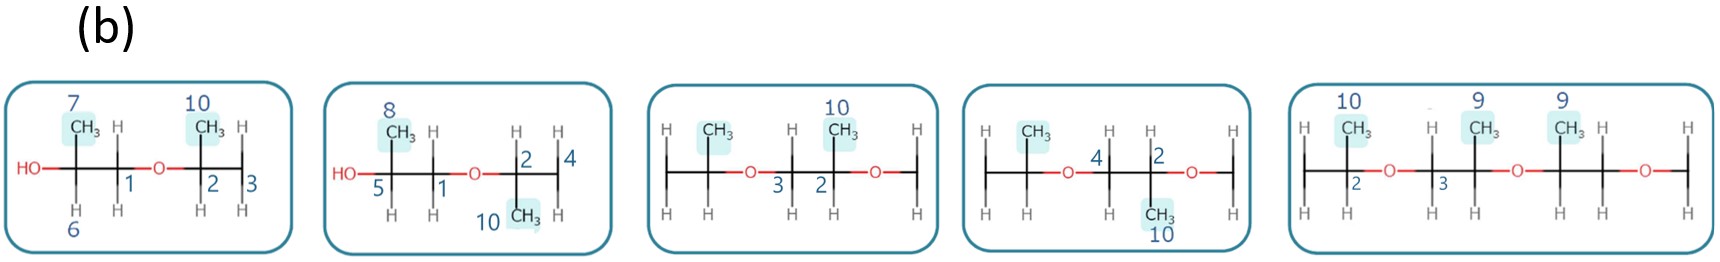
Figure 3 13C NMR spectrum with proton decoupling of PO-EO-PO/ Chloroform-d(a) and the stereoregularity information on the PO linkage structure(b).
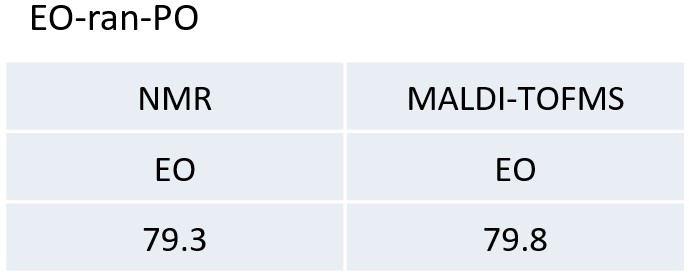
Next, Figure 4 shows the results of comparing the 13C NMR spectra of PO-EO-PO and EO-ran-PO. A large differences were observed at the two points indicated by “↓” in the figure. ① is a decrease in the peak indicating the difference in the stereoregularity of consecutive POs, and ➁ is the appearance of a peak due to an increase in the number of POs adjacent to EO. These are considered to be information supporting the randomness of the EO-ran-PO sequence. Also, the peaks related to the end groups are enlarged on the right. The result suggests that only PO is present in the terminal group of PO-EO-PO, and that both EO and PO are present in EO-ran-PO, reflecting the structure of each copolymer. Finally, the EO/PO molar composition ratio determined by 13C NMR quantitative measurement was compared with the results of MALDI-TOFMS, and EO-ran-PO showed good agreement. The MALDI-TOFMS results for PO-EO-PO show that the PO ratio is lower than that for 13C NMR. This is a reasonable result considering that oligomers of PO are observed in the MALDI-TOFMS mass spectrum and that this amount is subtracted.
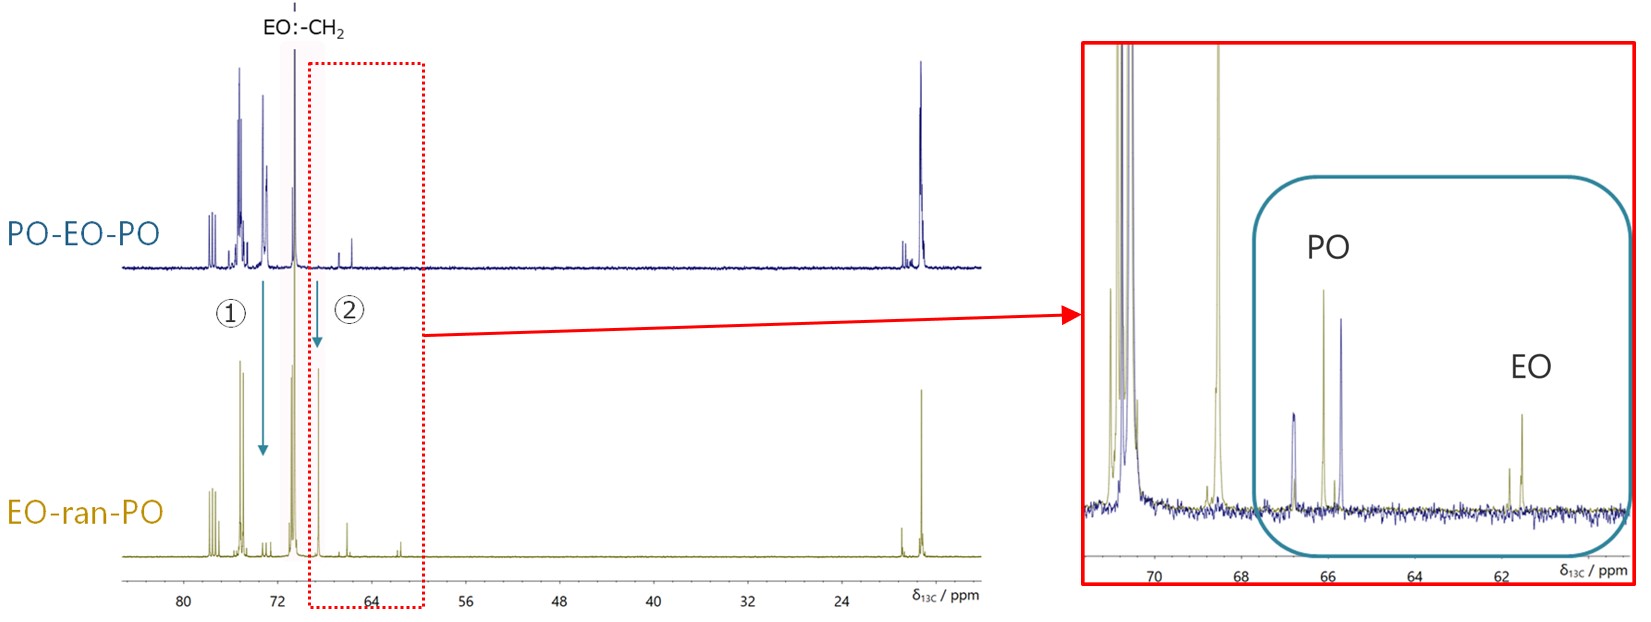
Figure 4 Comparison between 13C NMR spectra with proton decoupling of PO-EO-PO/ Chloroform-d (blue), EO-ran-PO/ Chloroform-d (brown).
Table 2 The molar ratios of EO of the PO-EO-PO and EO-ran-PO calculated from NMR and MALDI-TOFMS results.
Conclusion
In this application note, two types of EO-PO copolymers were comprehensively analyzed by high-resolution MALDI-TOFMS and 13C NMR.MALDI-TOFMS confirmed the molecular weight distribution of the EO-PO copolymer and enabled the calculation of the EO/PO composition ratio. This is important information because it cannot be identified by 13C NMR. From the 13C NMR spectrum, we were able to obtain structural information for the main chain structure, which made it possible to distinguish block and random sequences, and end group units. This is important information that cannot be obtained by MALDI-TOFMS. We also compared the EO/PO composition ratios obtained by MALDI-TOFMS and 13C NMR, and found good agreement. Thus, in the analysis of polymers, it is important to combine the information obtained from MALDI-TOFMS and NMR.
Solutions by field
Related products
Are you a medical professional or personnel engaged in medical care?
No
Please be reminded that these pages are not intended to provide the general public with information about the products.