JMS-S3000 NewSpiralTOF™
MALDI-TOFMS
 Powered by Bioz
Features
◆ Clicking the Play button starts the video (approx. 4 minutes). ◆
Did you know that MALDI-TOFMS can see small molecules?
See Small Molecules Clearly with MALDI-TOFMS
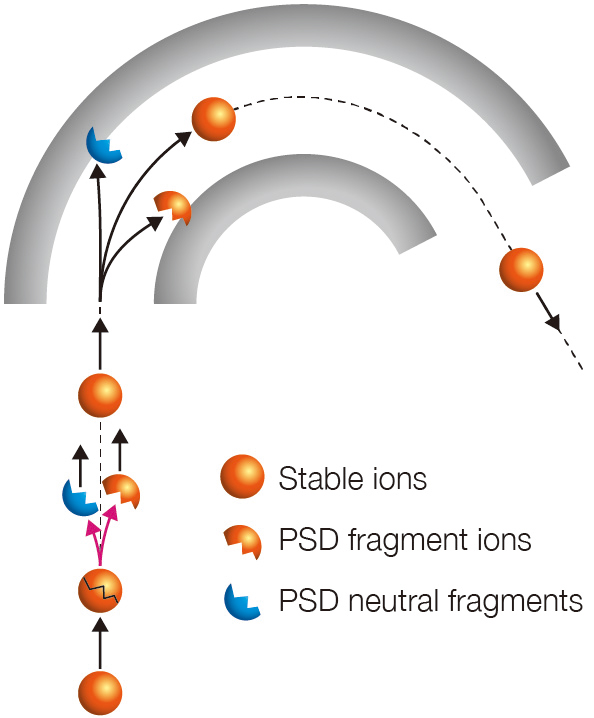
Matrix-assisted laser desorption/ionization (MALDI) has long been recognized as a powerful ionization method for high-molecular-weight compounds such as proteins and synthetic polymers. In reality, however, MALDI is an exceptionally versatile technique capable of ionizing analytes ranging from very small molecules with molecular weights below 100 all the way to macromolecules exceeding 100,000. What sets NewSpiralTOF™ apart is its ability to deliver clean, high-sensitivity measurements in the low-mass region, where conventional MALDI reflectron TOFMS systems often suffer from chemical noise caused by the post-source decay (PSD) fragments of matrix cluster ions. Because the SpiralTOF ion optics are built from sector electric fields, low-kineticenergy ions generated by PSD are effectively excluded before they reach the detector. The result is a mass spectrum with virtually no chemical noise in the low-mass region, enabling highly sensitive and accurate mass measurements of small molecules.
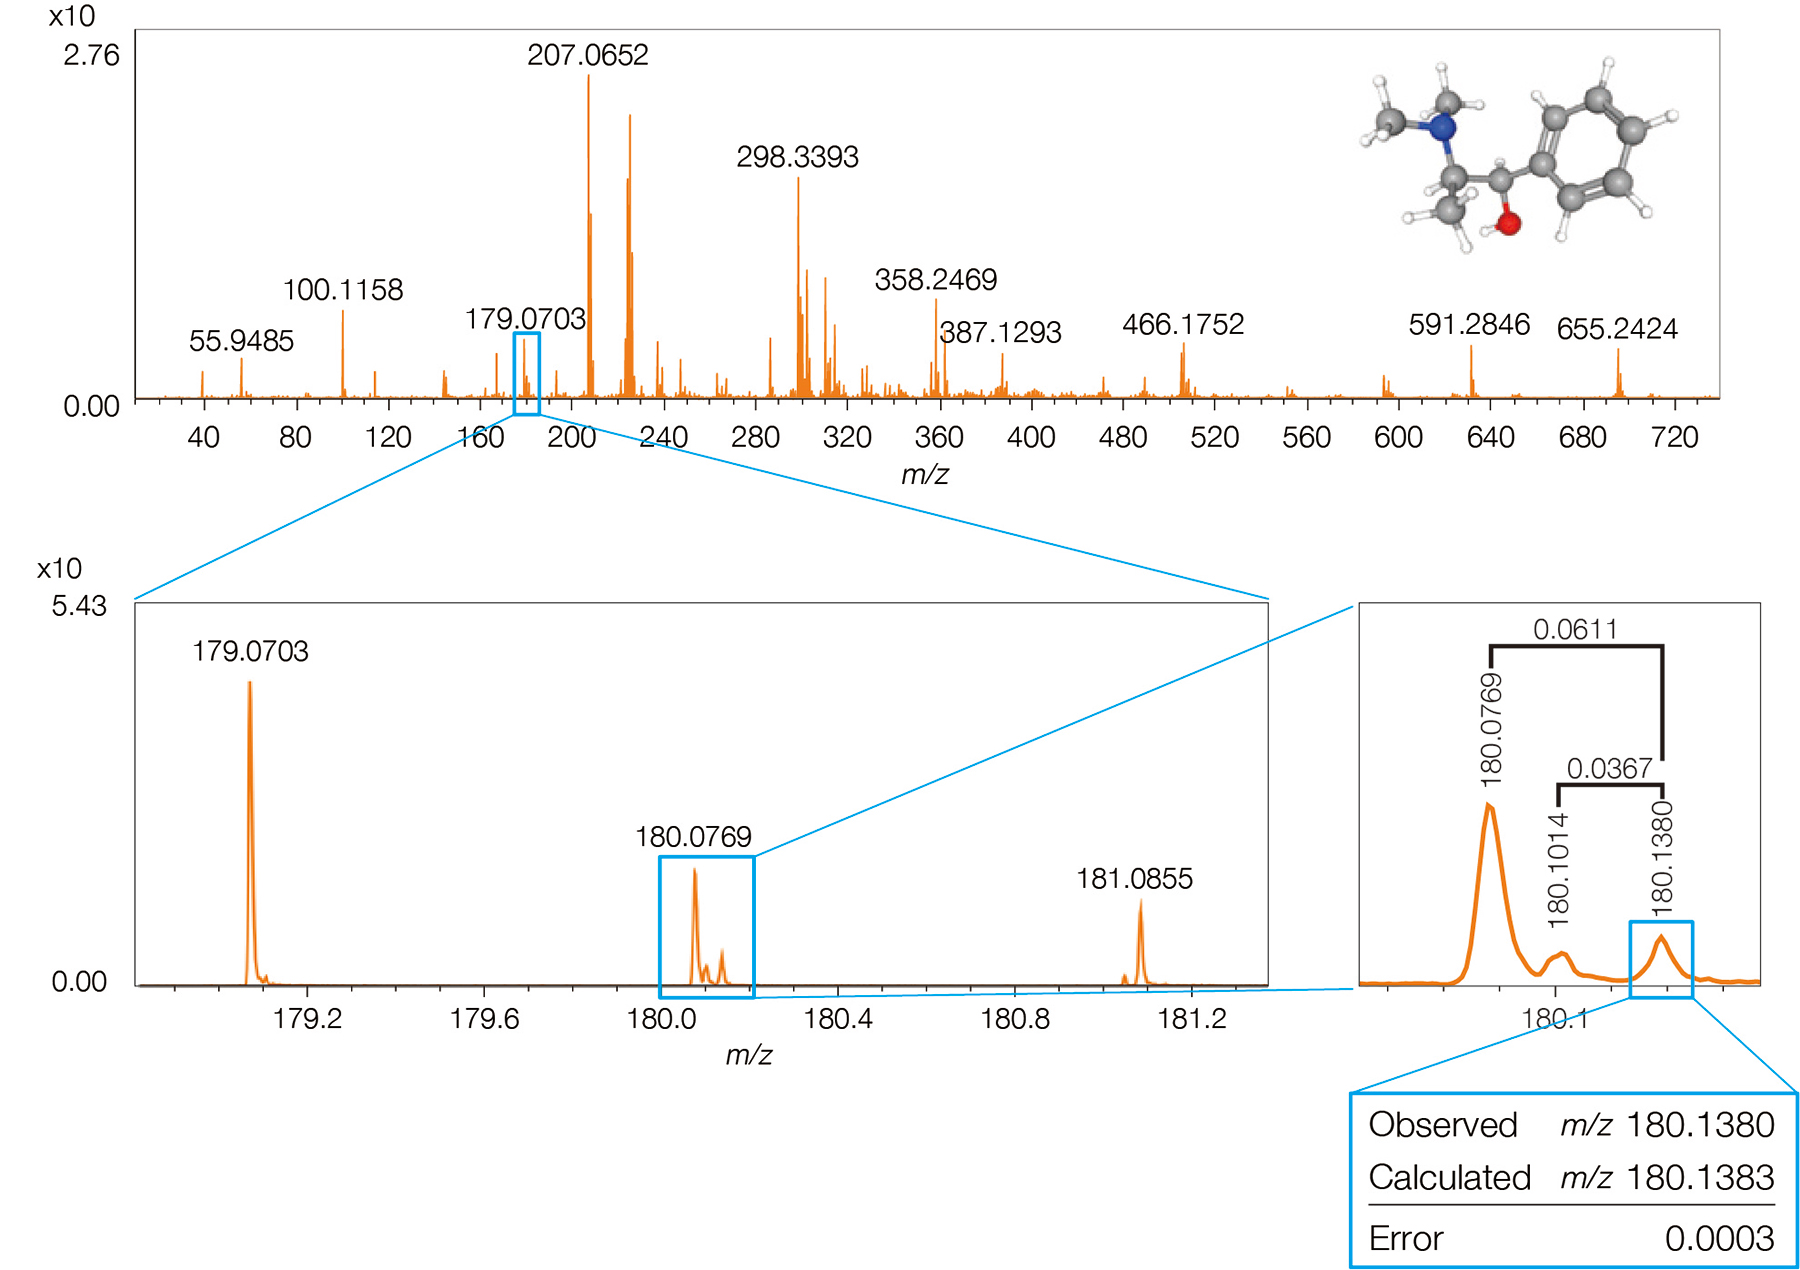
This advantage is clearly demonstrated in the measurement of methylephedrine from human urine after administration of a cold medicine containing dl-methylephedrine hydrochloride. Even after only simple desalting treatment, the NewSpiralTOF™ clearly detected the protonated methylephedrine ion and achieved a mass error of just 0.0003 u (1.7 ppm).
View details of this application
Resolution, Accuracy, and Sensitivity All in One Instrument
Feature 1: Ultra-high mass-resolution, ultra-high mass-accuracy
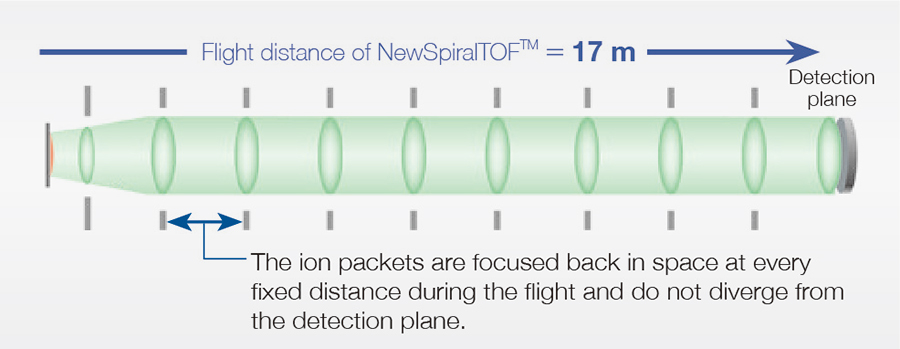
Built on JEOL's proprietary SpiralTOF ion optics, derived from the MULTUM II ion optics system developed at Osaka University, the NewSpiralTOF™ achieves an effective flight path of 17 meters in a compact instrument design. This advanced ion optical configuration combines high ion transmission with performance levels that are exceptional for MALDI-TOFMS: mass resolution of 75,000 and mass-accuracy of 1 ppm using internal calibration.
Feature 2: High quality data for everyone
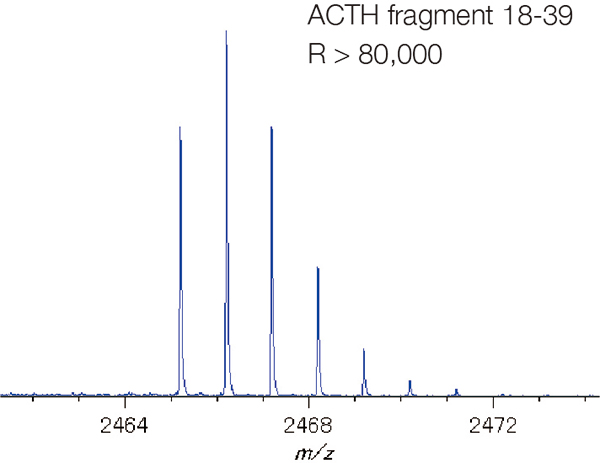
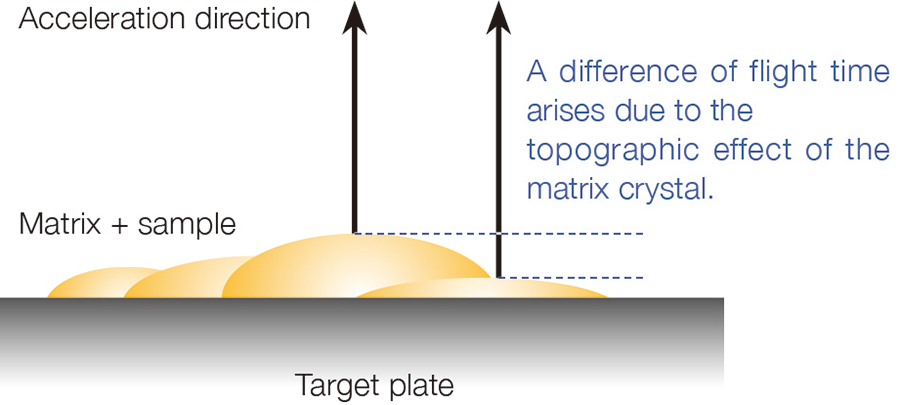
A longer flight path does more than improve performance under ideal conditions. It also enhances day-to-day practicality by reducing the influence of specimen-surface irregularities, such as matrix crystal morphology on a target plate or surface variation in mass imaging specimens. This makes it easier for users to obtain high-quality, reproducible data under real-world operating conditions.
Feature 3: High sensitivity despite long flight path
Even with a long flight path, NewSpiralTOF™ maintains excellent sensitivity. Ion packets of the same mass are refocused at each cycle of the spiral trajectory, allowing the system to achieve high mass-resolution and high mass-accuracy without compromising high sensitivity.
Feature 4: Analysis of small molecules realized with very low chemical noise
Because the SpiralTOF ion optical system, which consists of electric sectors, also acts as an energy filter, fragment ions generated by PSD are prevented from passing through the analyzer. This is the key to its remarkably low chemical noise in the low-mass region and its superior performance for small-molecule analysis.
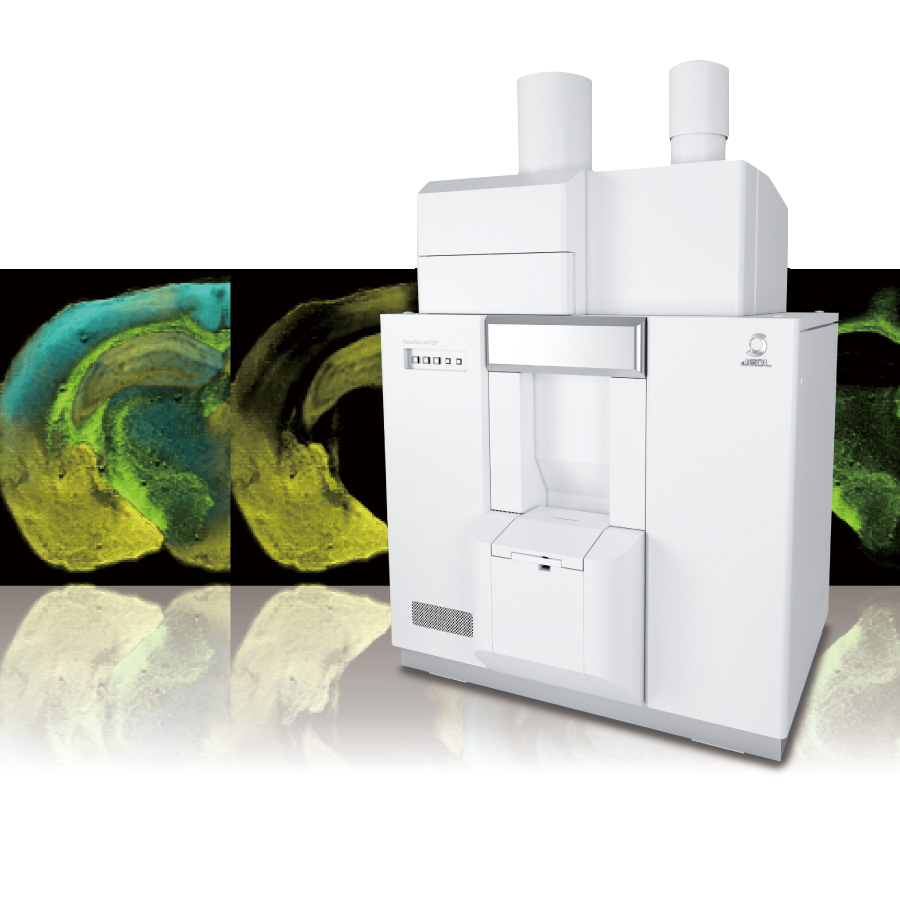
NewSpiralTOF™
High-Speed MS Imaging × High Mass-Resolution
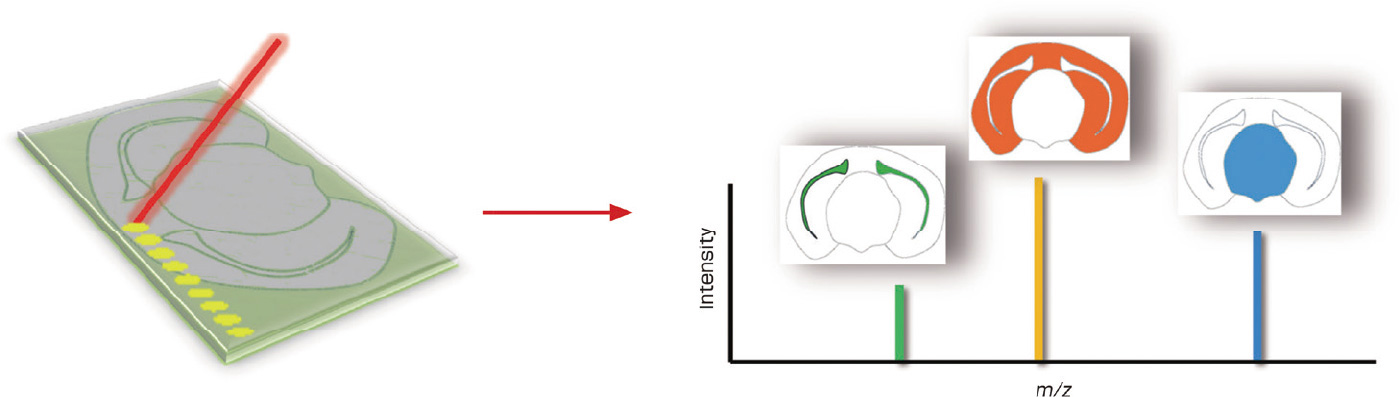
In MALDI mass spectrometry imaging (MALDI-MSI), molecules are visualized directly within a specimen by coating the specimen surface with matrix, scanning it with a laser, and acquiring a mass spectrum at each position. This makes it possible to see where specific molecules are located and how much of them is present across a tissue section or other specimen surface.
High Mass-Resolution for Accurate MS Imaging
Thanks to its 17 m flight path, the NewSpiralTOF™ delivers high mass-resolution even when analyzing biological tissue sections with nonuniform surface conditions. In measurements of approximately half of a mouse brain over a region of about 5 × 7 mm, the system achieved a mass resolution of approximately 40,000 in the average mass spectrum. This high resolving power enabled the separation of isobaric lipid species such as phosphatidylcholine (PC), phosphatidylethanolamine (PE), and galactosylceramide (GalCer), making it possible to obtain the correct spatial distribution for each molecule.
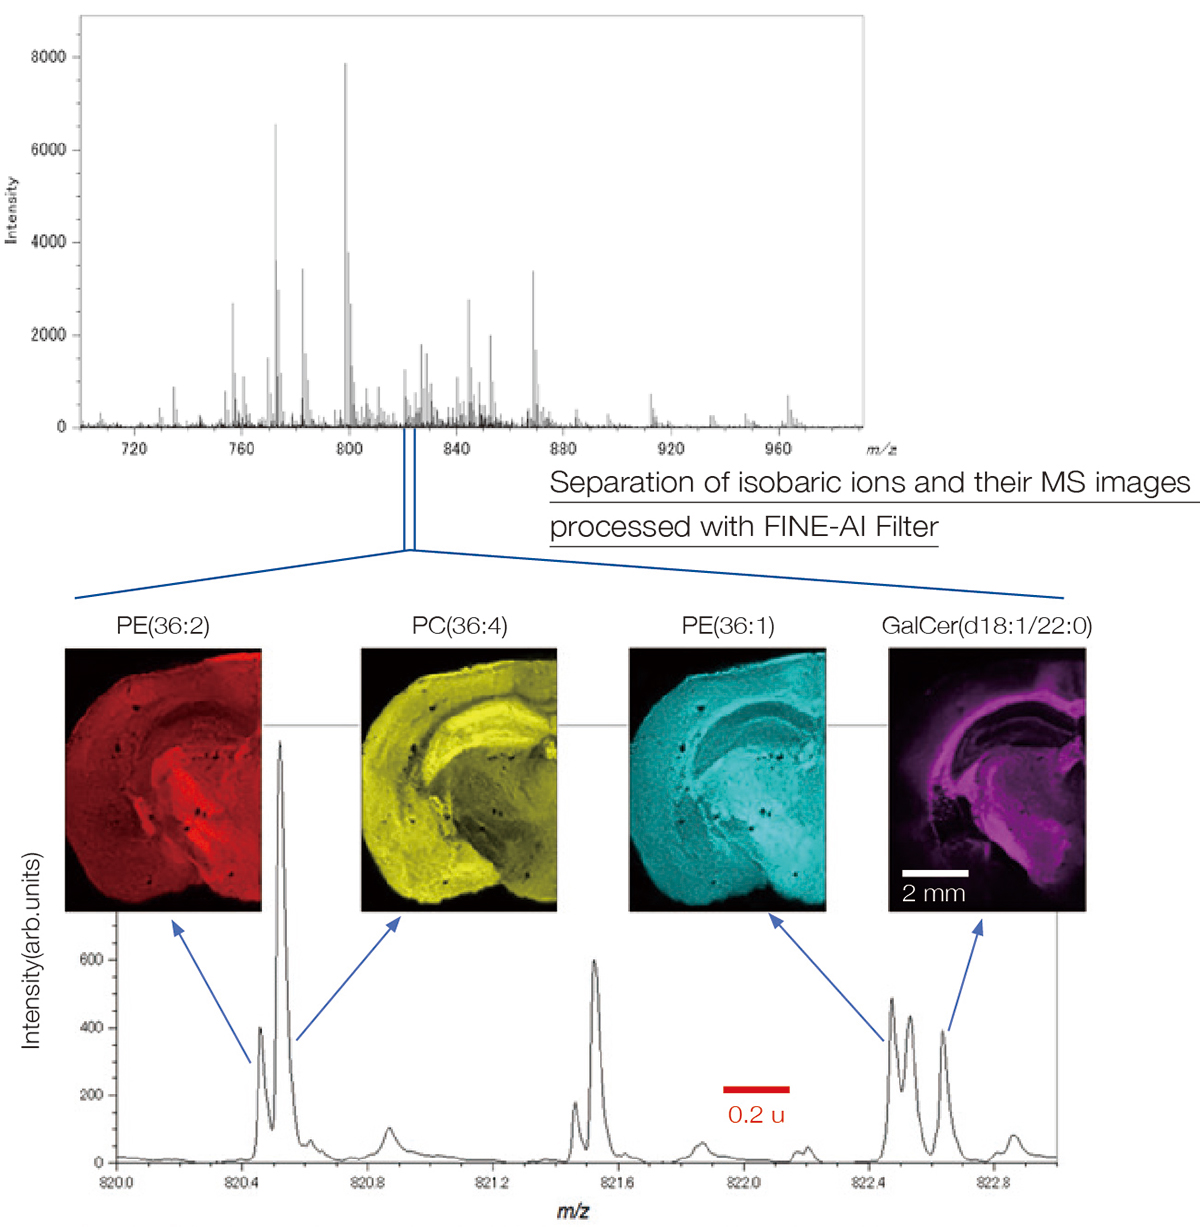
PE: Phosphatidyl ethanolamine, PC: Phosphatidyl Choline, GalCer: Galactosylceramide
This data was acquired in a joint research project with the Mass Spectrometry Group, Project Research Center for Fundamental Sciences, Graduate School of Science, Osaka University.
The tissue section specimen was provided by Awazu Laboratory, Division of Sustainable Energy and Environmental Engineering, Graduate School of Engineering, Osaka University.
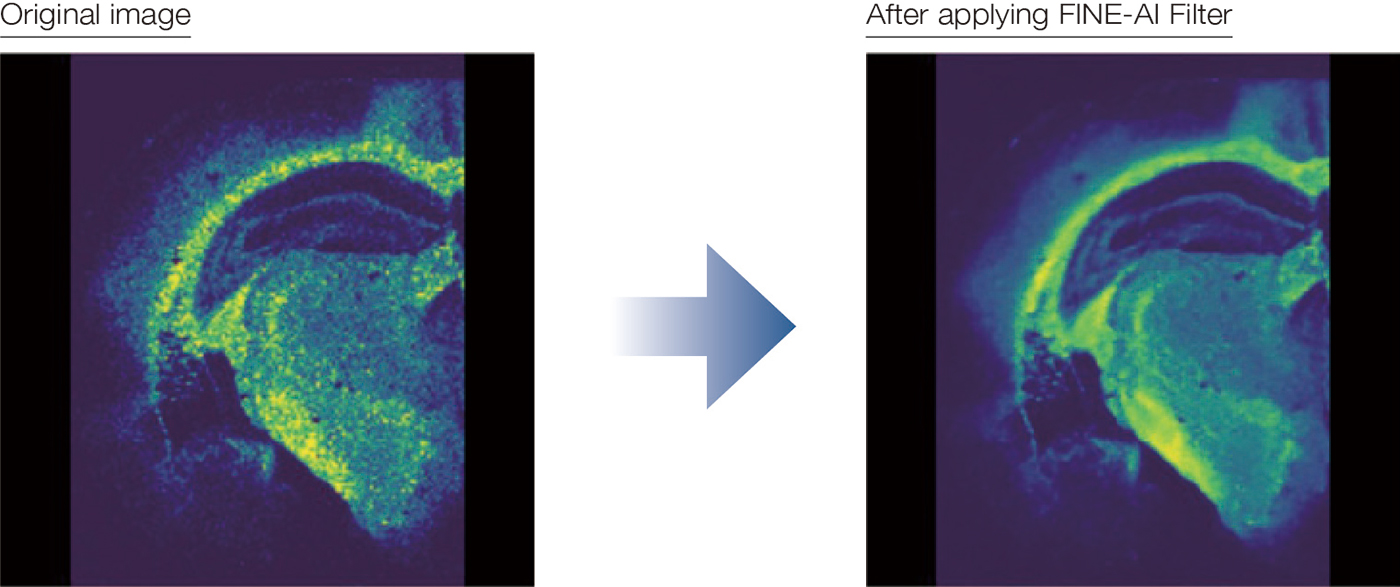
AI-Enhanced Image Quality for MS Imaging
JEOL has a long history of innovation in image processing, driven by its leadership in electron microscopy. Building on this expertise, JEOL adapted its AI-based image enhancement technology LIVE-AI (Live Image Visual Enhancer-AI), originally developed for SEM, to MS imaging data processing and implemented it as the FINE-AI Filter. The result is a substantial improvement in the clarity and interpretability of mass images.
View details of this application
Automatic Extraction of Important Features
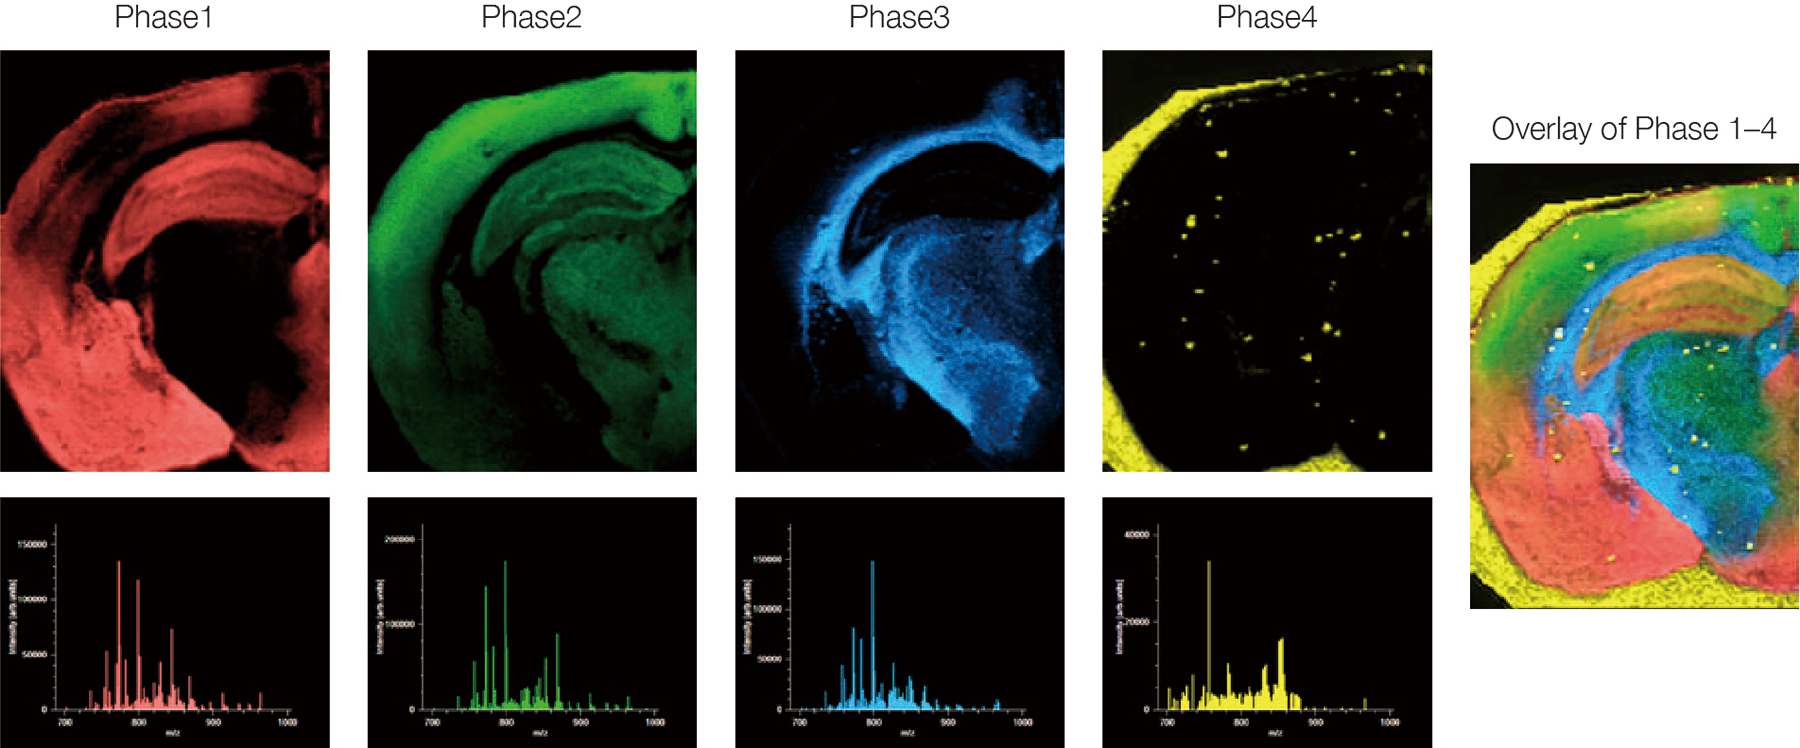
With the high mass-resolution of the NewSpiralTOF™, more than 100 lipid species were detected in mouse brain sections. However, interpreting the distribution of each lipid individually is not practical. Meaningful insight requires statistical tools that can identify groups of components that vary together and summarize complex datasets efficiently.
To address this, vertex component analysis (VCA), a method that models all spectra in a mass imaging dataset as mixtures of a small number of "vertex components" is implemented. Compared with methods such as principal component analysis, VCA provides results that are easier to interpret in a shorter time. Because VCA is sensitive to noise, applying it after denoising with the FINE-AI Filter makes the analysis far more effective. In the example shown, this approach revealed three key vertex components characterizing lipids in mouse brain tissue.
View details of this application
JMS-S3000 NewSpiralTOF™ Mass Spectrometry Imaging System (Option)
TOF-TOF Option
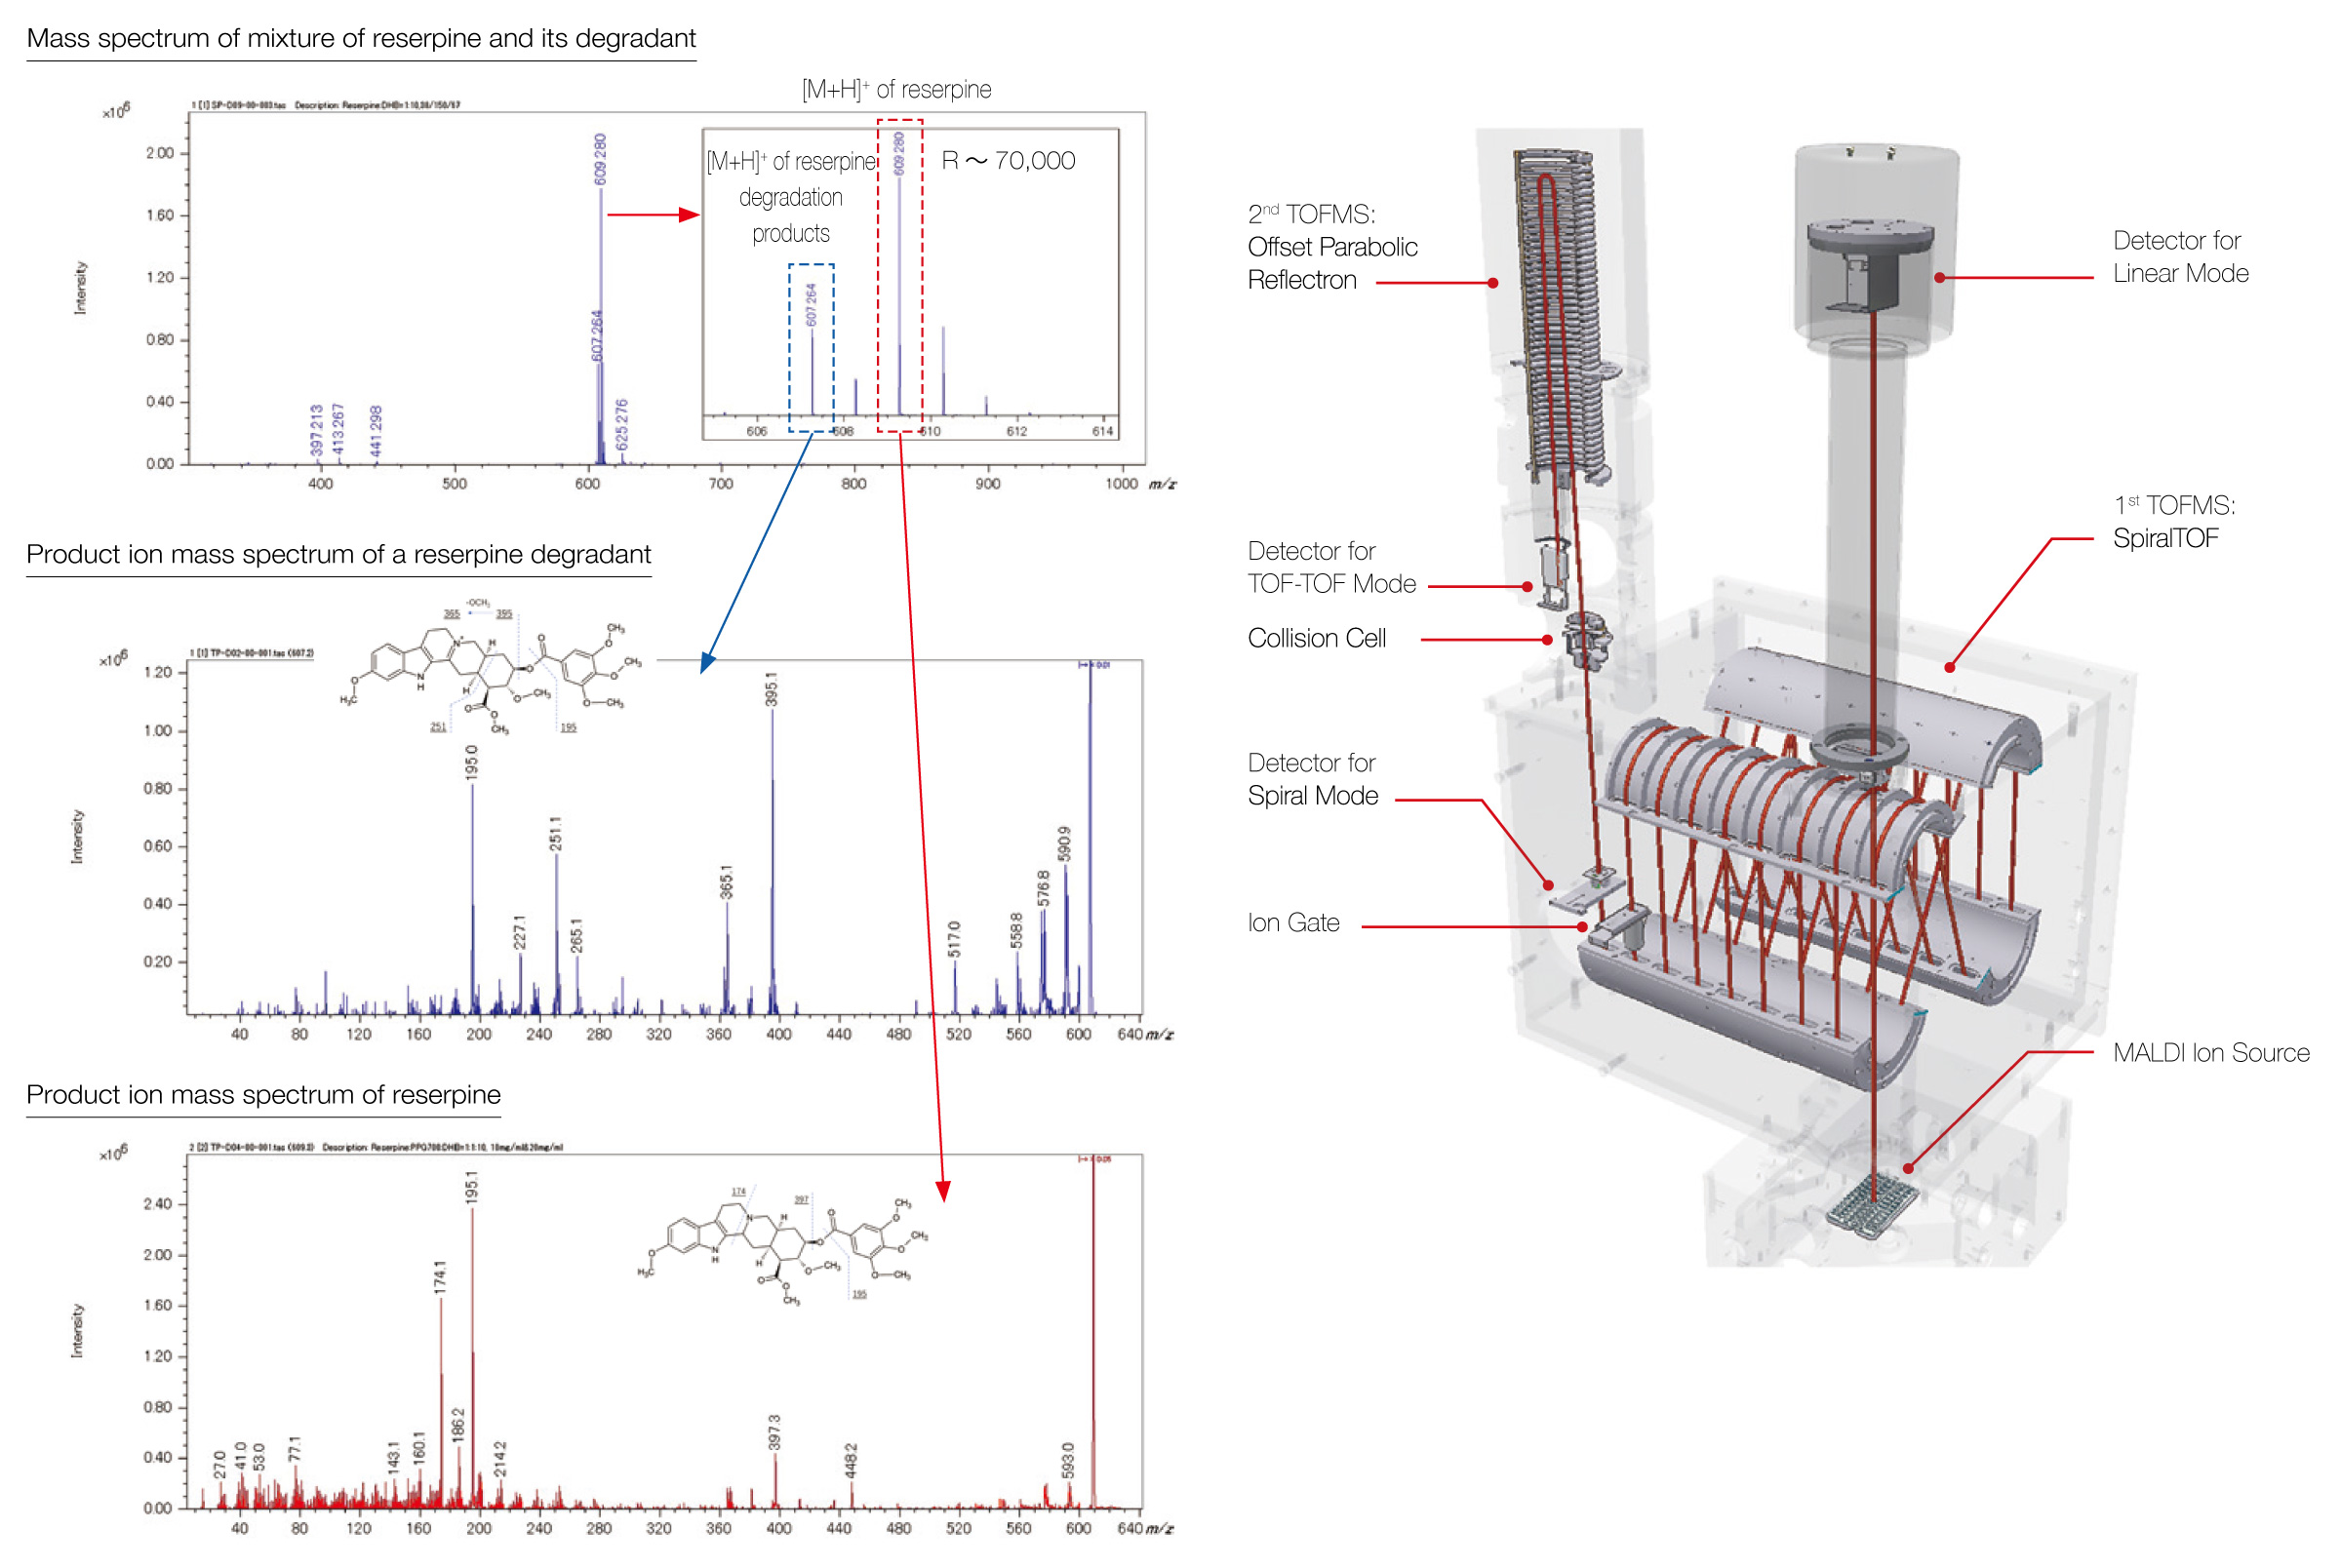
The TOF-TOF option extends the analytical power of the NewSpiralTOF™ by using SpiralTOF ion optics in the first MS stage, enabling high precursor-ion selectivity and accurate selection of the monoisotopic precursor ions. Combined with high energy collision-induced dissociation (HE-CID), the system generates product-ion spectra rich in structural information. JEOL's proprietary offset parabolic reflectron further strengthens TOF-TOF performance by allowing simultaneous acquisition of product-ion information from m/z 5 up to the precursor ion. This provides comprehensive fragment information and supports highly reliable structural analysis.
A representative example is the analysis of reserpine and its photodegradation product. Because reserpine is photolabile, its solution degrades under ordinary room light. The degradation product differs by 2 Da, suggesting the loss of two hydrogen atoms. Thanks to the high precursor selectivity of the TOF-TOF option, the NewSpiralTOF™ successfully acquired separate product-ion spectra for both reserpine and its degradation product directly from a mixture, enabling structural characterization of each species.
View details of this application
Linear TOF Option
With the Linear TOF option, ions travel directly from the ion source to the detector. If post-source decay occurs during flight, the resulting fragment ions and neutral species continue at the same velocity as the precursor and are detected as the same signal. This makes Linear mode particularly effective for the high-sensitivity analysis of high-mass compounds that are prone to PSD. Used together, Spiral mode and Linear mode broaden the range of analytes that can be measured.
The application examples are the confirmation of the molecular weight distribution of polymers above 100 kDa and the measurement of the molecular weight of immunoglobulin G (IgG), a glycoprotein of approximately 150 kDa.
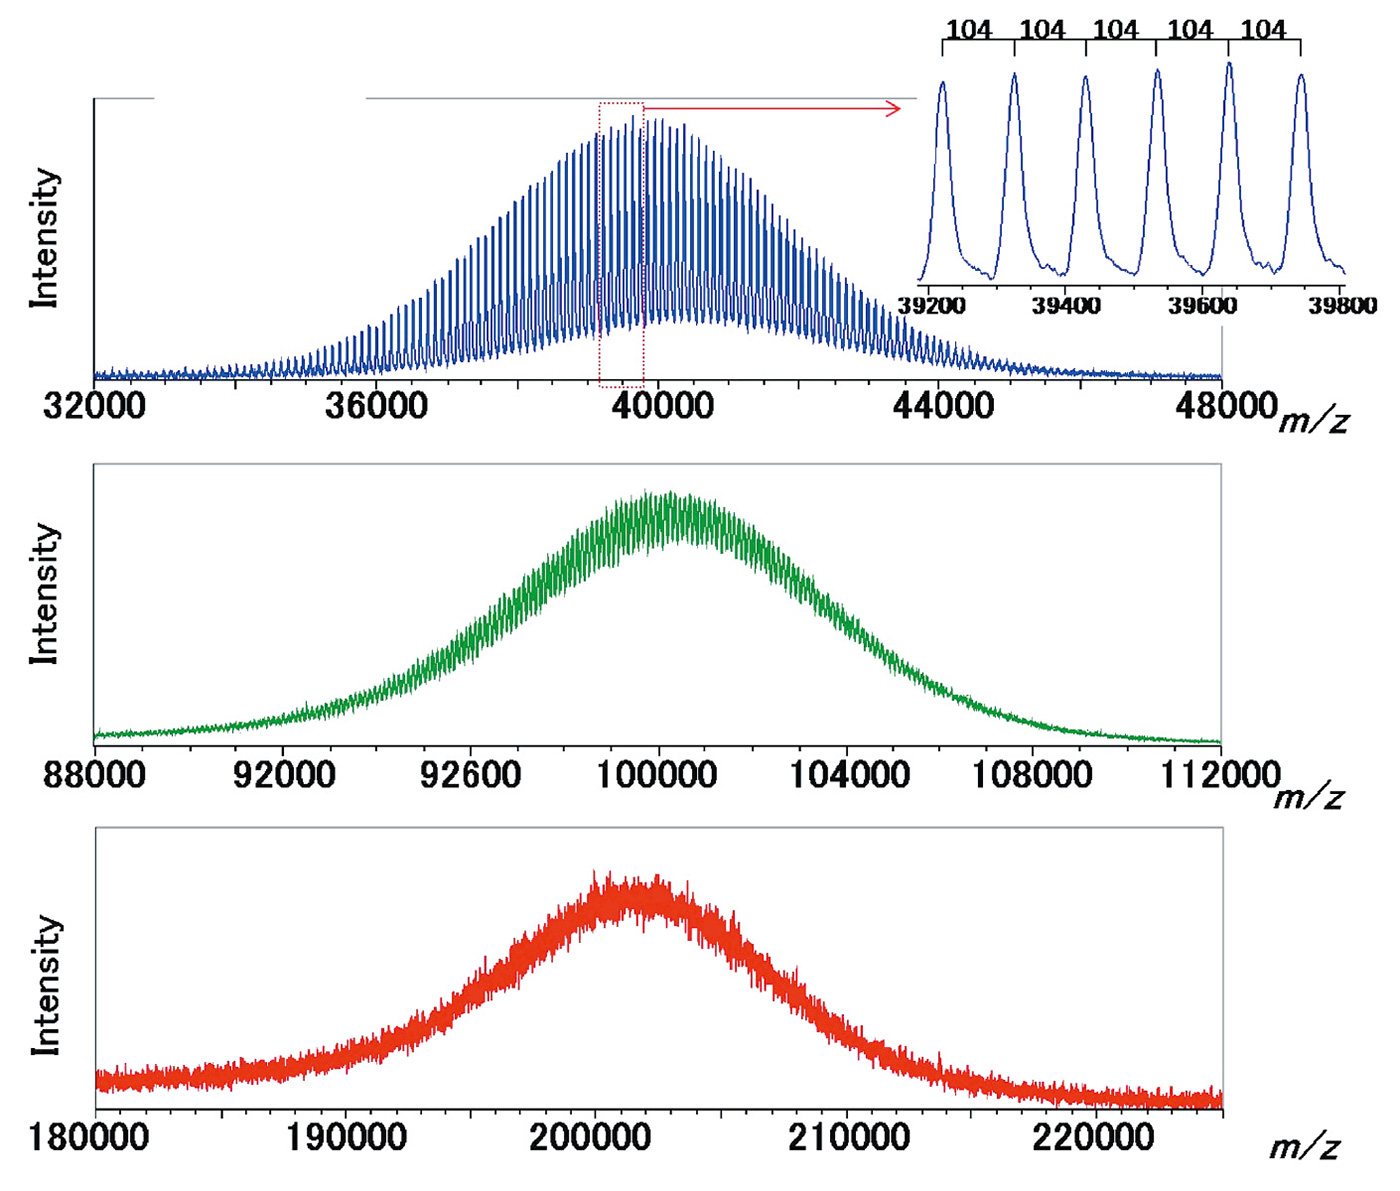
View details of this application
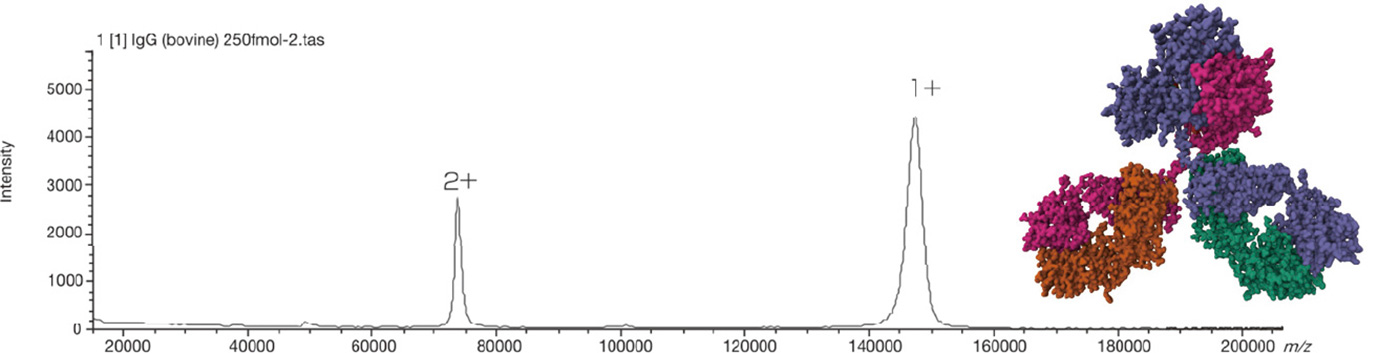
View details of this application
The 3D structure of IgG (PDB ID: 1IGY) based on L.J. Harris, et al., J Mol Biology , 275: 861-872 (1998), by using Mol* Viewer, D. Sehnal, et al., Nucleic Acids Research 49: W431-W437 (2021), available on RCSB PDB (RCSB.org), H.M. Berman, et al., Nucleic Acids Research 28: 235-242 (2000)
NewSpiralTOF™ Life Science Applications
Confident Protein Identifification by Peptide Mass Fingerprinting (MSTips No.166)
Peptide mass fingerprinting remains one of the most fundamental tools for protein identification. With its combination of high mass-resolution, high mass-accuracy, and high sensitivity, the NewSpiralTOF™ enables highly reliable protein identification with fewer false positives.
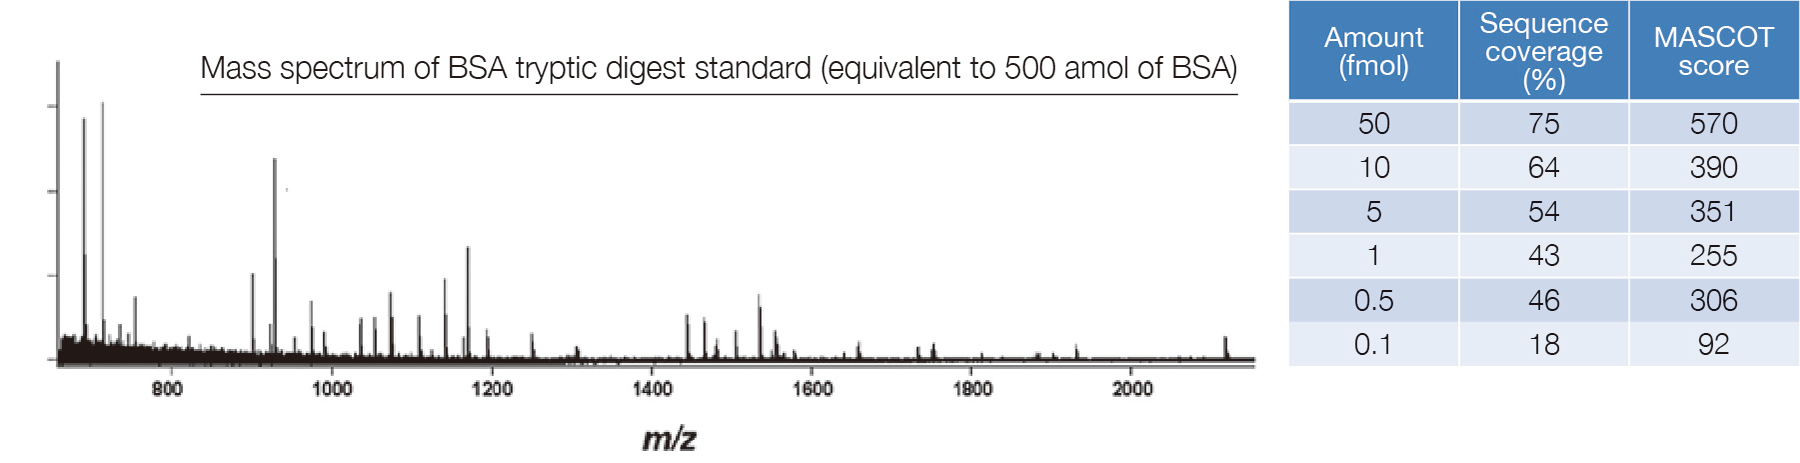
View details of this application
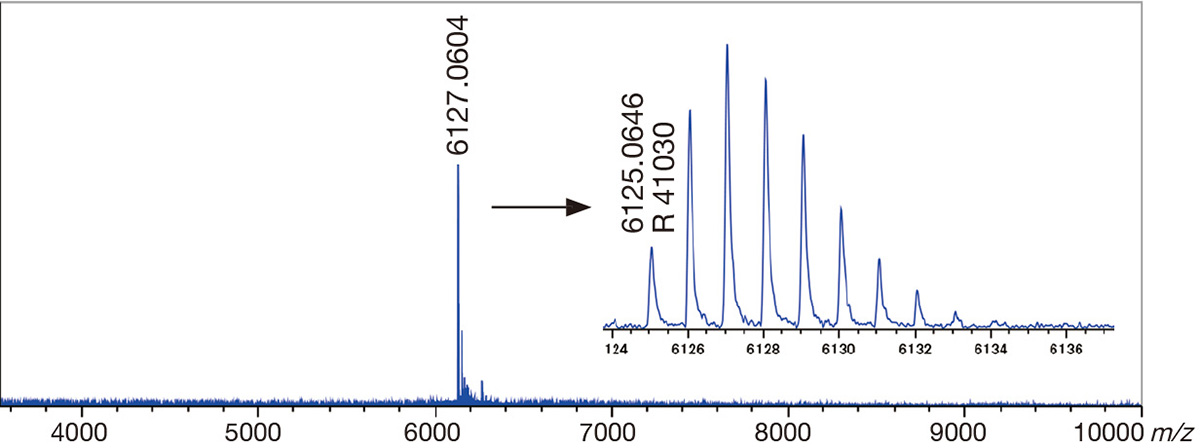
High-Resolution Protein Measurement (MSTips No. 297)
The system's high resolving power and sensitivity make it possible to measure intact proteins such as ubiquitin at high resolution, including clear detection of the protonated molecular ion.
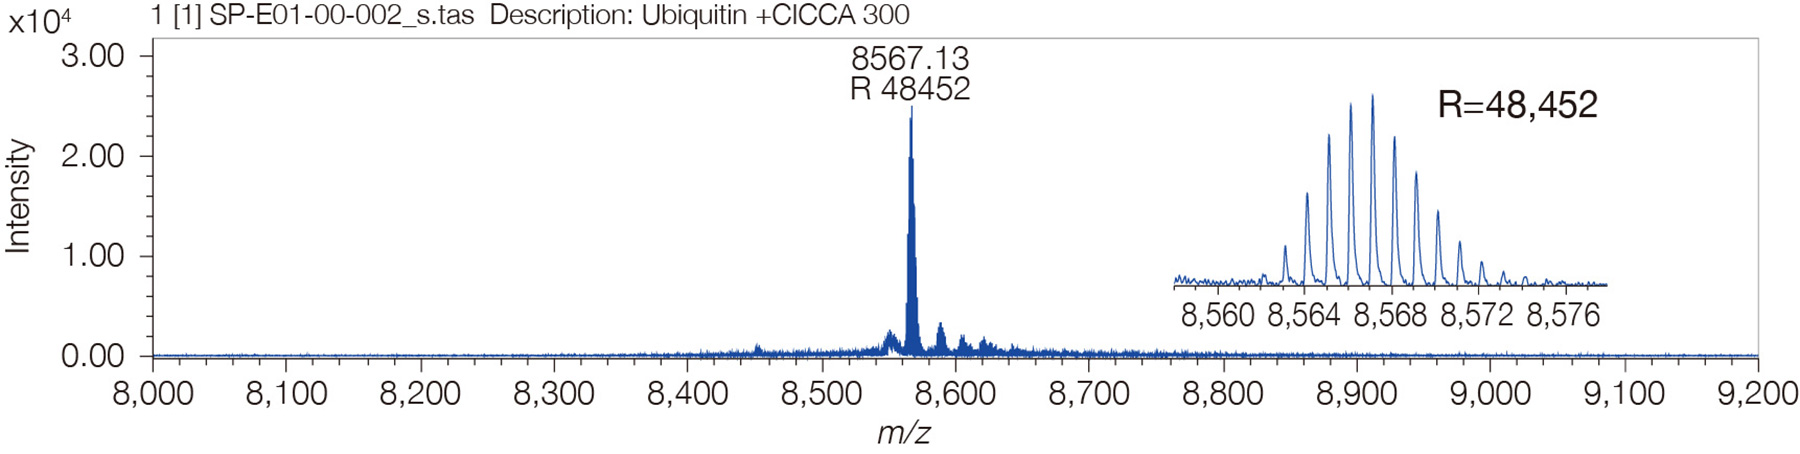
View details of this application
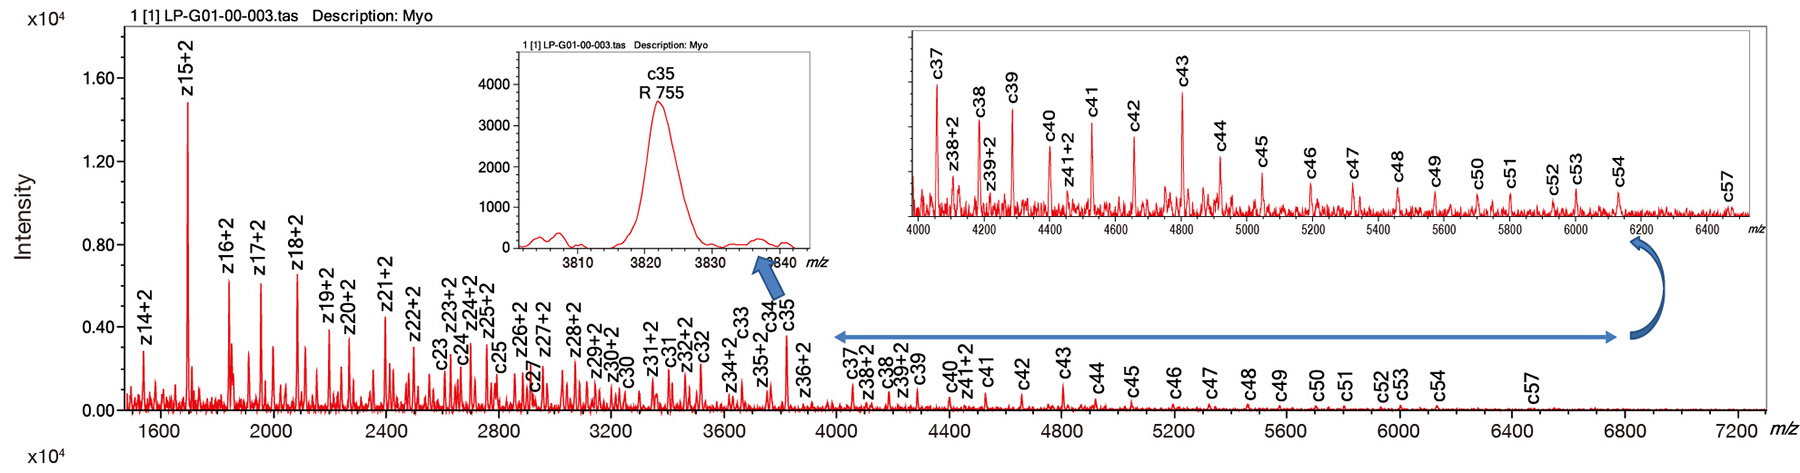
Rapid Sequence Confifirmation by In-Source Decay (ISD) (MSTips No. 229)
For rapid sequence confirmation of recombinant proteins, the in-source decay (ISD) method is highly effective. When used with MASCOT Server (including the Top Down option), the NewSpiralTOF™ can support sequence verification, as demonstrated for horse myoglobin.
View details of this application
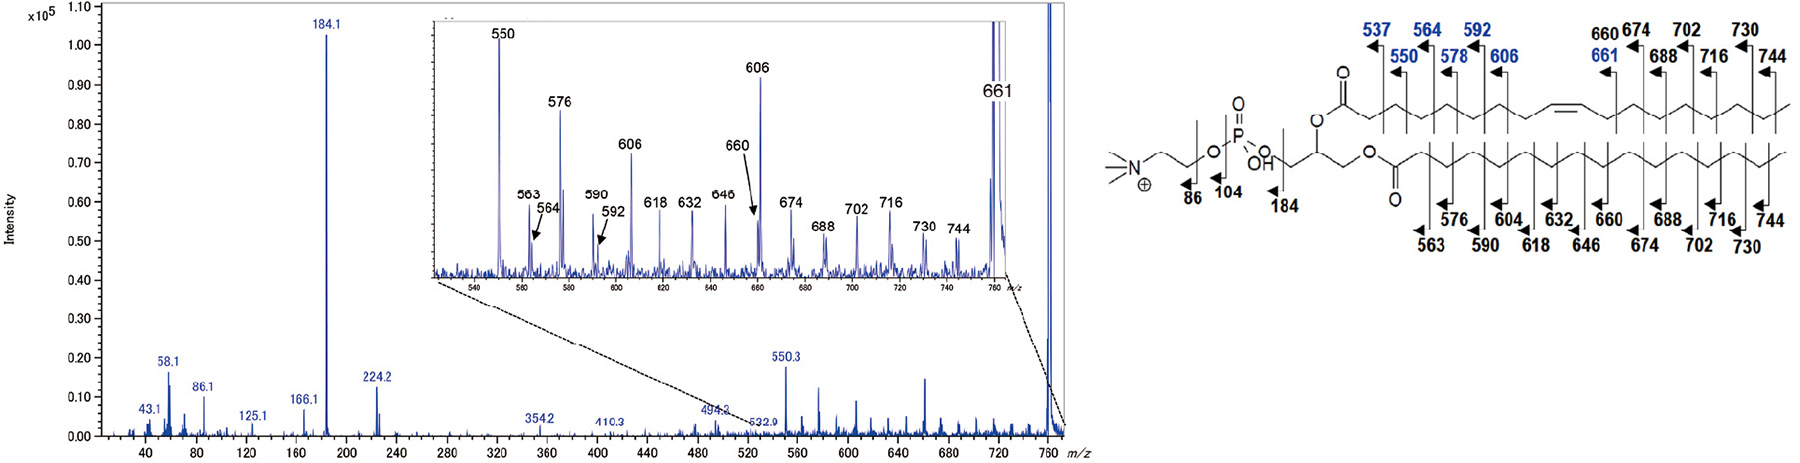
Structural Analysis of Phospholipids in Egg Yolk (MSTips No. 185)
The TOF-TOF option and HE-CID capabilities of the NewSpiralTOF™ also support structural analysis of complex lipid mixtures, including phospholipids extracted from egg yolk. High precursor selectivity makes it possible to isolate the correct ion and obtain informative fragmentation patterns for structural characterization.
View details of this application
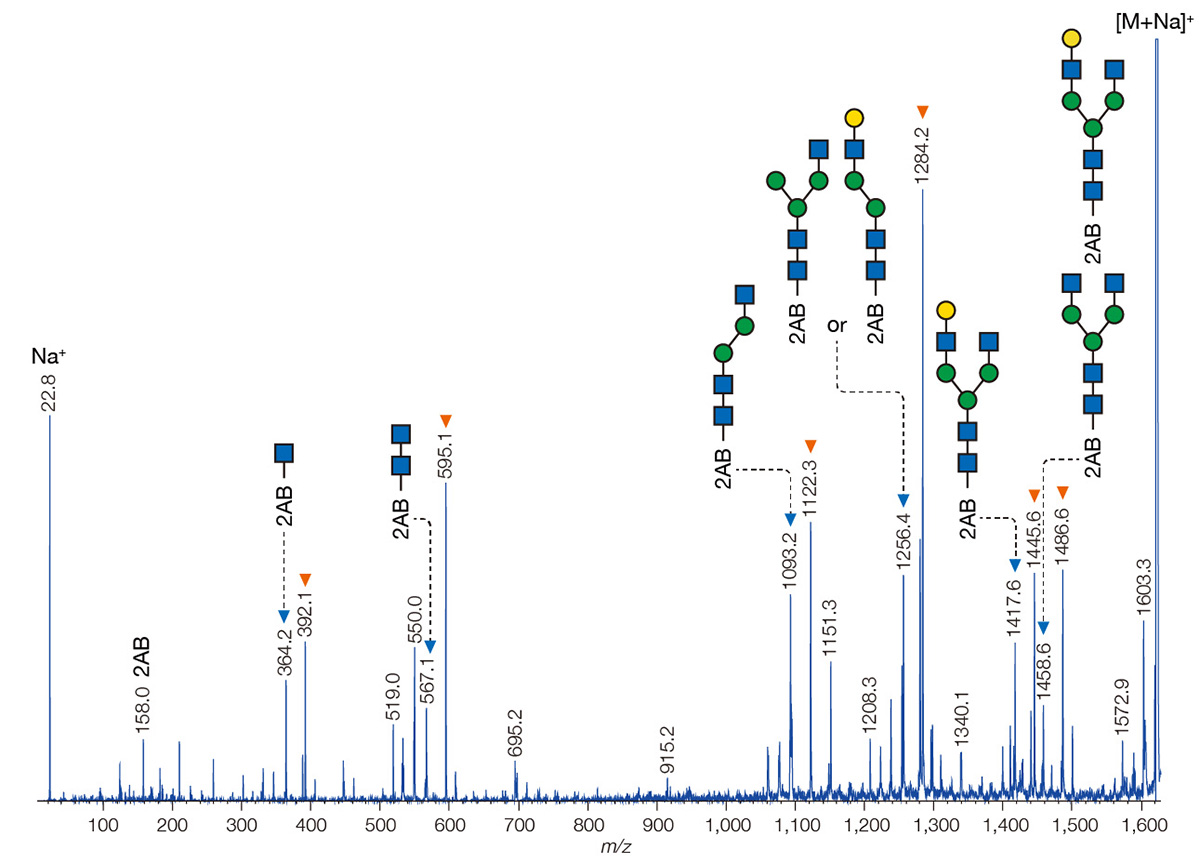
Structural Analysis of a Derivatized N-linked Glycan (MSTips No. 519)
In glycan analysis, labeling the reducing end with a fluorescent tag is common for HPLC workflows, and many such labels also improve ionization efficiency in MALDI and ESI. The structural analysis of glycans labeled with 2-aminobenzamide (2-AB) using the NewSpiralTOF™, including the TOF-TOF option, is shown below.
View details of this application
Confirmation of a Synthesized Oligonucleotide (MSTips No. 364)
The instrument's high mass-resolution and mass-accuracy also make it possible to confirm the elemental composition of synthetic oligonucleotides, expanding its usefulness into nucleic acid analysis.
View details of this application
View life science applications notebook
NewSpiralTOF™ Chemistry and Materials Applications
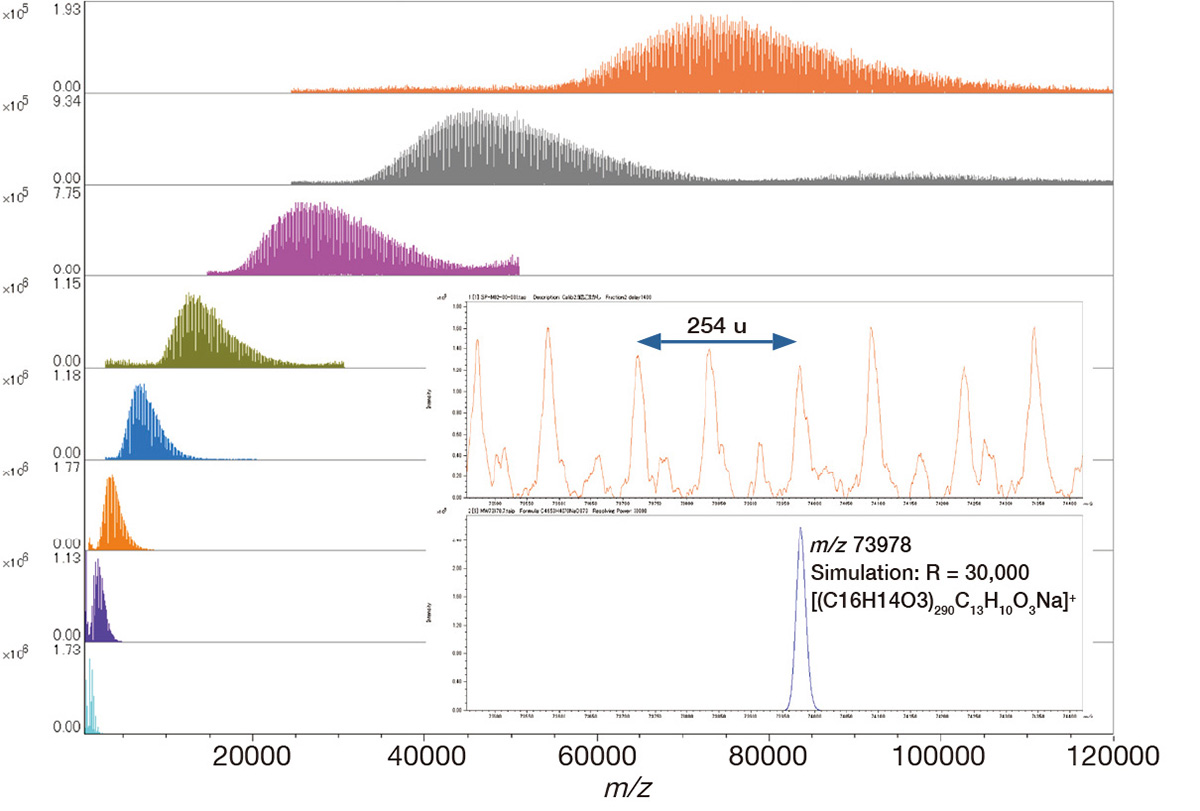
End-Group Analysis of High-Molecular-Weight Polymers up to 100 kDa (MSTips No. 527)
With a wide mass range of m/z 4 -120,000 in Spiral mode, combined with high resolution and high mass-accuracy, the NewSpiralTOF™ enables end-group analysis of polymers with molecular weights exceeding 100,000, including polycarbonate.
View details of this application
View polymeric materials applications notebook
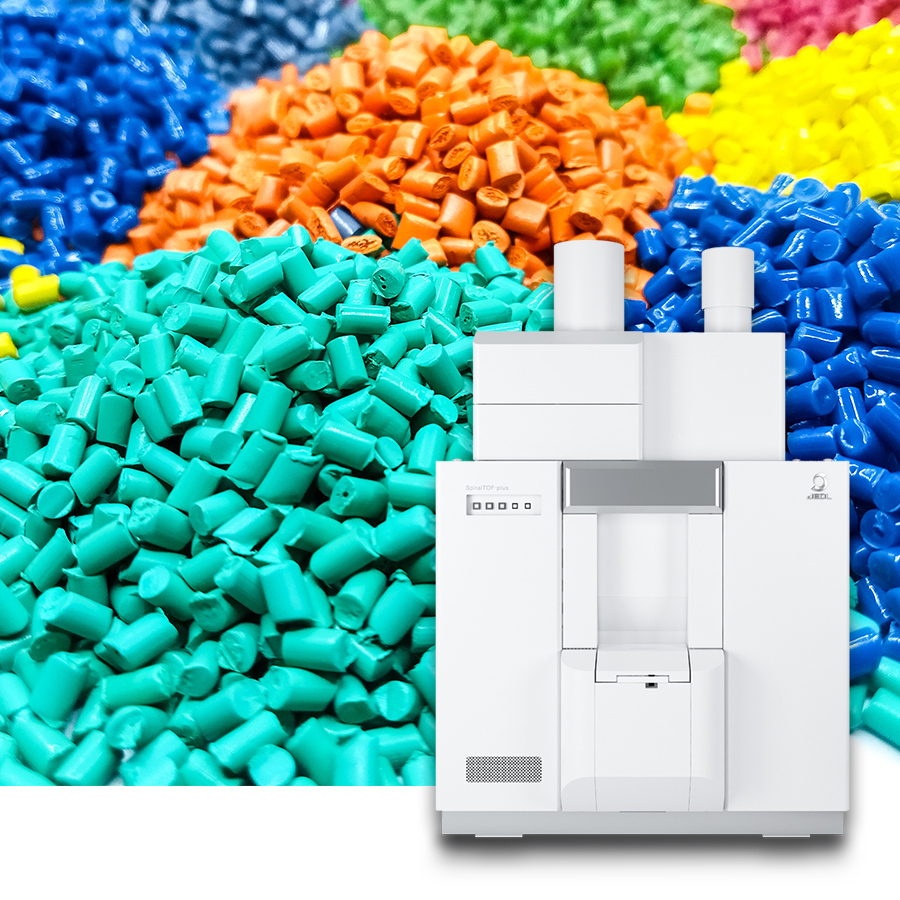
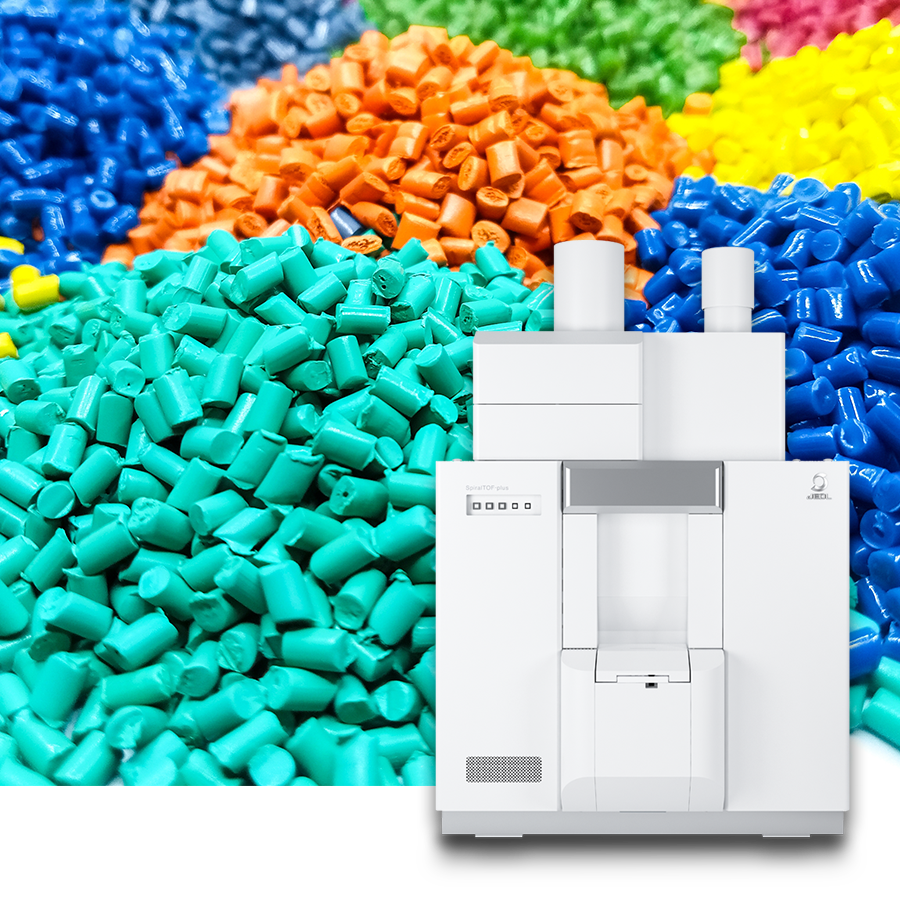
JMS-S3000 NewSpiralTOF™ Polymer Analysis System
The combination of the JMS-S3000 NewSpiralTOF™'s high mass resolution, high mass accuracy, and wide dynamic range with the msRepeatFinder polymer analysis software makes it the most powerful polymer analysis system.
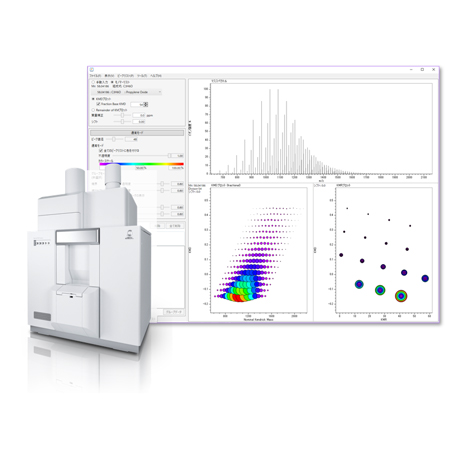
msRepeatFinder (Option)
The Kendrick Mass Defect (KMD) plot and the Kendrick Mass Remainder (KMR) plot are used to estimate the polymer species and end groups contained in polymer materials from a complex mass spectrum and clarify their identity. In addition, the differential analysis function between two samples is effective in verifying sample degradation, lot-to-lot differences, and differences in the synthesis process.
Accurate Mass Measurement of Covalent Supramolecule of >9 kDa (MSTips No. 369)
The system also supports accurate mass measurement of covalent supramolecules above 9,000 Da, with errors reported at below 0.1 ppm. This level of performance contributed to work published in the Journal of the American Chemical Society (JACS) *.
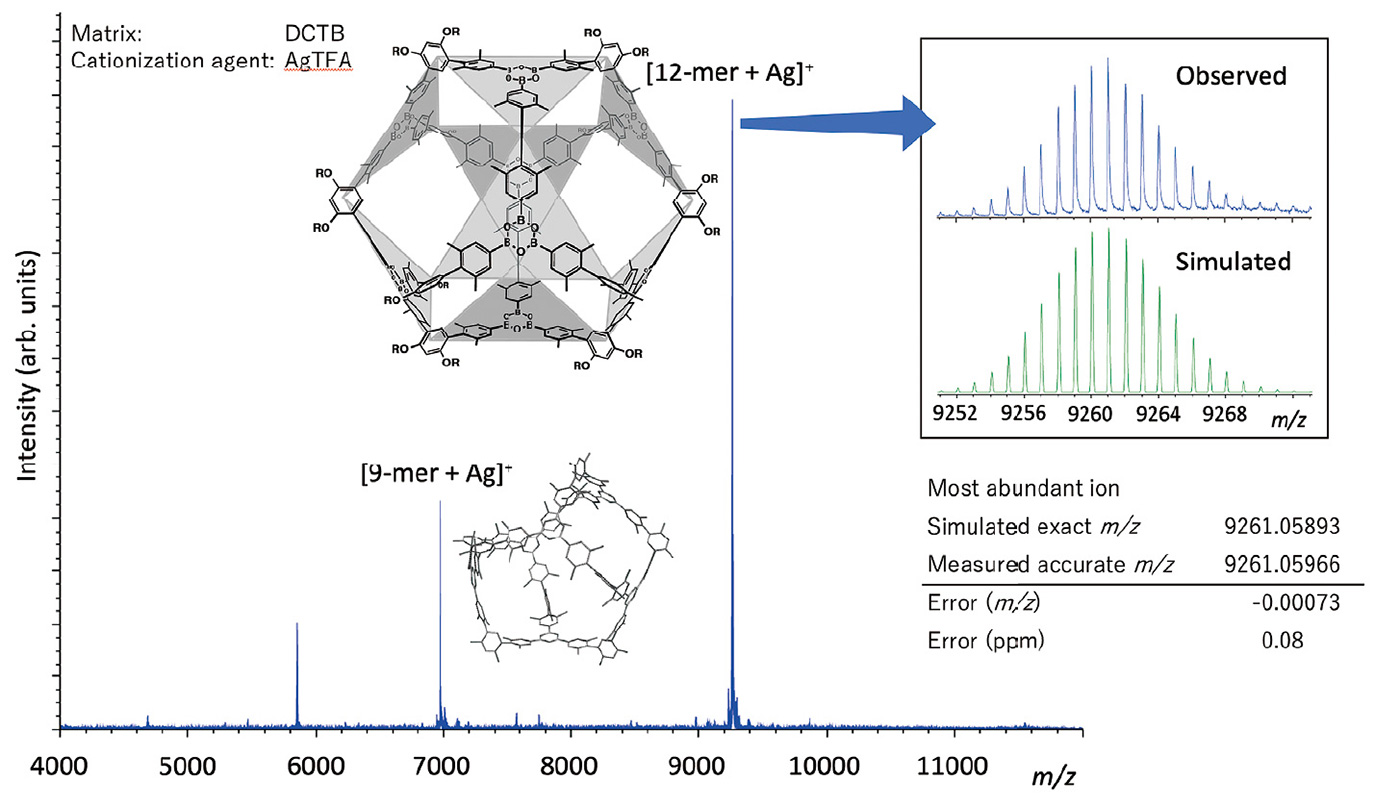
(Sample courtesy of Prof. Iwasawa, The Tokyo Institute of Technology)
* Ono, K. et al. Self-Assembly of Nanometer-Sized Boroxine Cages from Diboronic Acids. Journal of the American Chemical Society, 137 (22), 7015-7018 doi:10.1021/jacs.5b02716 (2015)
View details of this application
View organic chemistry applications notebook
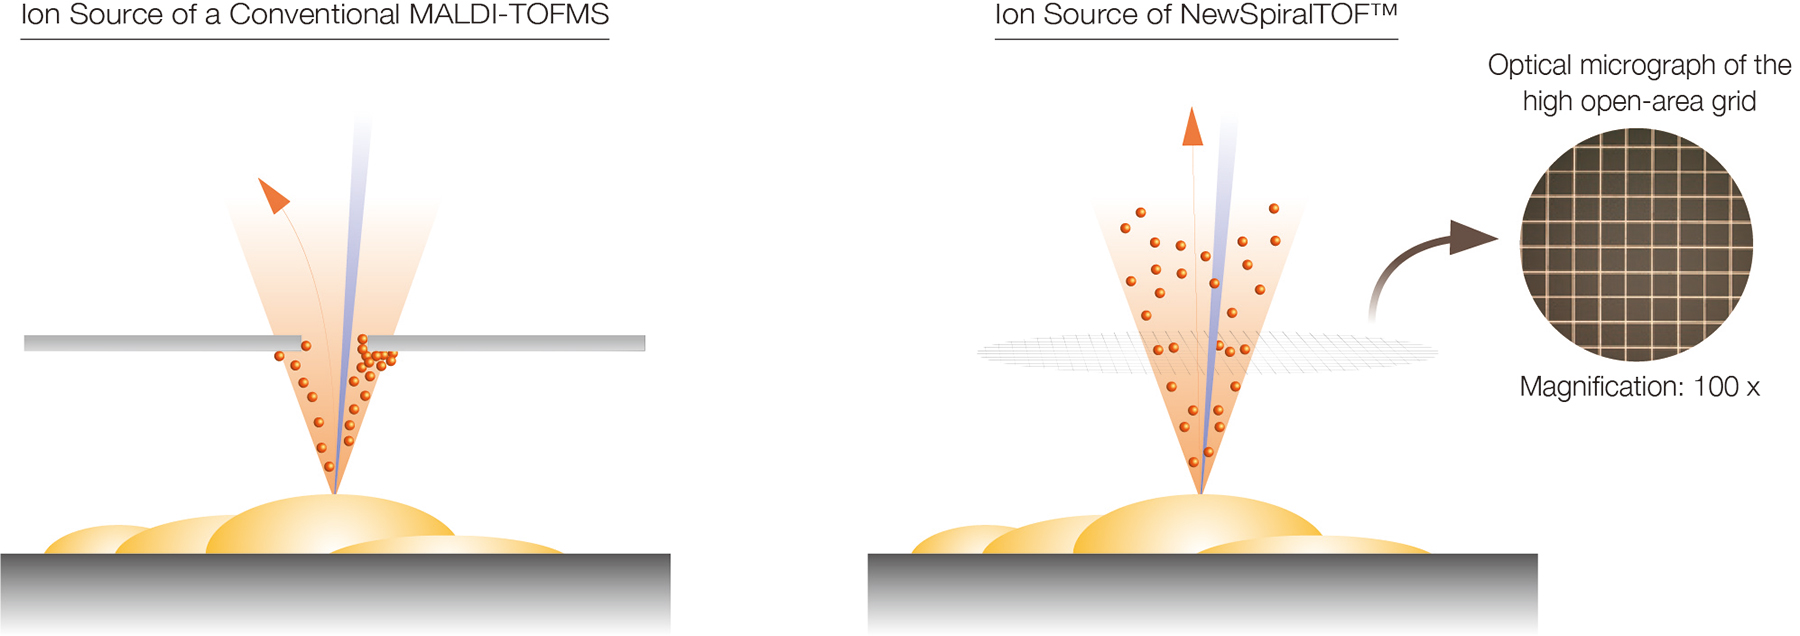
Stable Performance with a Contamination-Resistant Ion Source
In MALDI ion sources, much of the desorbed matrix leaves the target as neutral particles, and some of this material adheres to the ion extraction electrode. In conventional MALDI-TOFMS systems, contamination can accumulate unevenly on the aperture lens, leading to uneven charging and deflection of ion trajectories. This degrades both sensitivity and mass resolution, making frequent cleaning necessary.
To overcome this issue, the NewSpiralTOF™ uses a fine, high open-area (> 82%) ion extraction grid. Because less contamination accumulates overall, and because the ion-optical properties of the grid reduce the impact of any charge that does build up, ion trajectories remain stable even over long-term use. The result is maintenance-free operation with sustained high sensitivity and high mass-resolution.
Research Publications Using JMS-S3000
Catalogue Download
Related Products
JMS-S3000 NewSpiralTOF™ Polymer Analysis System
The combination of the JMS-S3000 NewSpiralTOF™'s high mass resolution, high mass accuracy, and wide dynamic range with the msRepeatFinder polymer analysis software makes it the most powerful polymer analysis system.
JMS-S3000 NewSpiralTOF™ Mass Spectrometry Imaging System
MALDI MS imaging has expanded from proteins/peptides to small molecules such as lipids and pharmaceuticals, where matrix and surface interferences can obscure analyte signals in conventional MALDI-reflectron TOFMS. High mass-resolving power is key to reliable spatial mapping, making the NewSpiralTOF™ indispensable for MALDI MS imaging.
◆Click the play button in the above box to watch the video. (3min 30sec.)◆
Applications shown in the movie:
Distribution of lipids (phospholipids and fatty acids) in thyroid cancer tissues
Mass spectrometry imaging on mixed conductive/non-conductive substrate using JMS-S3000 SpiralTOF™
Other mass spectrometry imaging applications are here.
More Info
Are you a medical professional or personnel engaged in medical care?
No
Please be reminded that these pages are not intended to provide the general public with information about the products.