JMS-S3000 SpiralTOF™-plus 3.0
Polymer Analysis System
Features
◆ Clicking the Play button starts the video (approx. 4 minutes). ◆
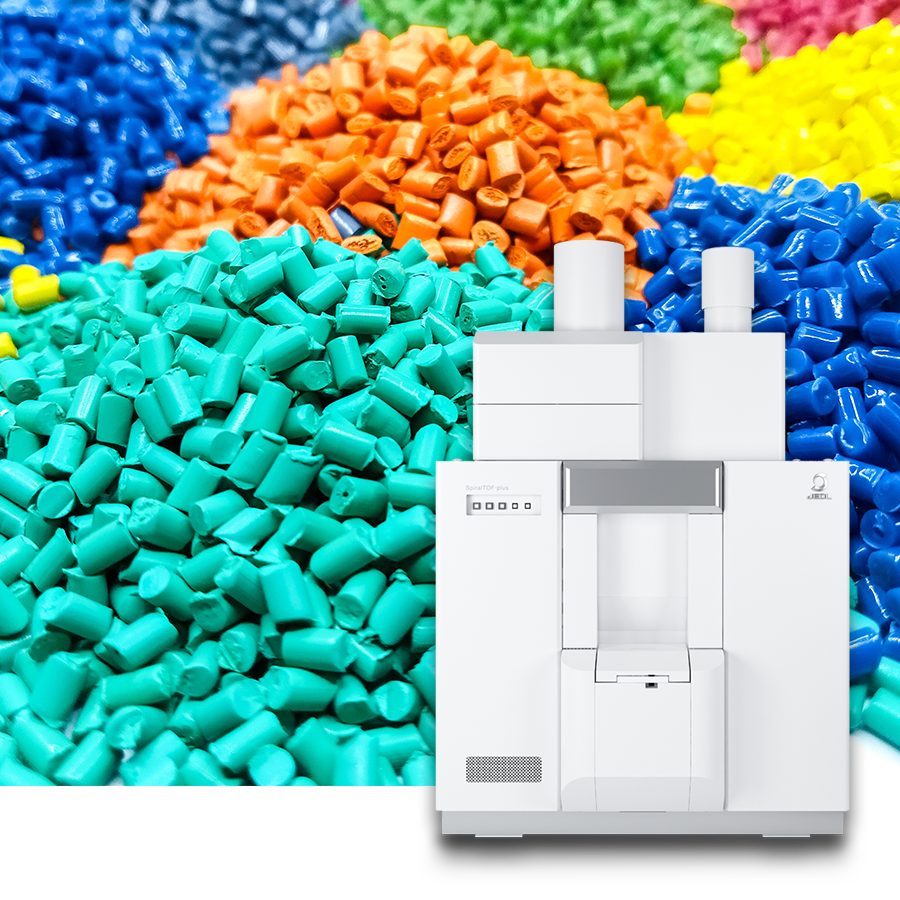
A MALDI-TOFMS ideal for polymer analysis
The JMS-S3000 SpiralTOF™-plus 3.0 is a matrix-assisted laser desorption/ionization time-of-flight mass spectrometer (MALDI-TOFMS) with ultra-high mass resolution and high sensitivity that employs JEOL's proprietary SpiralTOF ion optical system. Its high mass resolution, high mass accuracy, and wide dynamic range make it ideal for the analysis of synthetic polymers.
Synthetic polymers are polydisperse which means that they have a molar mass distribution. As a result, homopolymers with a variety of end groups and copolymers are highly complex mixtures. Therefore, it is important to maintain ultra-high mass resolution over a wide mass range for the analysis of synthetic polymers. It is also important to resolve trace components from major components and other unwanted interferences. The SpiralTOF™-plus 3.0 ion optics, which consists of energy-filtering electric sectors, eliminates chemical noise derived from post source decay (PSD) and resolves trace components from other sample components. Synthetic polymer analysis requires high mass-resolving power over a wide mass range and wide dynamic range with low chemical noise. The SpiralTOF™-plus 3.0 satisfies both requirements. Polymer mass spectra obtained with SpiralTOF™-plus 3.0 are extremely complex and contain a large amount of information, making it impractical to analyze them manually. The solution is msRepeatFinder, a state-of-the-art polymer analysis software.
Setting the new standard in MALDI-TOFMS performance
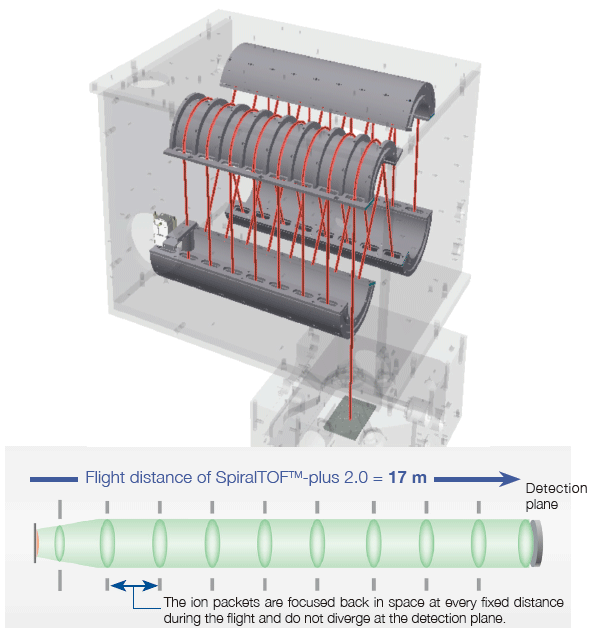
To improve the mass resolving power and mass accuracy of a time-of-flight mass spectrometer, the flight distance must be extended while keeping a group of ions having the same m/z (an ion packet) from diverging in space.
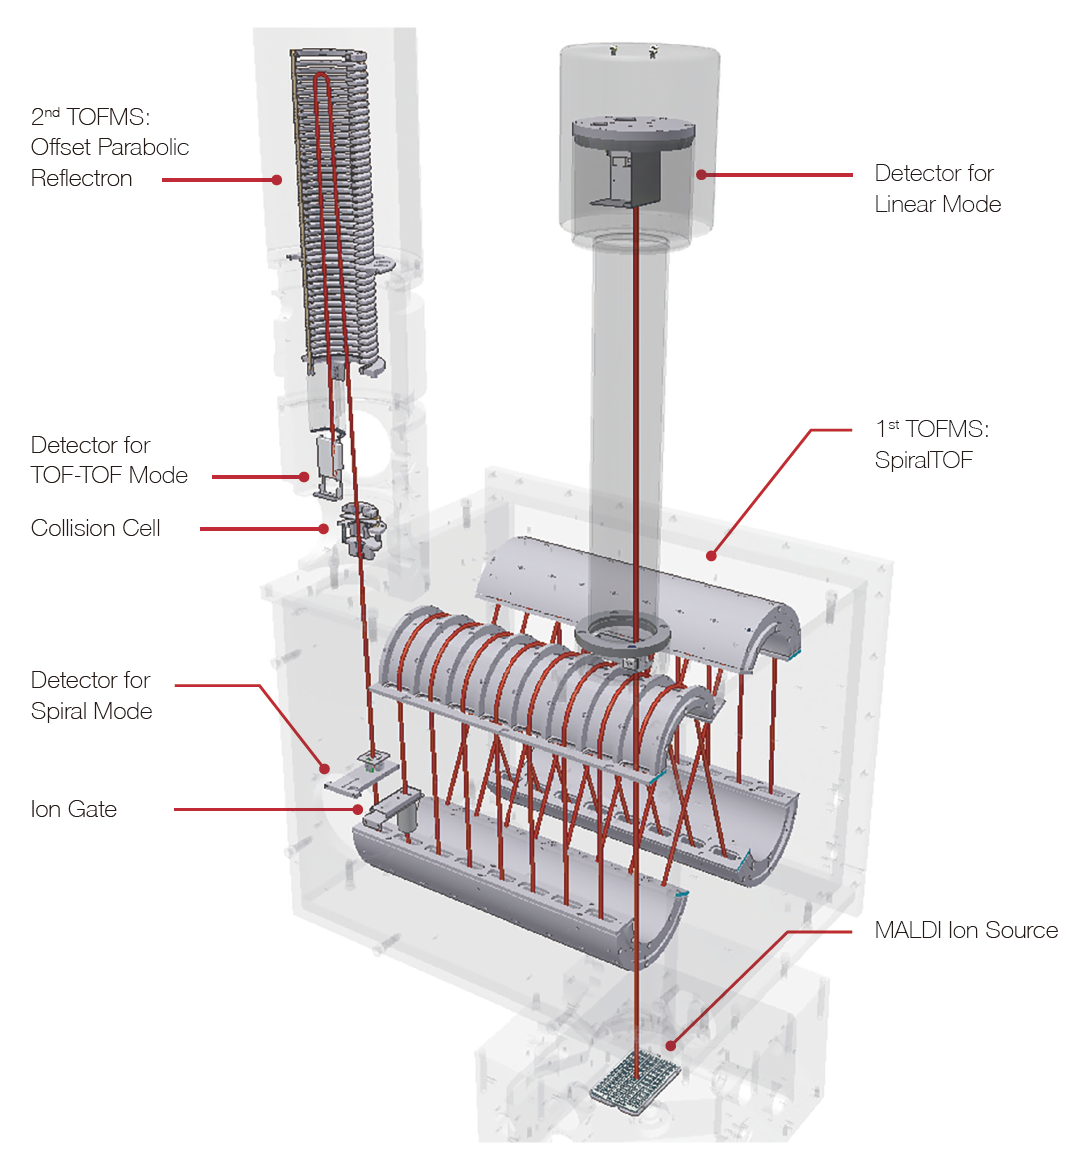
The innovative SpiralTOF ion optics was developed by JEOL based on the "Perfect focusing" and "Multi-turn" principles. The ion packets are focused back in space at every fixed distance (i.e., each figure-eight trajectory) during the flight. Thus, even after the extended flight distance, the ion packets do not diverge at the detection plane, achieving high mass resolving power, high mass accuracy, and high ion transmission.
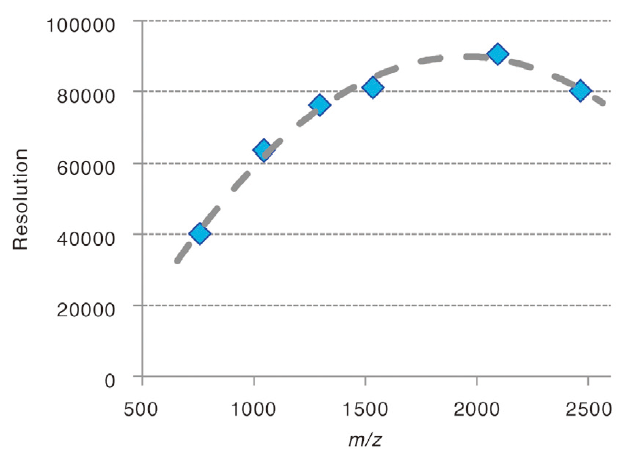
Mass resolutions observed with a mixture of peptide standards.
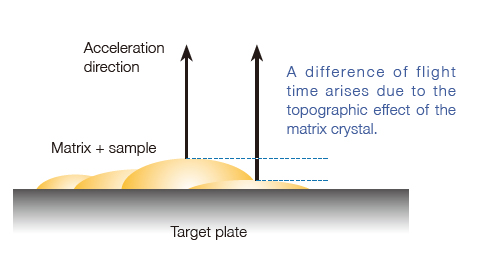
Reduced topographic effect of matrix crystal
The topographic effect of the matrix crystal leads to a difference in flight start position for the ions, resulting in a difference in flight time. In the conventional ion optical system, this time difference degrades the mass resolving power and also the mass accuracy obtained with external mass calibration. With its extended flight distance, the JMS-S3000 reduces this effect to the minimum and achieves highly reproducible mass resolving power and high mass accuracy with an external mass calibration.
Another consequence of this is that high mass-resolution and mass accuracy can be maintained for imaging analysis of a biological specimen in which a large number of mass spectra are acquired across a large specimen surface that is likely to be uneven.
Achieving a wide dynamic range
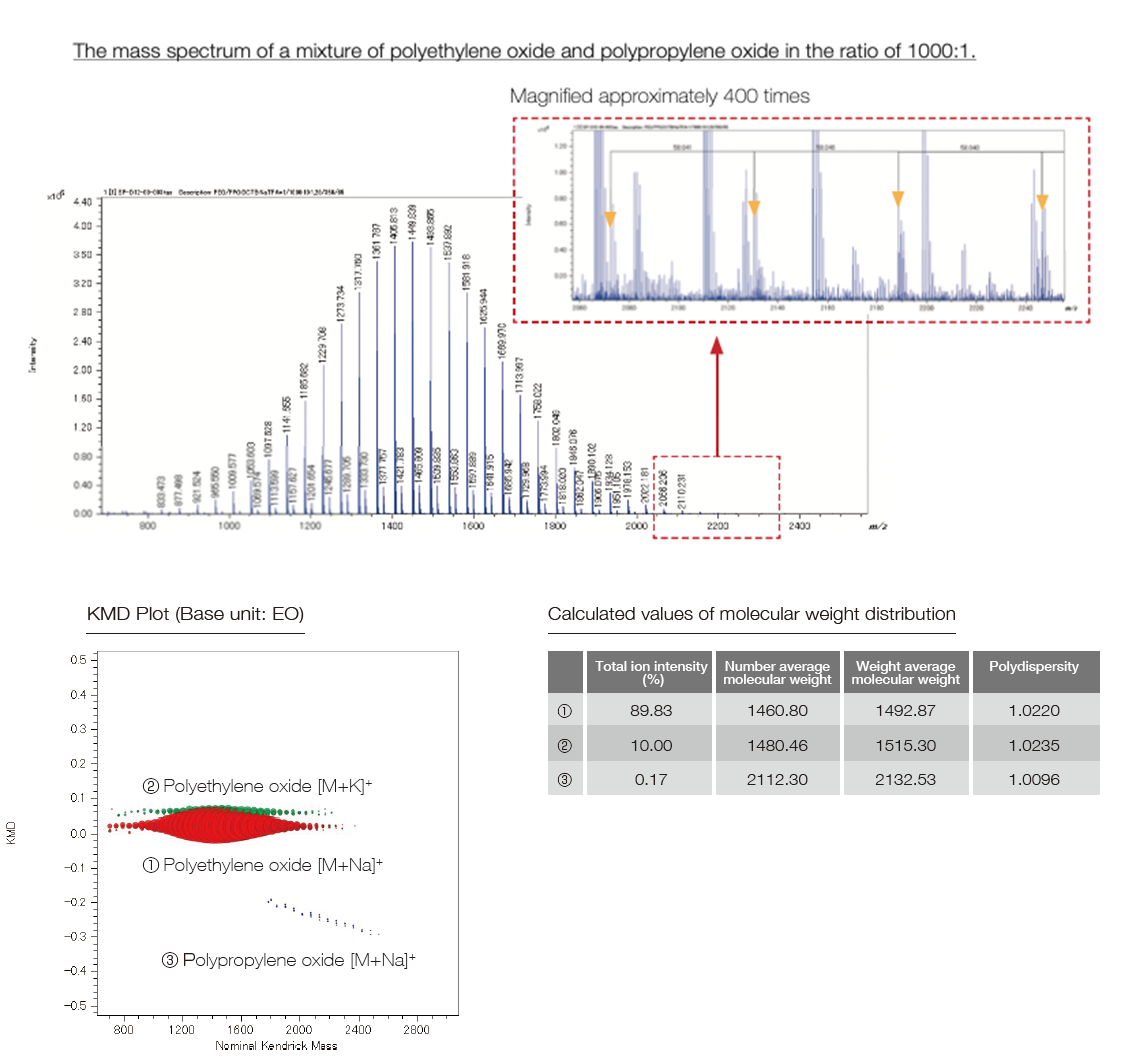
The SpiralTOFTM-plus 3.0 has realized a wide dynamic range by employing a 14-bit ADC (Analog-to-Digital Converter) for TOF signal processing. This makes it possible to simultaneously detect peaks with ion intensity differences of about 4 orders of magnitude. Also, the analysis of trace components has become easy in mass spectrometry imaging measurements, in addition to the conventional bulk sample measurements. Below is the measurement example of a mixture of polyethylene oxide and polypropylene oxide in the ratio of 1,000:1. In the case of polymer analysis, when combined with the Kendrick Mass Defect (KMD) analysis, it is possible to analyze trace components that are otherwise difficult to detect. In the example below, the trace component PPO was detected, and its average molecular weight etc. could be calculated.
The mass spectrum of a mixture of polyethylene oxide and polypropylene oxide in the ratio of 1,000:1.
Extended mass range for Spiral mode
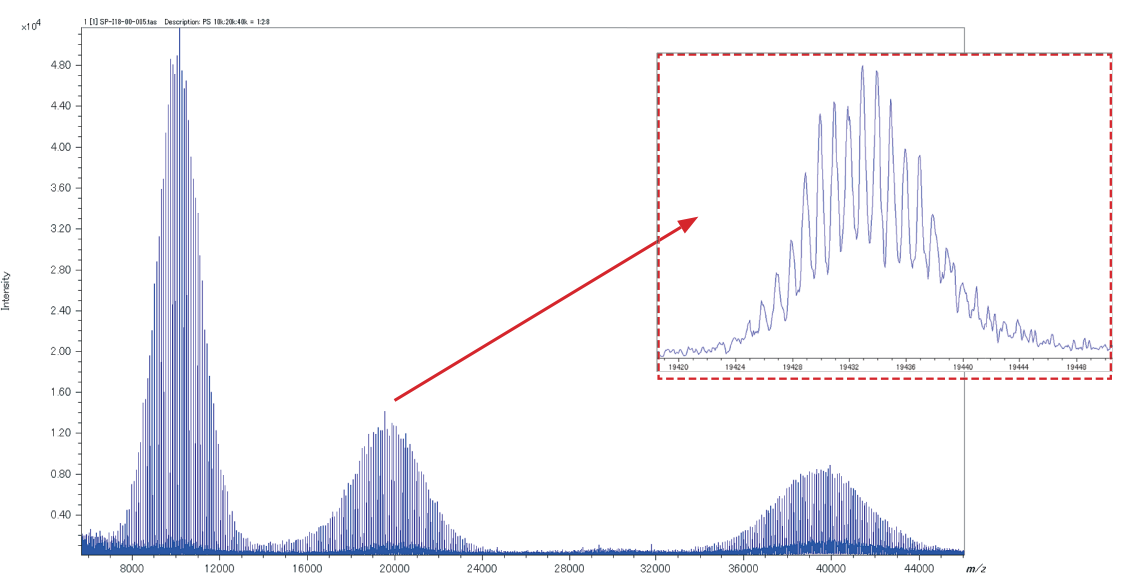
The new SpiralTOFTM-plus 3.0 extends the Spiral mode mass range from m/z 30,000 up to m/z 50,000, allowing a more precise analysis of higher molecular weight polymers.
Spiral mode, positive ion mass spectrum for a mixture of poly(styrene) (PS) 10 kDa, 20 kDa and 40 kDa
Features and usages of TOF-TOF option and linear TOF option
TOF-TOF option
Features
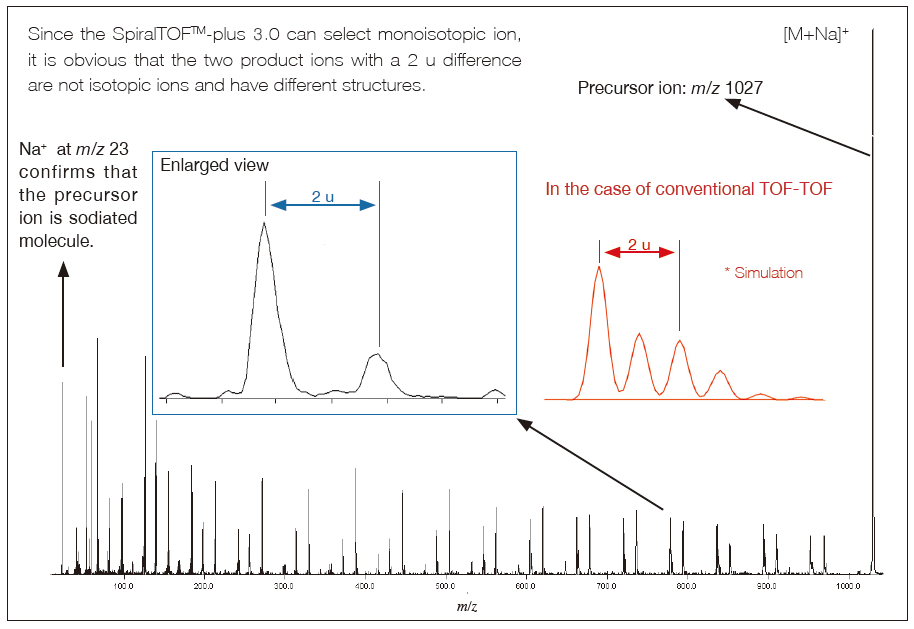
By adopting the SpiralTOF ion optics as the first MS, the high precursor ion selectivity can be realized. The monoisotopic peak of precursor ions can be properly selected.
High-energy collision-induced dissociation (HE-CID) allows for the acquisition of product ion mass spectrum rich with structural information.
JEOL's proprietary off set parabolic reflectron technology enables the acquisition of all product ion information from m/z 5 to the precursor ion, thus facilitating the production of highly reliable structural information.
Usage
In structural analysis of organic compounds, the accuracy of composition determination using accurate mass in Spiral mode can be improved by determining the adduct ion, in addition to the structural information obtained by HE-CID.
In elucidation of amino acid sequences of a peptide, distinguishing structural isomers such as leucine and isoleucine is possible, as a feature of HE-CID. It is also possible to confirm the presence / absence of amino acids in a peptide by the presence / absence of immonium ions.
For the analysis of additives, surfactants, and lipids, the structural analysis of alkyl chains is important. With HE-CID, it is possible to estimate the alkyl chain length and the positions of double bonds.
For structural analysis of polymers, it is possible to confirm the ion type (adduct ion) and the mass of the end groups from the product ion mass spectrum. Using this information with the Spiral mode elemental composition information, the accuracy can be improved even further for structure elucidation.
Product ion mass spectrum of poly(oxypropylene)
Linear TOF option
Features
In the Linear TOF option, the ions travel from the ion source to the detector unaffected.
When ions undergo post source decay (PSD) in flight, the produced fragment ions and neutrals continue to fly at the same velocity as before fragmentation. Hence, in a Linear mode mass spectrum, they are detected as the same signal as that of the ions that have not fragmented. Consequently, high molecular weight compounds that tend to undergo PSD can be measured with high sensitivity using Linear mode.
The combination of Spiral and Linear modes further expands the range of analytes that can be measured.
Usage
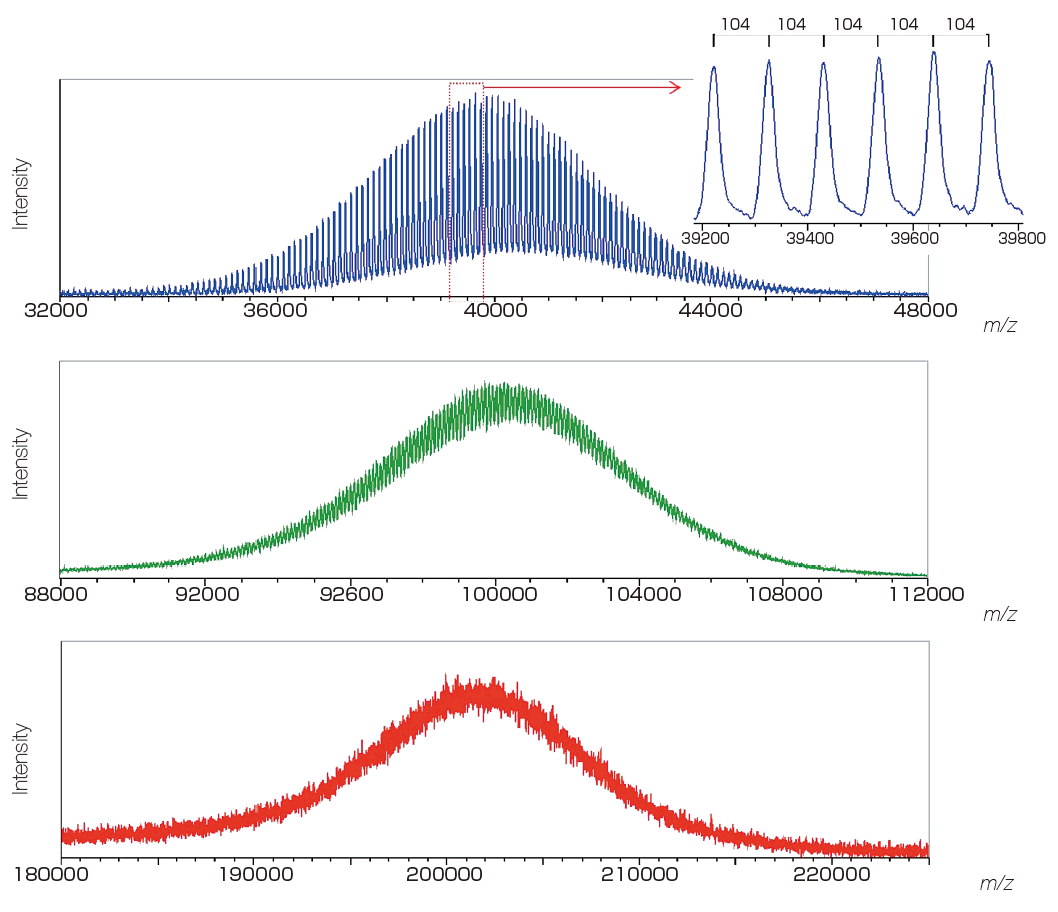
Useful for screening of molecular weight distribution of polymers.
It is possible to calculate the molecular weight distribution & polydispersity of polymer samples with various masses ranging from several thousands to several tens of thousands.
It is possible to measure high-mass samples of molecular weight over 10,000 Da such as intact proteins, with high sensitivity.
It enables high-sensitivity measurement of samples that can easily undergo PSD, such as proteins and polysaccharides.
Mass spectra of poly(styrene) 40K, 100K, and 200K
JMS-S3000 SpiralTOF™-plus 3.0 is ideal for Polymer Analysis
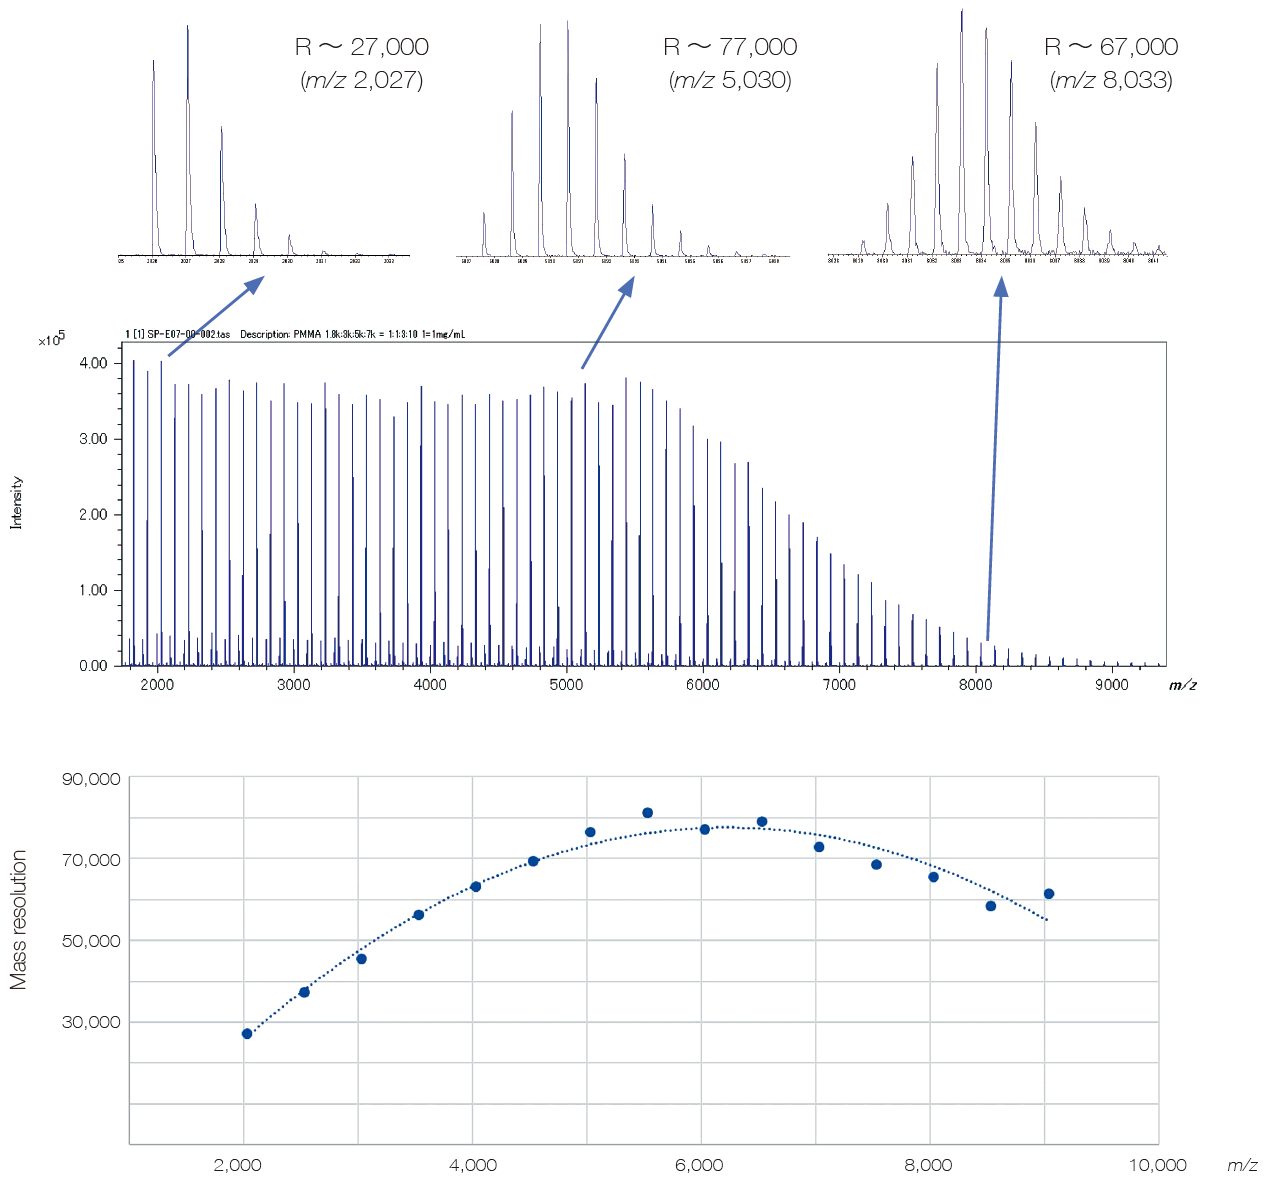
Industrial polymeric materials based on mixtures of polymers with different end groups or copolymers contain a wide variety of compounds. It is necessary to detect all the components in order to grasp the whole picture, which requires ultra-high mass resolution in a wide mass range. In addition, it is important to detect not only the base material but also trace components because multiple types of polymers and trace additives are blended for higher functionality.
With its wide dynamic range and ultra-high mass resolution over a wide mass range, SpiralTOF™-plus 3.0 is the solution that meets these requirements.
Elimination of post source decay (PSD) derived ions, which is a major feature of SpiralTOF ion optics, also contributes significantly to clear mass spectrum analysis.
We provide the most effective and unique solution for polymer analysis, which has become more and more complicated in recent years due to its high functionality and recycling.
Mass spectrum of polymethylmethacrylate (PMMA) (m/z 2,000 – 9,000)
End-group analysis of polymers
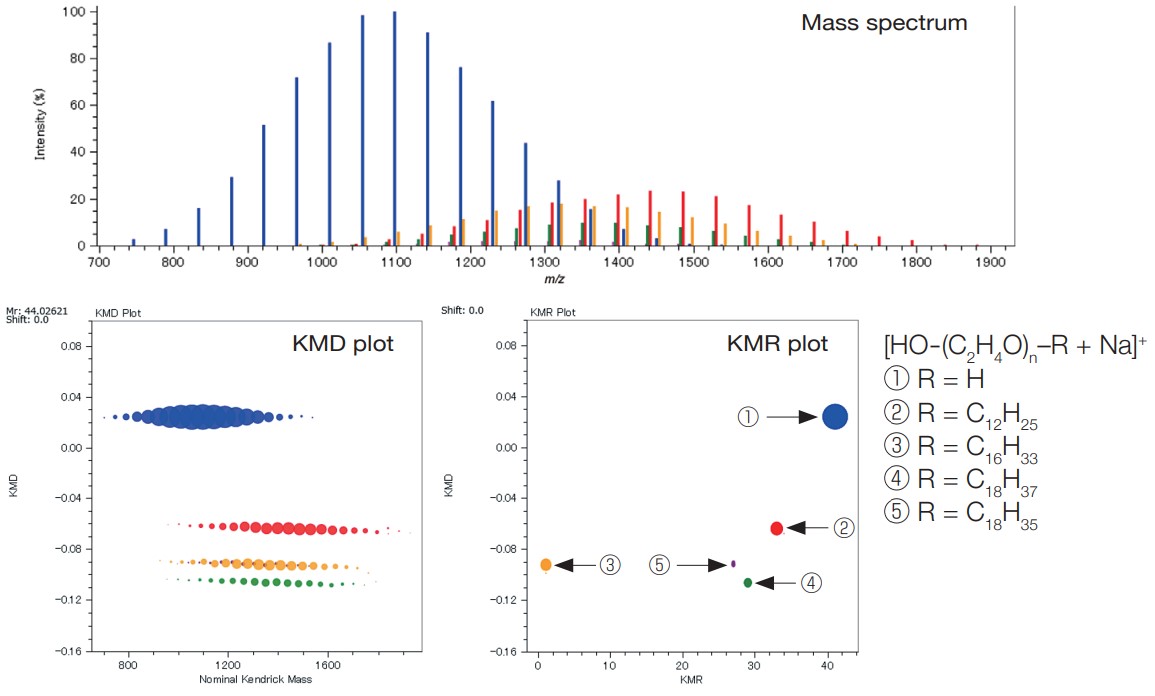
By applying the msRepeatFinder to the mass spectrum measured by JMS-S3000 SpiralTOF™-plus 3.0, mixtures of homopolymers with different end groups can be separated and grouped. It is also possible to search and group the points on the KMD plot by specifying the composition of the end groups. Relative ionic intensities and polymer index values are calculated for the grouped series as shown in the table.
In the example below, the KMD plot shows that there are at least four series with different end groups. By using the KMR (Kendrick Mass Remainder) plot, it is possible to confirm that there are actually five series.
MALDI mass spectrum, KMD plot and KMR plot of a polyethylene oxide mixture with different end groups
| Sum ofIntensities | Sum of Intensities (%) | No. average of molecular weight |
Weight average of molecular weight |
Dispersity | Monomer | End group α |
End group ω |
Adduct ion |
Charge | No. average degree of polymerization |
Weight average degree of polymerization |
Dispersity (degree of polymerization) |
|
|---|---|---|---|---|---|---|---|---|---|---|---|---|---|
| 1 | 826378 | 61.26 | 1092.769 | 1109.324 | 1.015 | C2H4O | H | OH | Na | 1 | 23.89 | 24.28 | 1.016 |
| 2 | 239802 | 17.78 | 1434.544 | 1453.005 | 1.013 | C2H4O | C12H25 | OH | Na | 1 | 27.832 | 28.323 | 1.018 |
| 3 | 174958 | 12.97 | 1347.449 | 1365.068 | 1.013 | C2H4O | C16H33 | OH | Na | 1 | 24.581 | 25.079 | 1.02 |
| 4 | 90119 | 6.68 | 1371.922 | 1387.459 | 1.011 | C2H4O | C18H37 | OH | Na | 1 | 24.5 | 24.949 | 1.018 |
| 5 | 17689 | 1.31 | 1280.546 | 1291.183 | 1.008 | C2H4O | C18H35 | OH | Na | 1 | 22.47 | 22.783 | 1.014 |
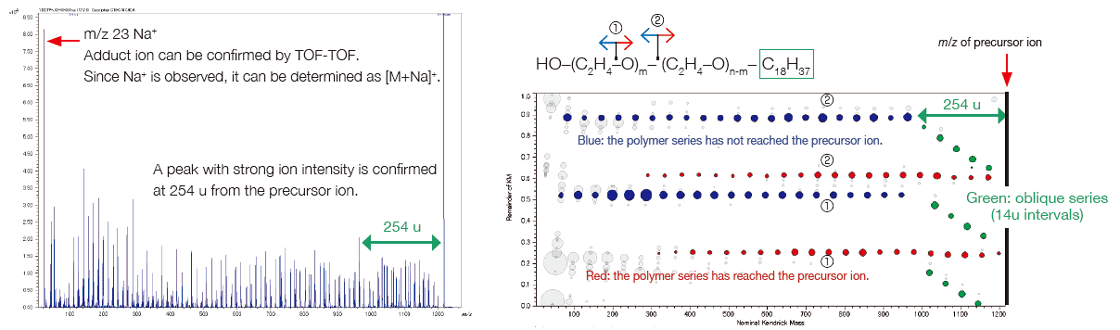
Elucidation of end-group structures from accurate mass measurement and MS/MS measurement (product ion mass spectrum)
msRepeatFinder can determine the elemental composition of the ions from the measured accurate mass. The result obtained for the elemental composition of the end group for group ④ is shown. The 4 candidates have the same elemental composition, but different degrees of polymerization. The information obtained from the product ion mass spectrum is utilized to narrow down the candidates. When a peak at m/z 23 is observed in the product ion mass spectrum, the precursor ion is recognized as being an Na adduct ion. The characteristic neutral loss indicates that the size of one end group is about 254 u while that of the other is relatively small. As a result, we could estimate that it was the polyethylene oxide which has an end group of C18H37/OH.
| No. | End group composition formula | Monomer | n | Adduct ion | Mass | DBE | Mass error (modulus; mDa) |
Mass error (mDa) |
Mass error (modulus; ppm) |
Mass error (ppm) |
|---|---|---|---|---|---|---|---|---|---|---|
| 1 | C16H34 | C2H4O | 22 | Na | 1217.83200 | -0.5 | 2.2767 | -2.2767 | 1.8695 | -1.8695 |
| 2 | C18H38O | C2H4O | 21 | Na | 1217.83200 | -0.5 | 2.2767 | -2.2767 | 1.8695 | -1.8695 |
| 3 | C20H42O2 | C2H4O | 20 | Na | 1217.83200 | -0.5 | 2.2767 | -2.2767 | 1.8695 | -1.8695 |
| 4 | C22H46O3 | C2H4O | 19 | Na | 1217.83200 | -0.5 | 2.2767 | -2.2767 | 1.8695 | -1.8695 |
Product-ion mass spectrum and RKM plot of group ④
Analysis of copolymers
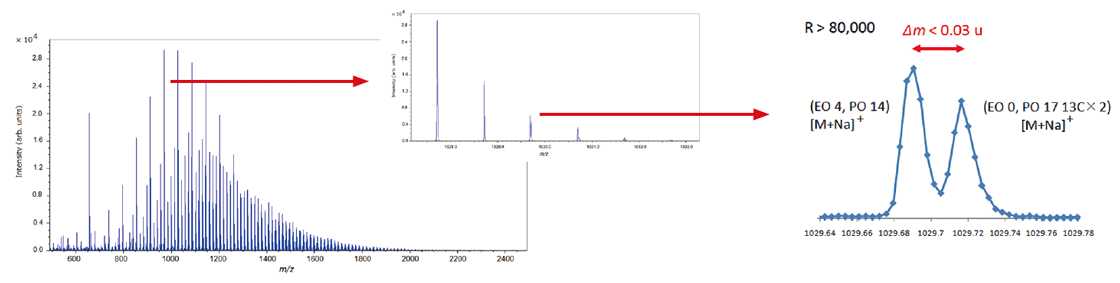
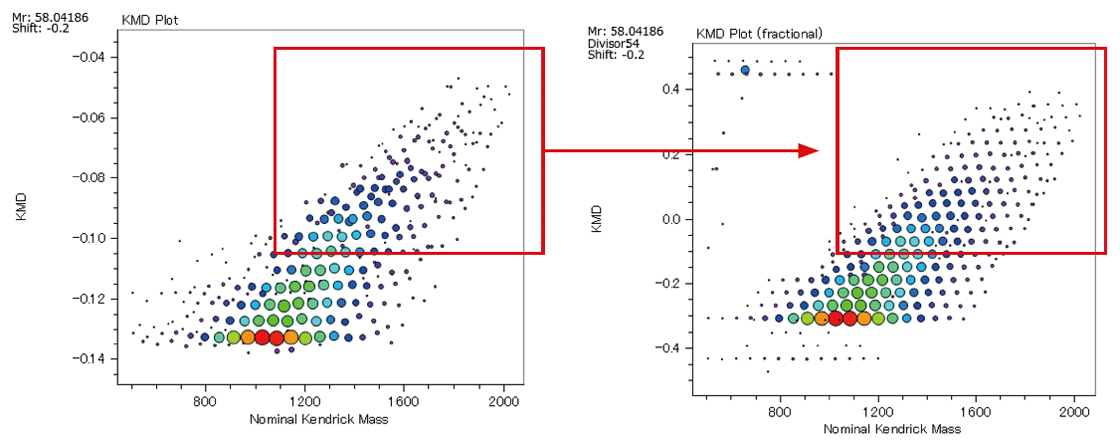
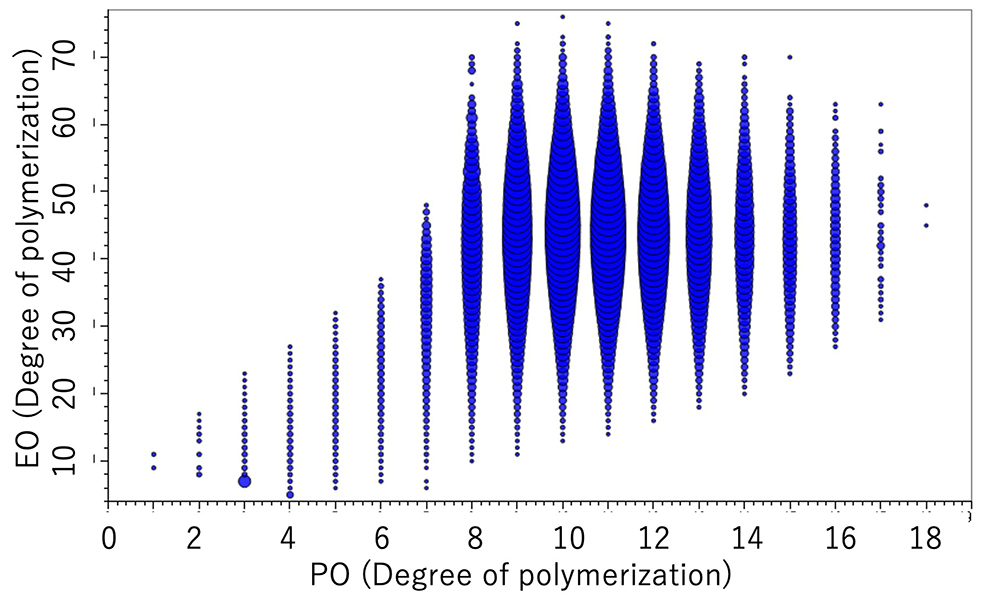
It is important to use high mass-resolution to analyze copolymers, which consist of two or more species of monomer. JMS-S3000 SpiralTOF™-plus 3.0 can separate many isobaric ion peaks (which have the same nominal mass but different accurate mass) on a mass spectrum. Since the mass spectra of copolymers are complicated, it is not practical to assign the peaks one by one. KMD analysis using msRepeatFinder makes it possible to visualize the distribution of polymer species. Below is the analysis example of an EO-PO block copolymer. The enlarged mass spectrum shows that peaks that are less than 0.03 u apart are clearly separated by a high mass-resolution. Visualizing the mass spectrum using a KMD plot (base unit: PO), a lattice is seen reflecting the PO distribution on the horizontal axis and the EO distribution in a diagonal direction.
In addition, Fraction Base KMD plots provide a clearer visualization of the polymer series than conventional KMD plots.
Mass spectrum of EO-PO block copolymer
KMD plot (left) / Fraction base KMD plot (right)
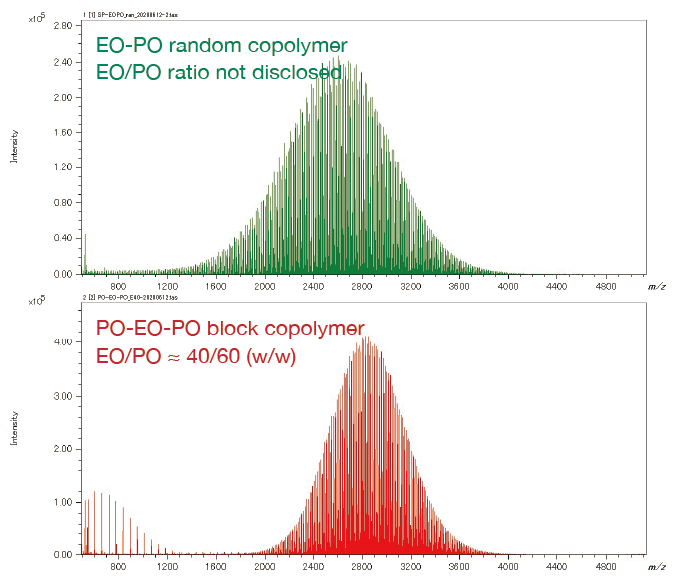
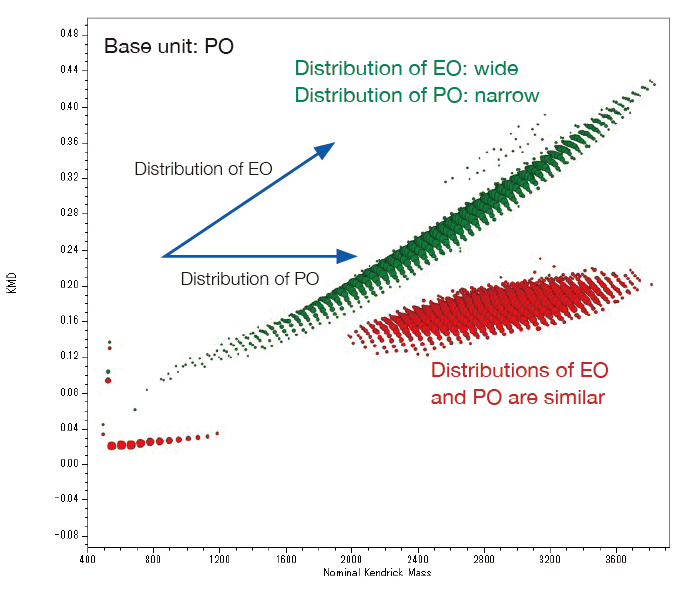
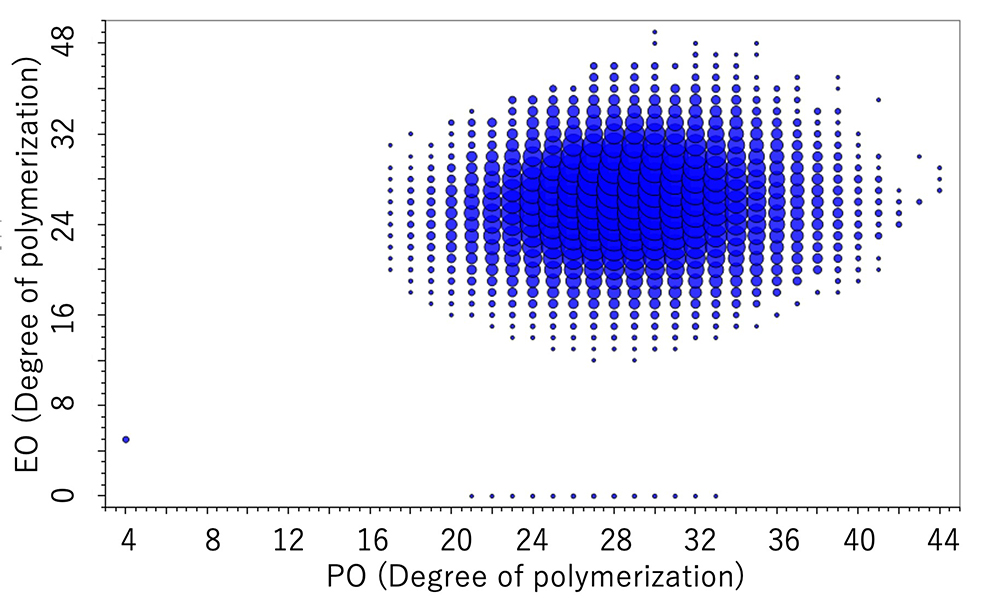
From the pattern on the KMD plot, it is possible to know the ratio of the two monomers contained in the binary copolymer, or the difference in the synthetic process of the copolymers. Below are the mass spectra and KMD plots (base unit: PO) of two EO-PO copolymers with approximately equal average molecular weights. A small amount of PO homopolymer was detected on the mass spectrum and the KMD plot of the PO-EO-PO block copolymer. This is considered to be one of the proofs that this sample is a block copolymer, as the residual EO or PO homopolymers in the randomly polymerized EO-PO copolymers are unlikely given the process of synthesizing the copolymers.
On the other hand, for the EO-PO random copolymer, the KMD plot shows that the numeric distribution of EO monomers is wide. In addition, by specifying the end groups, the DP (degree of polymerization) plot can be generated, and the molar ratio and weight ratio of EO and PO can be calculated. The weight ratio of the PO-EO-PO block copolymers are in good agreement with the published values. It is possible to estimate the EO/PO composition ratios of the EO/PO random copolymer whose EO/PO ratio is not disclosed.
Mass Spectra of EO-PO random copolymer and PO-EO-PO block copolymer
Overlaid KMD plot of EO-PO random copolymer and PO-EO-PO block copolymer
DP plot of the EO-PO random copolymer
| Molar ratio % | Wight ratio % | ||
|---|---|---|---|
| EO | PO | EO | PO |
| 79.8 | 20.2 | 75.0 | 25.0 |
DP plot of the EO-PO block copolymer
| Molar ratio % | Wight ratio % | ||
|---|---|---|---|
| EO | PO | EO | PO |
| 46.8 | 53.2 | 40.1 | 59.9 |
Differential analysis of 2 polymer samples
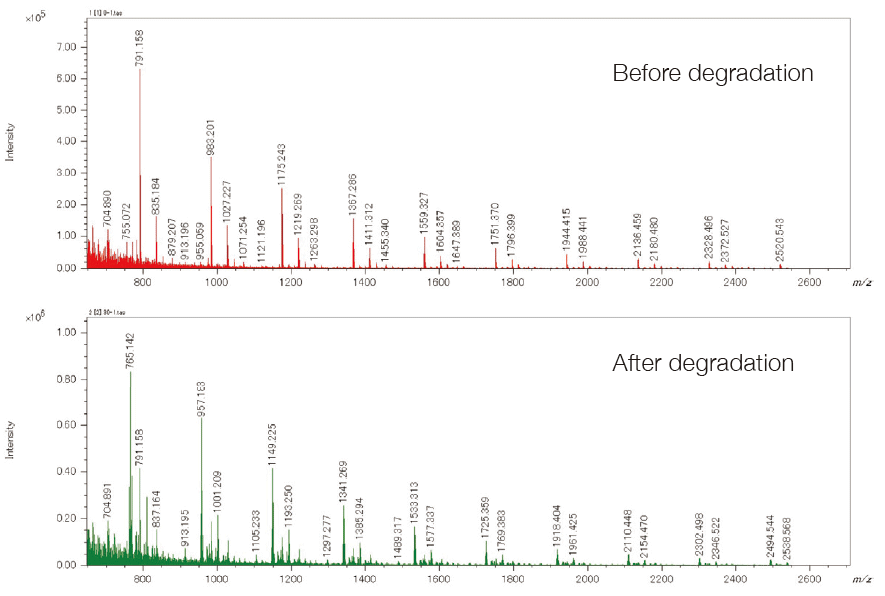
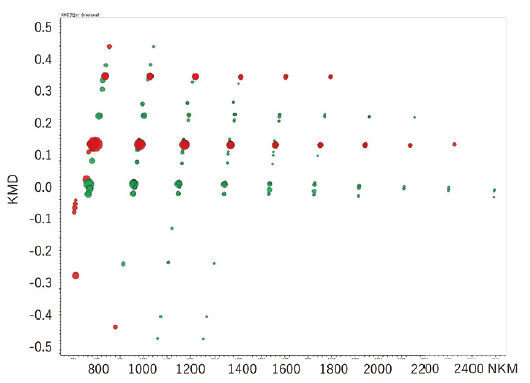
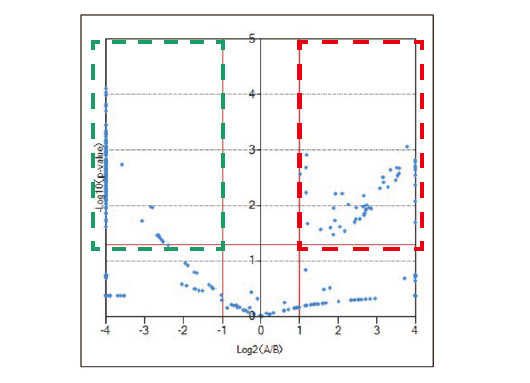
The differential analysis of the end groups and molecular weight distributions of polymer samples is very important for checking the degradation of a sample, the difference between production lots, and the difference in the synthesis processes. msRepeatFinder (optional) can perform the differential analysis of two samples. Below is an application example used for the degradation analysis of polyethylene terephthalate. The bottom left shows the mass spectrum before and after degradation. Before degradation, cyclic oligomers, and after the degradation, the series having the COOH/COOH end groups were observed as major components respectively. In performing differential analysis, each sample was measured three times. The bottom right is the result of the differential analysis shown in the KMD plots. The red shows stronger peaks before degradation, while the green shows the stronger peaks after the degradation. In addition, a volcano plot can be created to confirm the components that differ with statistical significance between the 2 samples.
Mass spectra of PET samples before and after degradation
KMD plot of differential analysis result
Volcano plot of differential analysis result
msRepeatFinder (Option)
The Kendrick Mass Defect (KMD) plot and the Kendrick Mass Remainder (KMR) plot are used to estimate the polymer species and end groups contained in polymer materials from a complex mass spectrum and clarify their identity. In addition, the differential analysis function between two samples is effective in verifying sample degradation, lot-to-lot differences, and differences in the synthesis process.
Evolving mass imaging analysis
MALDI MS imaging was initially developed to focus on high molecular weight compounds such as proteins and peptides. However, with the expanding applications of MALDI MS imaging, the interests have shifted to include smaller molecules such as lipids, pharmaceuticals, and pharmaceutical metabolites. Conventional MALDI - reflectron TOFMS has difficulty discerning small molecule signals from those of matrix. In the case of MALDI MS imaging, signals from unwanted molecules on the specimen surface will often interfere with signals from the target analytes. High selectivity by means of high mass-resolving power is essential for obtaining reliable target analyte spatial distributions. It is also important to maintain high mass-resolution and mass-accuracy for a long time even when measuring a sample surface with a large area and non-uniformity. SpiralTOF™-plus 3.0 is the only MALDI-TOFMS that meets imaging requirements with ultra-high mass-resolution and long flight distance to minimize loss of mass resolution due to sample surface non-uniformity. In addition, it also supports high-speed mass imaging analysis.
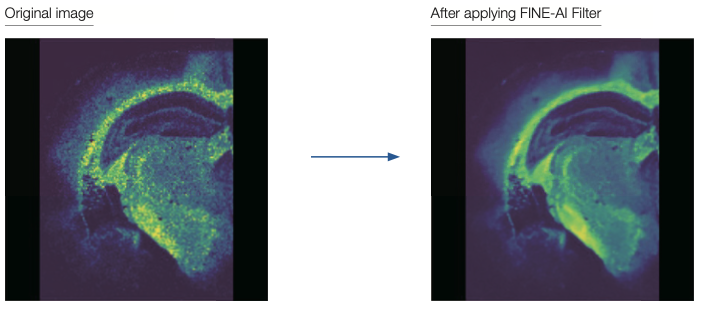
FINE-AI Filter: Noise Filtering Using AI (Machine Learning) Technology
Our newest MS imaging data processing software msMicroImagerTM version 3 (optional) is now equipped with FINE-AI Filter, a noise filtering technology that uses AI (machine learning). This new FINE-AI Filter originates from the JEOL LIVE-AI (Live Image Visual Enhancer-AI) technology developed for our scanning electron microscopes (SEM), which was re-optimized for MS imaging and implemented to achieve significant improvements to the quality of MS images.
Mass spectrometry imaging of polymers
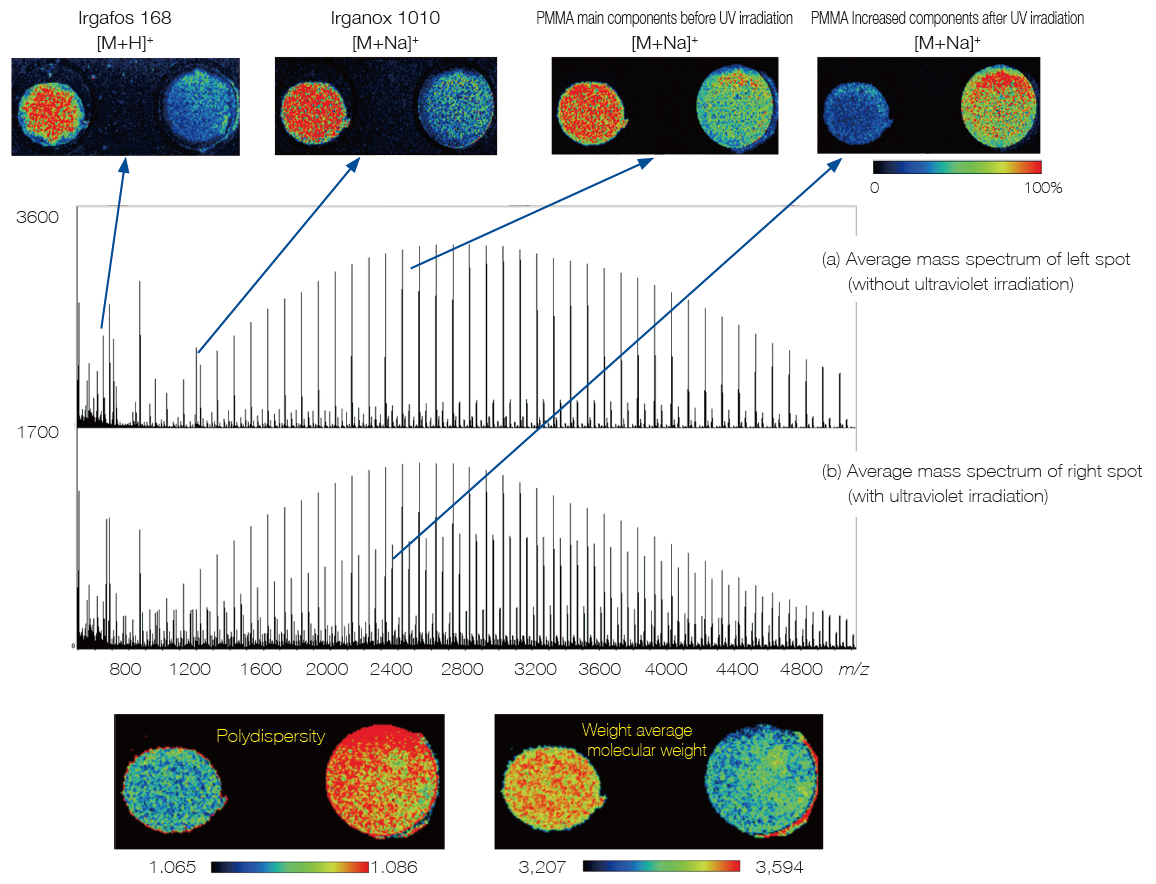
Mass spectrometry imaging can be applied to polymers. Two spots are prepared by adding two antioxidants - Irgafos 168 (BASF) and Irganox 1010 (BASF) - to polymethylmethacrylate (PMMA). The ultraviolet irradiation was performed to the right spot only and its degradation was visualized by using mass spectrometry imaging. For polymers, it is possible to visualize the quantitative change in both polymers and additives. It is also possible to capture the changes in the average molecular weight and polydispersity.
MS imaging of PMMA, Irgafos 168, and Irganox 1010
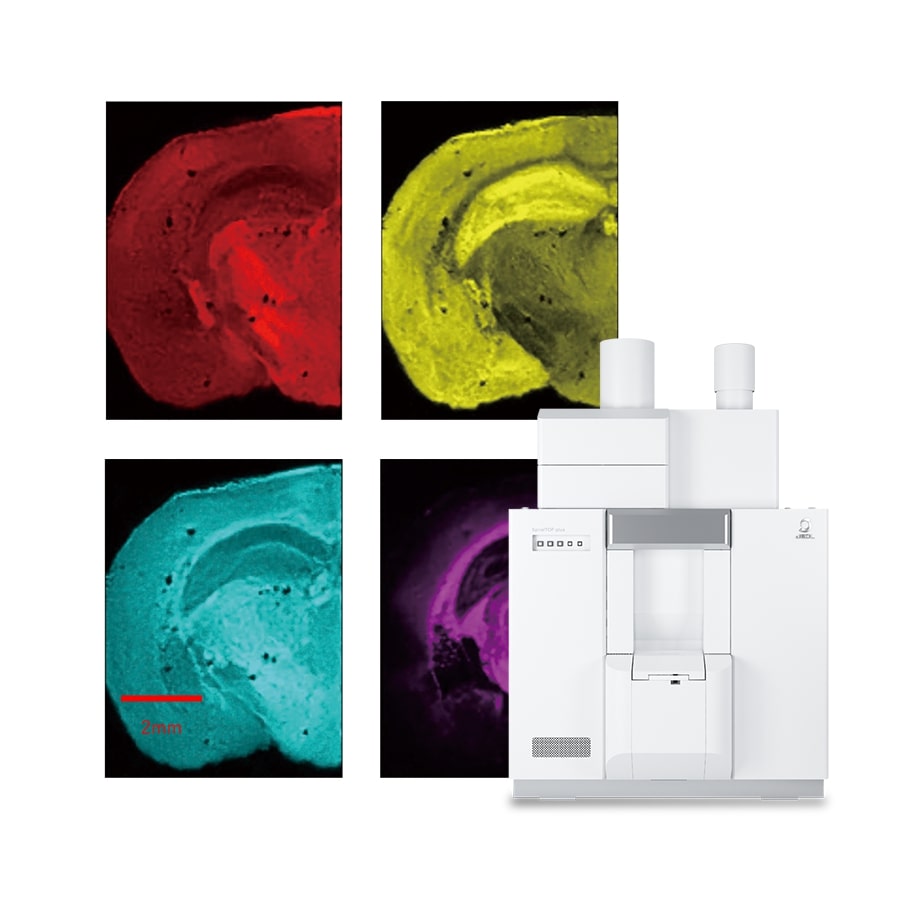
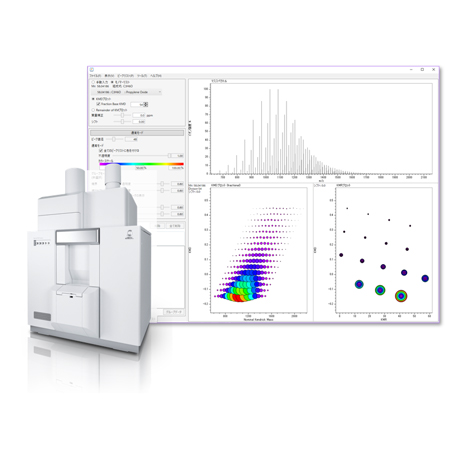
JMS-S3000 SpiralTOF™-plus 3.0 Mass Spectrometry Imaging System (Option)
JMS-S3000 SpiralTOF™-plus 3.0 Mass Spectrometry Imaging System
Interview

INTERVIEW 11
I want to make a polymer visible
Hiroaki Sato: Ph.D.
Deputy Director, Research Institute for Sustainable Chemistry, National Institute of Advanced Industrial Science and Technology (AIST)
Dr. Sato has been closely accompanying the evolution of mass spectrometers for 30 years. By fully utilizing the state-of-the-art mass spectrometers, he has been clarifying what is happening in the world of polymers. The evaluation methods with his knowledge are about to give new strength to the chemical industry.
Catalogue Download
Related Products
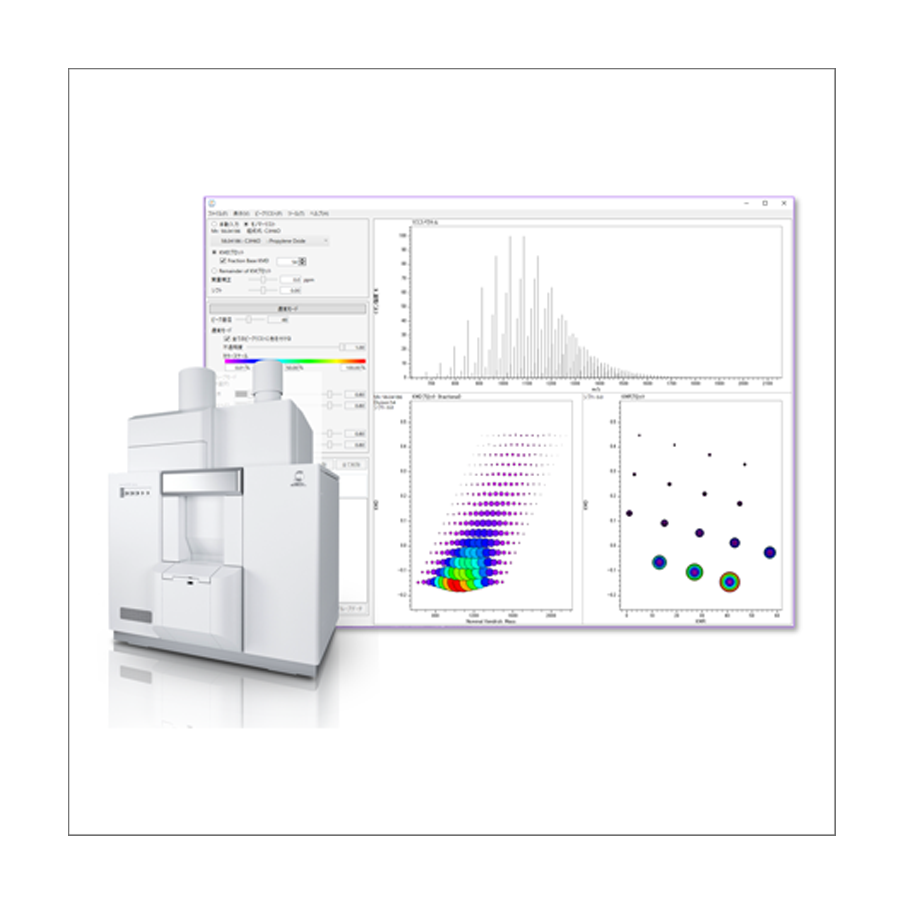
msRepeatFinder Polymer Analysis Software
msRepeatFinder is software that uses the Kendrick mass defect (KMD) method to visualize complex mass spectra of polymers and hydrocarbon mixtures acquired on a high-resolution mass spectrometer with soft ionization. It can group and color-code observed polymer series, calculate molecular-weight distributions, and estimate monomer and end-group compositions. It also includes the following features:
• Composition analysis of binary copolymers
• Type analysis of hydrocarbon mixtures
• Comparative (difference) analysis between two samples
• Target compound search using a compound list
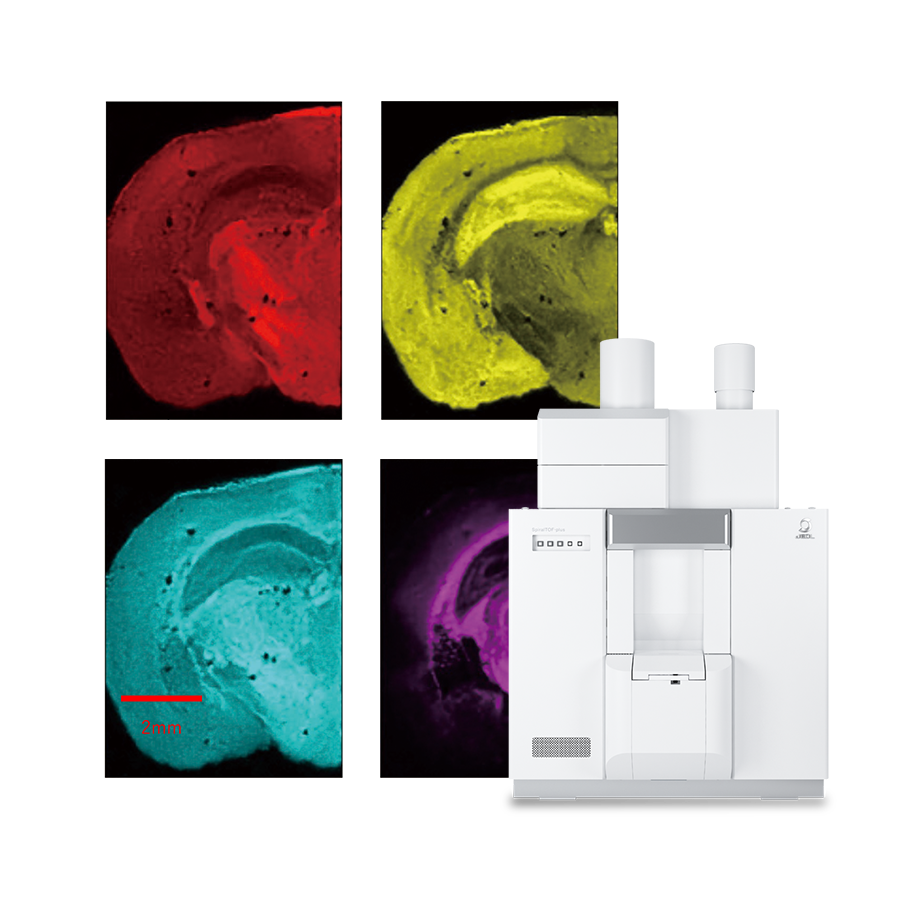
JMS-S3000 SpiralTOF™-plus 3.0 Mass Spectrometry Imaging System
MALDI MS imaging has expanded from proteins/peptides to small molecules such as lipids and pharmaceuticals, where matrix and surface interferences can obscure analyte signals in conventional MALDI-reflectron TOFMS. High mass-resolving power is key to reliable spatial mapping, making the SpiralTOF™-plus 3.0 indispensable for MALDI MS imaging.
◆Click the play button in the above box to watch the video. (3min 30sec.)◆
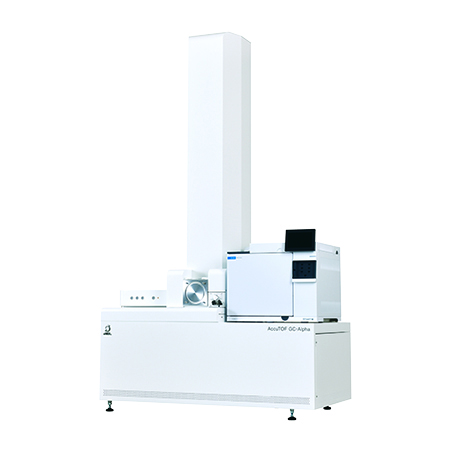
JMS-T2000GC AccuTOF™ GC-Alpha 2.0 Gas Chromatograph - Time-of-Flight Mass Spectrometer
The ultimate GC-MS system that pursues the ultimate in performance and functionality, the JMS-T2000GC AccuTOF™ GC-Alpha, has evolved into version “2.0” with the integration of a fully automated standard sample inlet and msFineAnalysis AI.We enable automated structure analysis of unknowns using three key technologies: high-performance TOFMS, soft ionization that generates molecular ions for vast majority of analytes, and AI-powered structure analysis.
Click the "replay" button in the box above, and the movie will start (for 4 minutes).
Applications shown in the movie:
Distribution of lipids (phospholipids and fatty acids) in thyroid cancer tissues
Mass spectrometry imaging on mixed conductive/non-conductive substrate using JMS-S3000 SpiralTOF™
Other mass spectrometry imaging applications are here.
More Info
Are you a medical professional or personnel engaged in medical care?
No
Please be reminded that these pages are not intended to provide the general public with information about the products.