Simultaneous analysis of pesticide residues by GC-MS/MS method using Hydrogen carrier gas
MSTips No. 394
Introduction
In the field of mass spectrometry, helium has primarily been used as the carrier gas for gas chromatography. However, due to the ongoing global supply chain disruptions, reduced production caused by issues at supply plants, and political and economic factors, there has been a long-term shortage of helium, leading to continuous price increases. To continue performing mass spectrometry, it is becoming essential to select alternative carrier gases to helium. Nitrogen or hydrogen are generally considered as alternative carrier gases, but it is desirable to understand the characteristics of each gas type for proper operation. When using hydrogen as an alternative carrier, it is important to note that it is a highly reactive gas, and safety measures such as the installation of hydrogen sensors must be thoroughly considered. Due to its high reactivity, reduction reactions may occur within the ion source depending on the target compound, potentially altering the detected mass spectrum patterns. However, hydrogen also has advantages as an alternative carrier gas, such as a wide range of average linear velocities that provide good separation efficiency under various analytical conditions, less sensitivity loss compared to nitrogen carriers, and stable supply through the use of hydrogen generators.
Switching to an alternative carrier gas requires a review of the previously used measurement conditions. This report introduces an example of using hydrogen as a carrier gas for the simultaneous analysis of pesticide residues in food by GC-MS/MS method.
Experimental
1. Sample Conditions
Standard Reagents : Pesticides standard solution 48, 63, 70, 73, 77, 79, Pesticide-Mix 1598 made by KANTO CHEMICAL CO.,INC.
Sample Concentration : Pesticide mixed standard solutions were prepared at 5, 10, 20, 50, and 100ppb
Sample Volume : 2μL (+ 0.3μL co-injection of analyte protectants : SFA10mix made by Hayashi Pure Chemical Industry Co.)
2. GC Conditions
Gas chromatograph : 8890GC (Agilent Technologies, Inc.)
Column : DB-5MS (Agilent Technologies, Inc., length : 20m, inner diameter : 0.18mm, film thickness : 0.36μm)
Oven temperature : 50℃ (1min) – 125℃ (25℃/min, 0min) – 300℃ (10℃/min, 10min)
Inlet temperature : 250℃
Inlet mode : Pulsed splitless mode (70kPa, 1min)
Flow rate : 0.5mL/min (constant flow)
Carrier gas : Hydrogen
3. MS Conditions
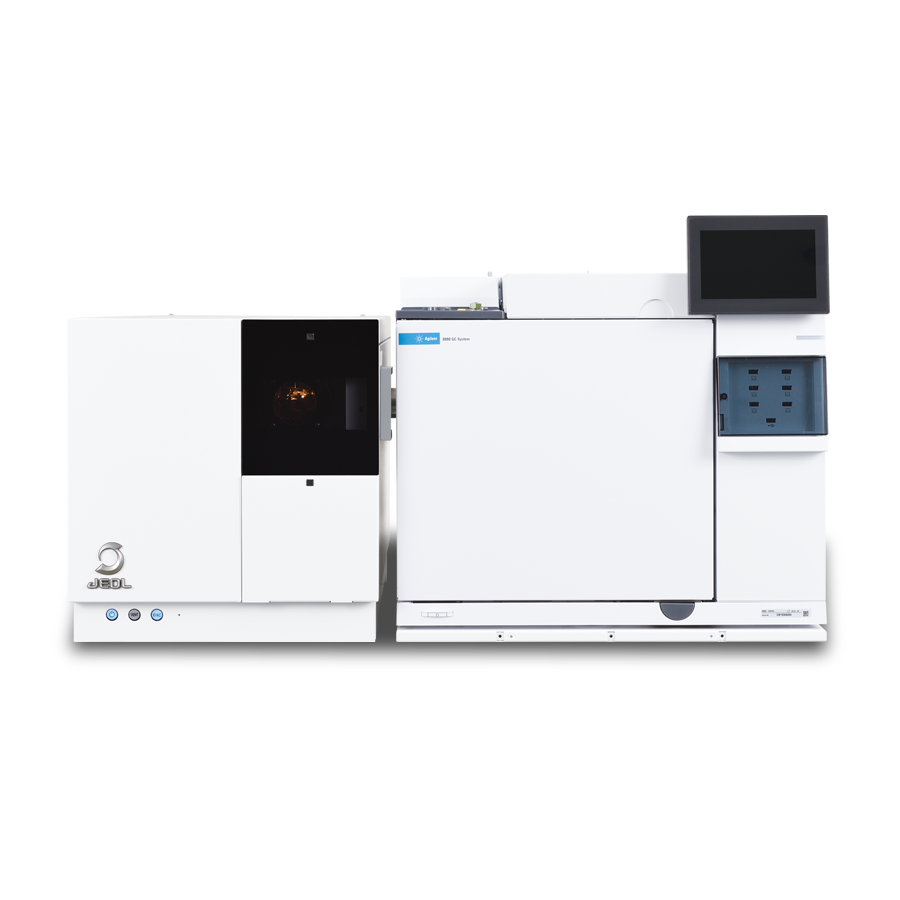
Mass spectrometer : JMS-TQ4000GC (JEOL Ltd.)
Measurement mode : SRM
SRM mode : Variable speed (5 or 10ms)
Ion source temperature : 280℃
Interface temperature : 300℃
Ionization current : 50μA
Ionization voltage : 70V
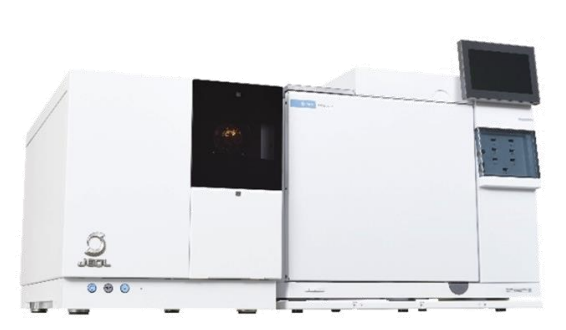
JMS-TQ4000GC
Results
Single SCAN measurements were conducted for all 336 components set as measurement targets, and changes in the spectral patterns when using a hydrogen carrier were confirmed. Significant changes in the spectral patterns were observed for 14 components: Cyanazine, Fipronil, TCMTB, Cyhalothrin, Fenarimol, Cyfluthrin, Cypermethrin, Bupirimate, Benfuracarb, Methyl parathion, Parathion, Fenitrothion, Acrinathrin, and Fenvalerate. Therefore, automatic optimization of SRM transitions using product ion scan measurements was performed. Using the optimized SRM transitions, SRM measurements for all 336 components were conducted. As a result, detection at 5 ppb was sufficiently possible, and the linearity of the calibration curves was judged to be good for a total of 329 components. For six components “Oryzalin, Flutriafol, Isoxathion oxon, Thiacloprid, Propiconazole, and Captan” detection at 5 ppb was possible, but improvements were deemed necessary for some items such as the linearity of the calibration curves, area reproducibility, or chromatogram shape. In this study, the only component for which detection at 5 ppb was difficult was Captafol.
As an example from the 329 components judged to be measurable, the EIC and calibration curves for three components “Cyanazine, Cyfluthrin, and p,p‘-DDD” are shown on the next page (Fig. 1-3).
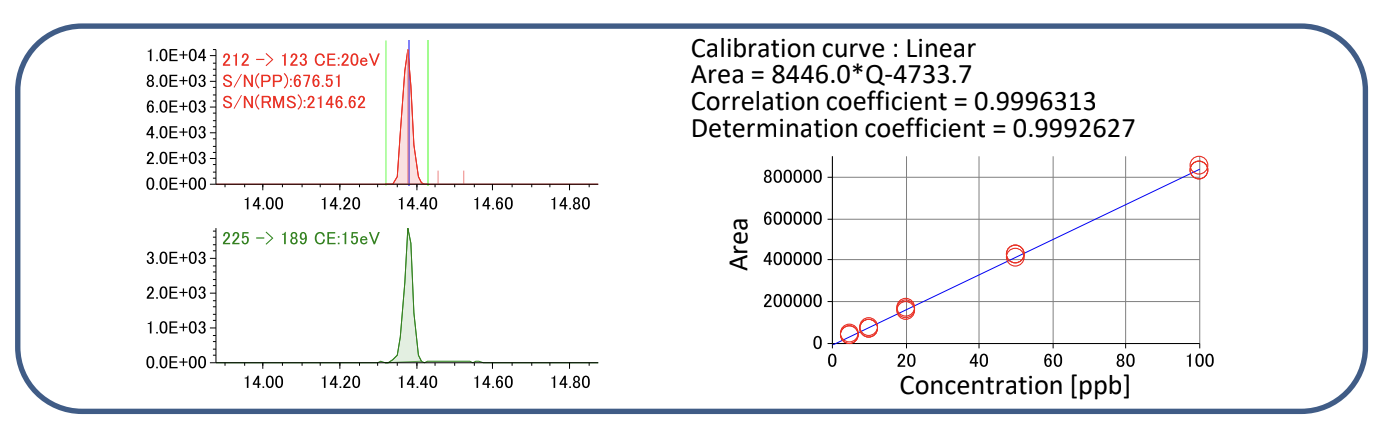
Fig. 1 EICs at 5ppb and calibration curve of Cyanazine
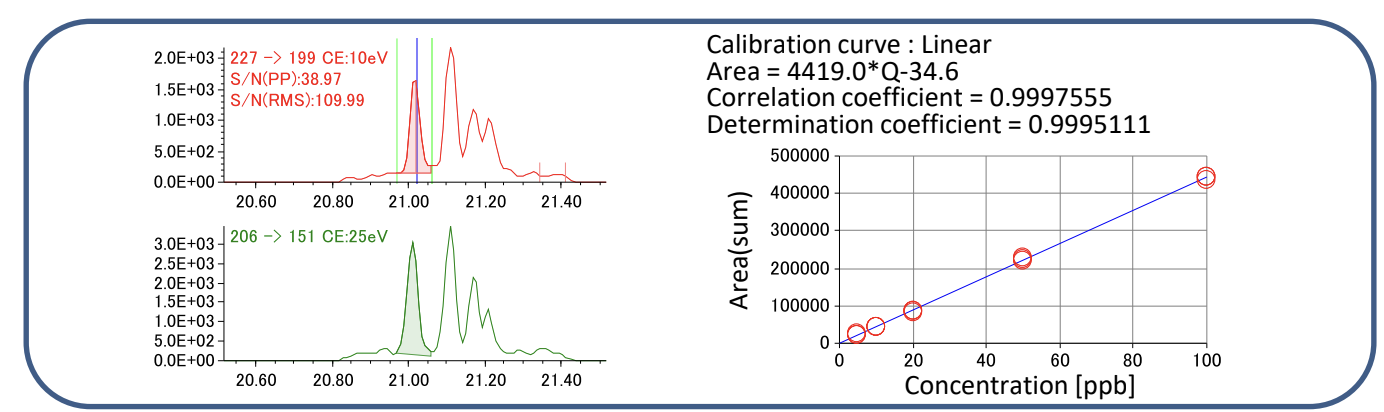
Fig. 2 EICs at 5ppb and calibration curve of Cyfluthrin
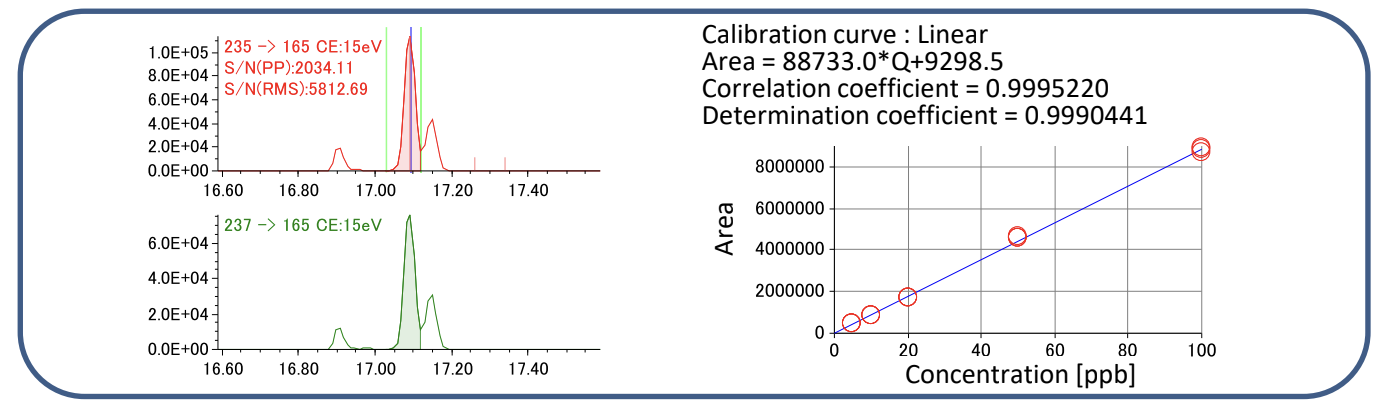
Fig. 3 EICs at 5ppb and calibration curve of p,p’-DDD
Fig. 4 shows the 5 ppb area reproducibility (n=3) and the correlation coefficient of the calibration curves for all 329 components measured. Among the 329 components, 308 components showed good reproducibility with a CV of 20% or less. Additionally, 249 components showed a correlation coefficient of r=0.999 or higher for the calibration curves, confirming no issues with linearity. The component with the worst linearity, acetamiprid, had a correlation coefficient of r=0.994, which is still acceptable.
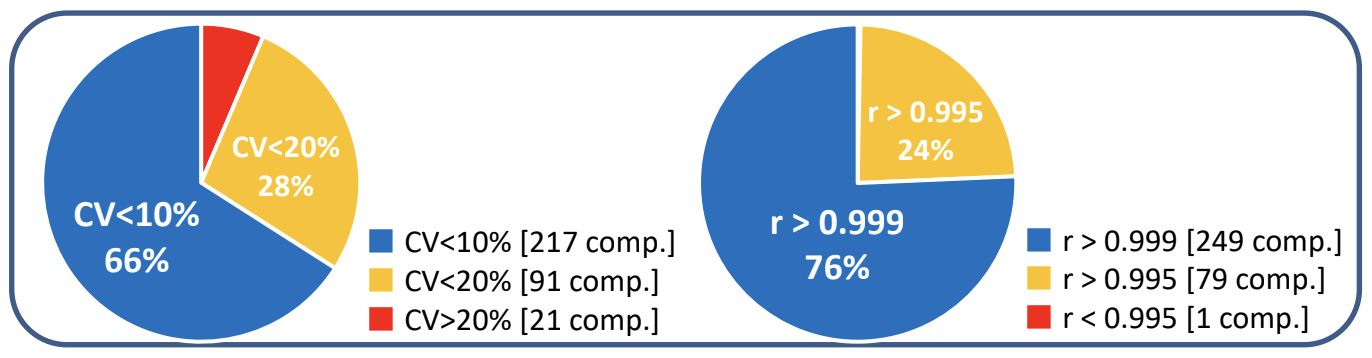
Fig. 4 Coefficient of variation of area and correlation coefficient of the calibration curve
Conclusion
As an application example of simultaneous analysis of pesticide residues in food using GC-MS/MS with hydrogen carrier gas, measurement conditions were optimized, and a calibration curve was created in the range of 5 ppb to 100 ppb by measuring a mixed pesticide standard solution. Out of the 336 pesticide components set as measurement targets, 329 components could be detected without any issues down to 5 ppb. This resulted in a favorable outcome, indicating that 98% of the pesticide compounds examined could be quantified using hydrogen carrier gas.
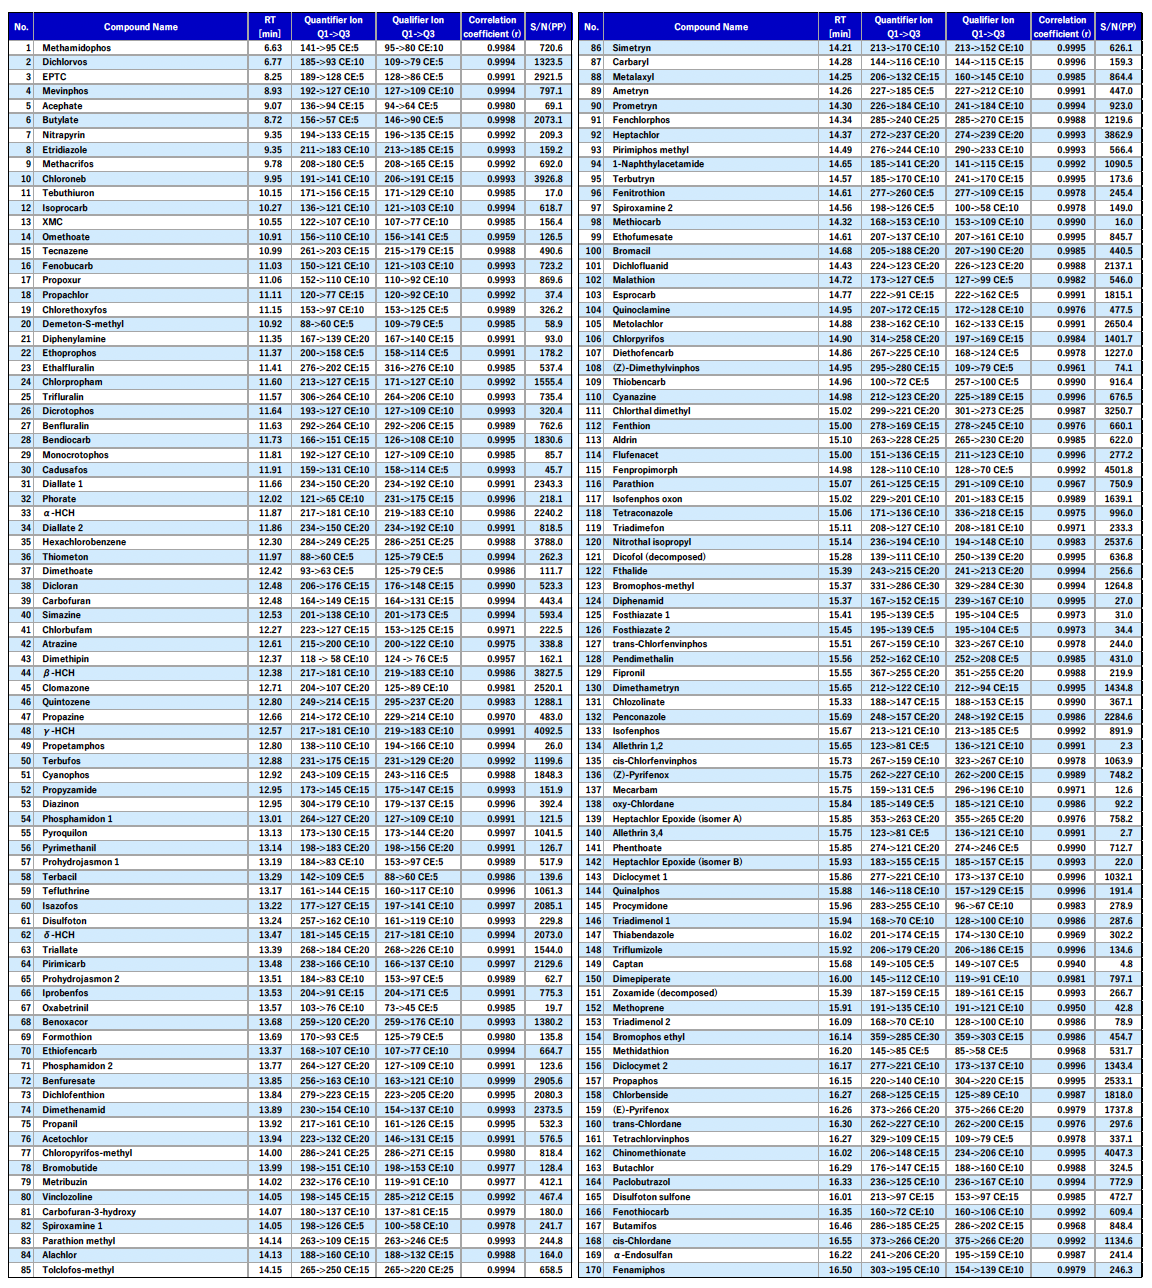
Target pesticides (No.1~170)
Calibration curve : Linear
S/N(PP) : STD 5ppb
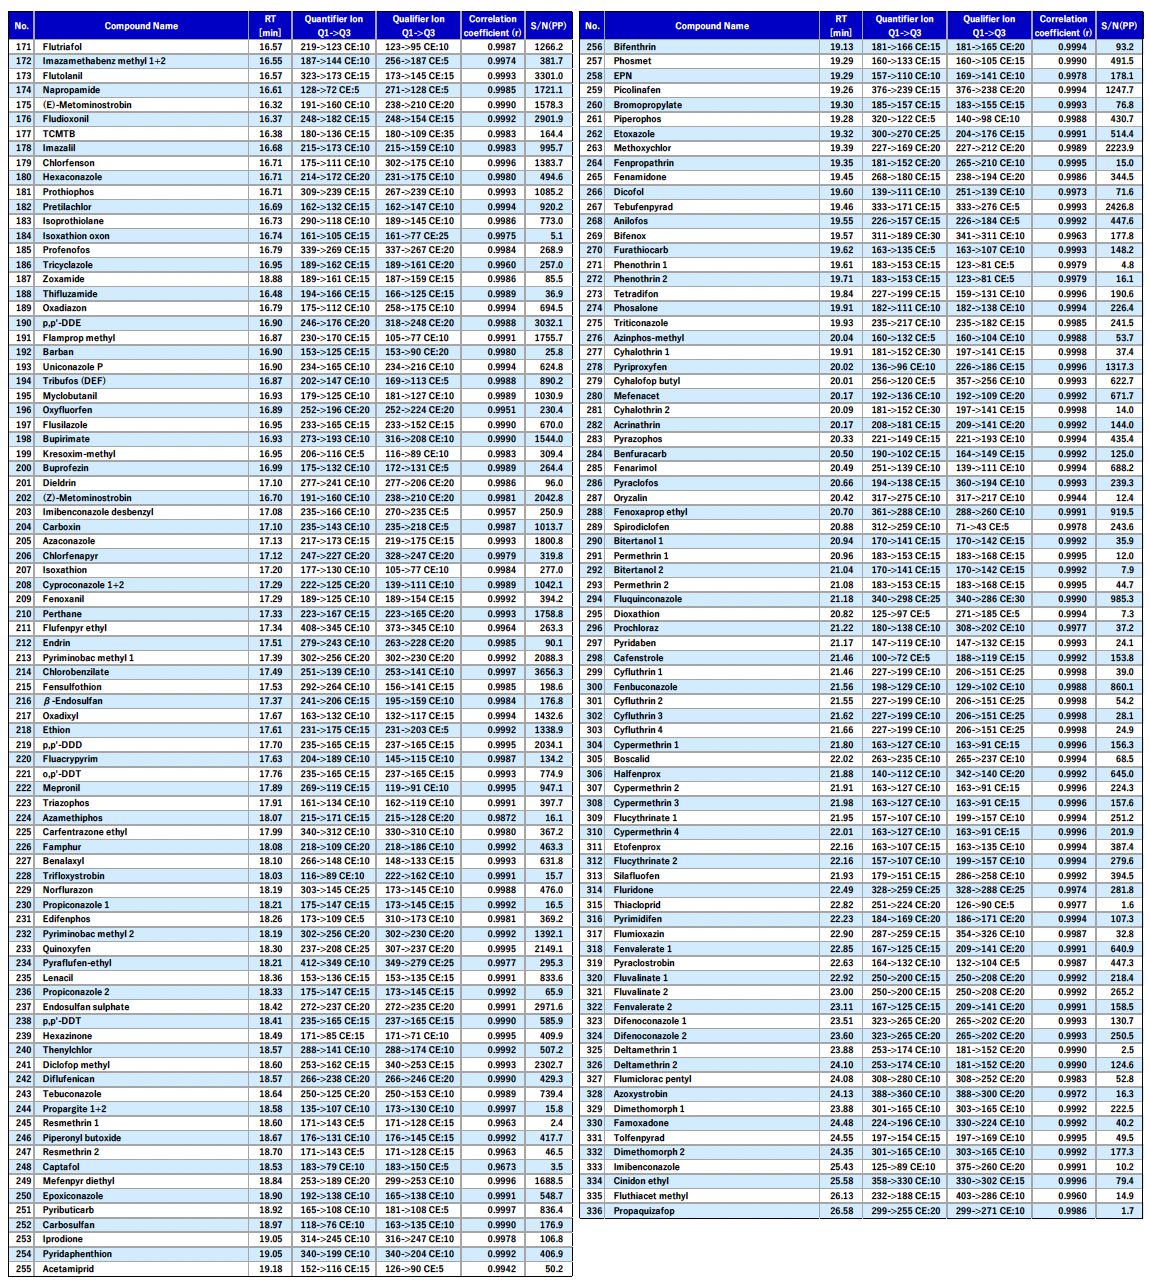
Target pesticides (No.171~336)
Calibration curve : Linear
S/N(PP) : STD 5ppb
Solutions by field
Related products
Are you a medical professional or personnel engaged in medical care?
No
Please be reminded that these pages are not intended to provide the general public with information about the products.