Analysis of two types of polypropylene with different tacticity using msFineAnalysis AI
MSTips No.427
Introduction
Polypropylene has high strength, heat resistance, and excellent workability, so it is used in many industrial products. Polypropylene has a tacticity and classified into isotactic, syndiotactic and atactic depending on the arrangement of methyl group in side chains. Pyrolysis-GC-MS, which is commonly used as a polymer analysis method, detects multiple stereoisomers reflecting tacticity. In this MSTips, two types of polypropylene, isotactic and atactic, were used as samples and analyzed by the unknown compounds structure analysis software msFineAnalysis AI.
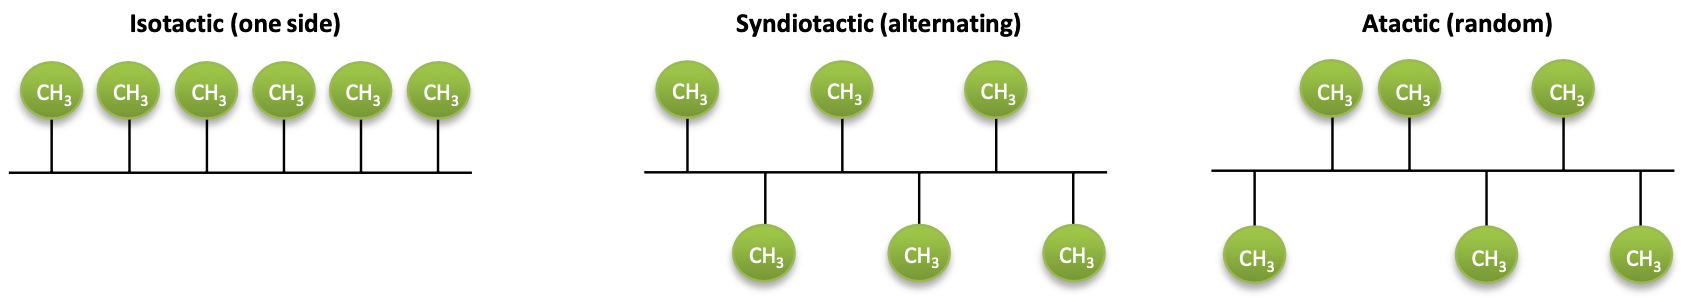
Figure 1 Tacticity of polypropylene
Experiment
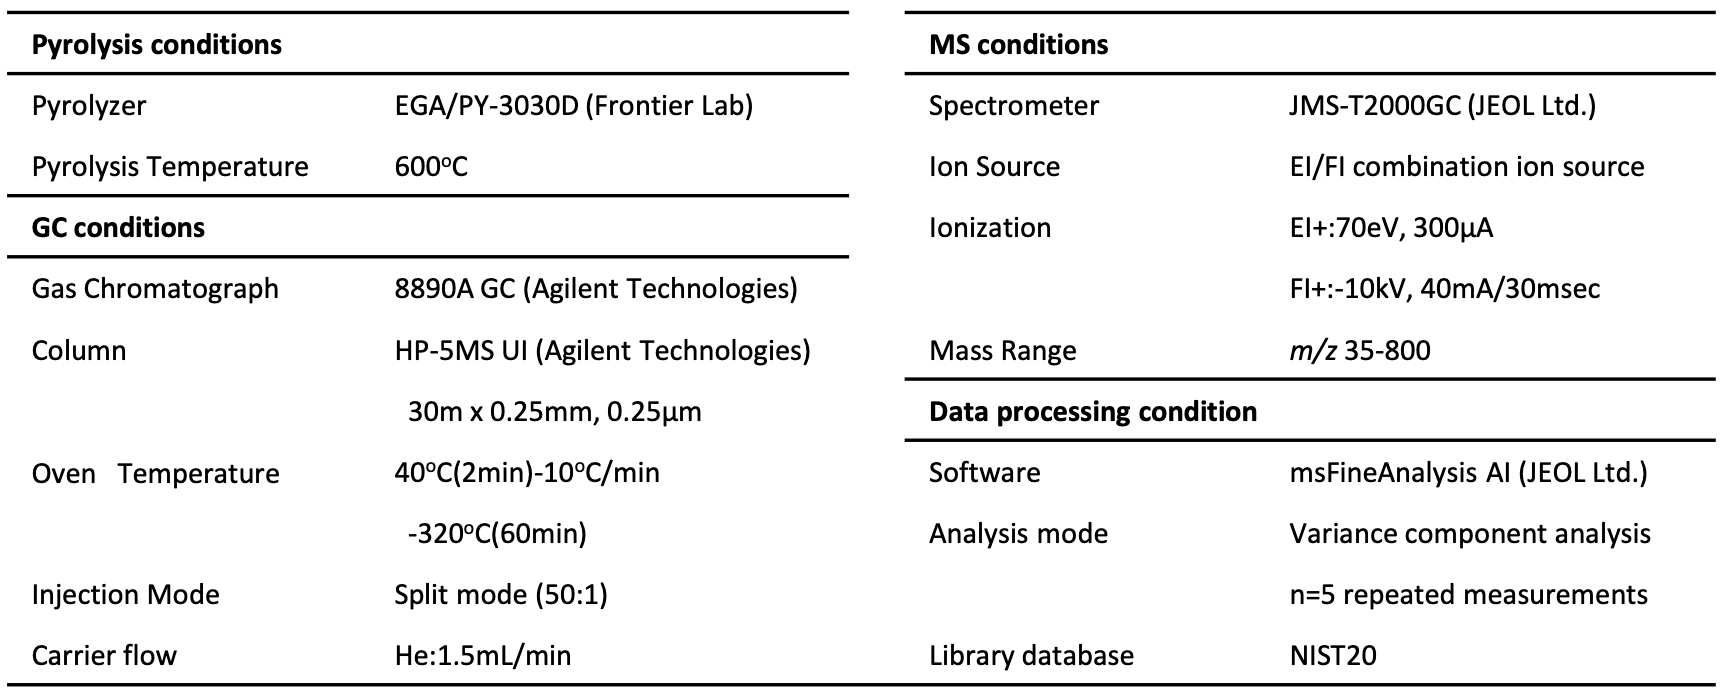
Polypropylene pellets (A) isotactic and (B) atactic (=amorphous) were used as samples, and measurement was performed by the pyrolysis-GC-MS method. The sample weight was 0.2 mg. The repeat number of measurement were n = 5 times in the EI method and n = 1 time in the FI method. Qualitative information on thermal decomposition products was derived by msFineAnalysis AI, and stereoisomers were classified by the difference analysis function. Table 1 shows the measurement and analysis conditions.
Table 1 Measurement and analysis conditions
TIC chromatograms of EI method
Figure 2 shows the TIC chromatogram of the EI measurement results. Chromatograms were roughly similar in (A) and (B). (A) had stronger peak intensity overall, especially for high boiling point components.
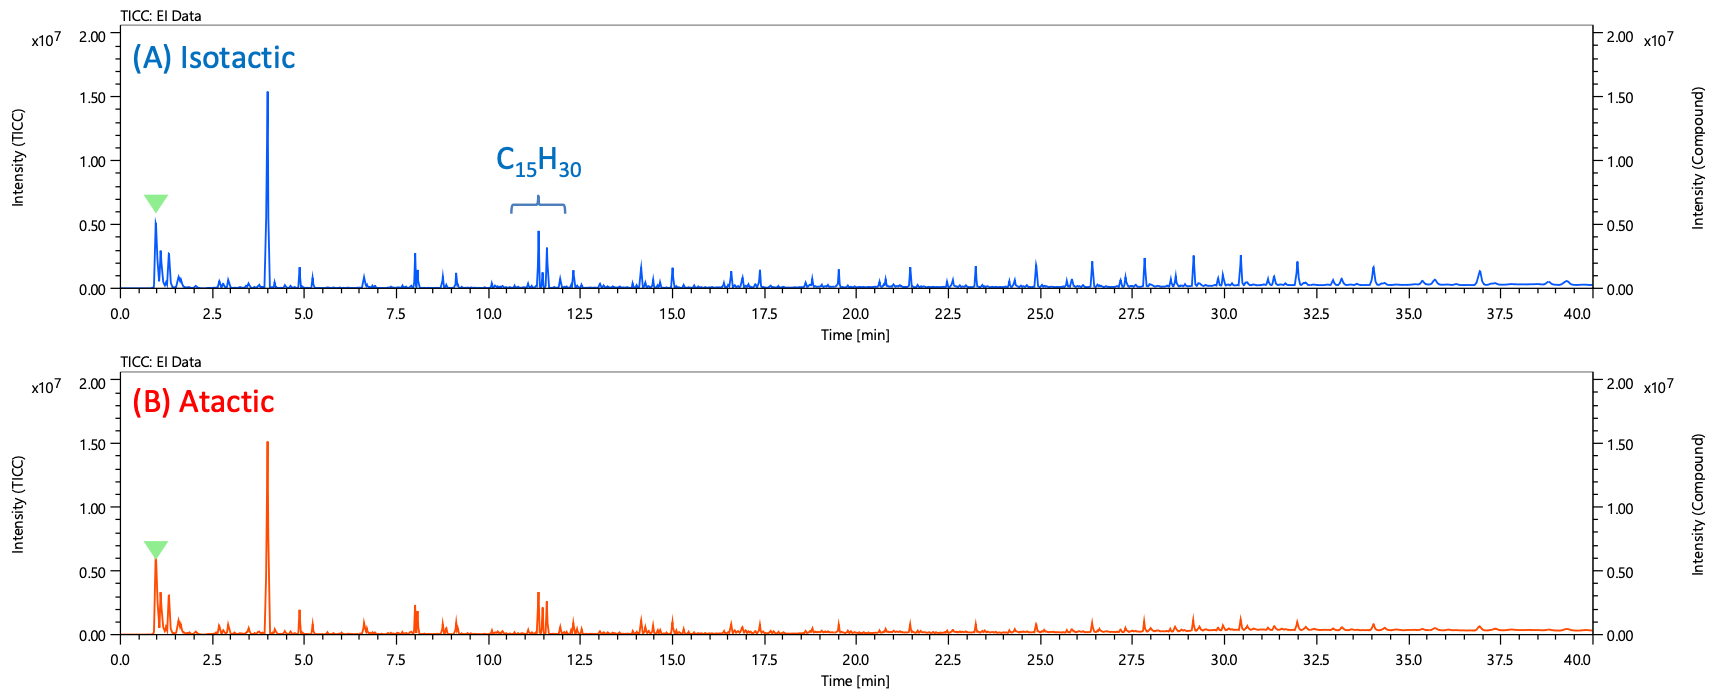
Figure 2 TIC chromatograms of EI method
Volcano plot of variance component analysis
Figure 3 shows the volcano plot of variance component analysis. Each plot corresponds to a peak on the chromatogram, and visually expresses the difference with the intensity ratio on the horizontal axis and the statistical significance (repeatability) on the vertical axis. In this analysis, 75 peaks with an intensity ratio of up to 2% to the maximum peak were targeted. All peaks were detected in both samples, but intensities differed between samples.
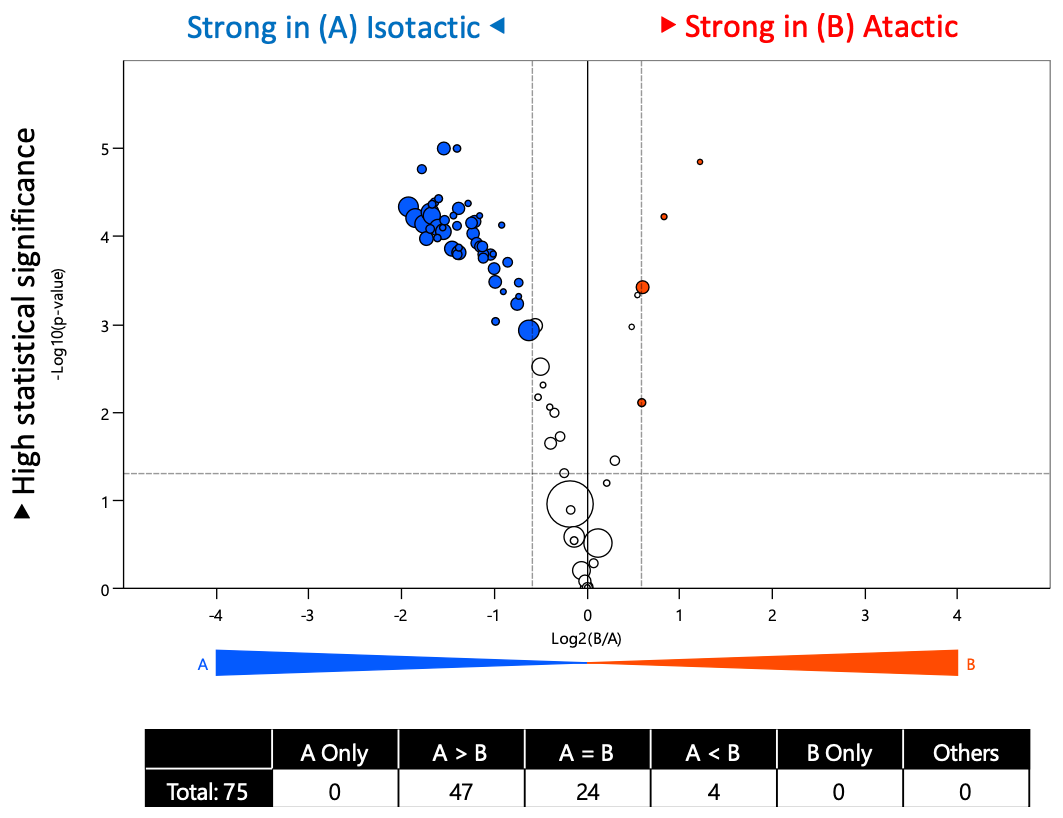
Figure 3 Volcano plot
Results of C15H30 stereoisomer
The expanded TIC chromatogram is shown in Figure 4 for the three peaks (ID022-024) of the C15H30 stereoisomer.(A) and (B) Two chromatograms are overlaid, with peak colors based on difference analysis results. According to reference1), the retention order of these stereoisomers was isotactic => atactic => syndiotactic. This agrees with the experimental results of this time.
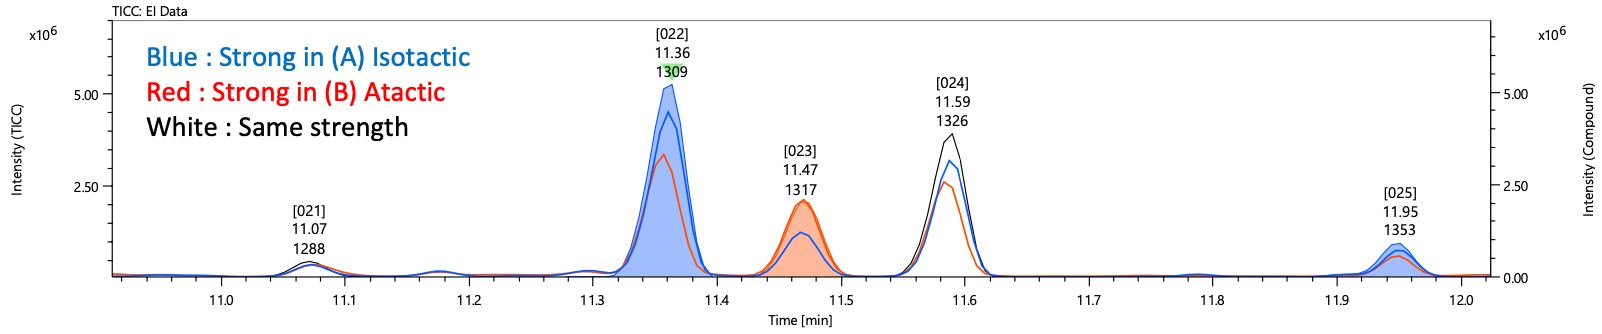
Figure 4 TIC chromatograms of EI method
Figure 5 shows the mass spectra of each peak. Since they are stereoisomers, no significant difference was observed in the mass spectra. Although the EI spectrum is not registered in the NIST library, the molecular formula of these peaks was derived to be C15H30 from the molecular ions detected in the FI spectrum.
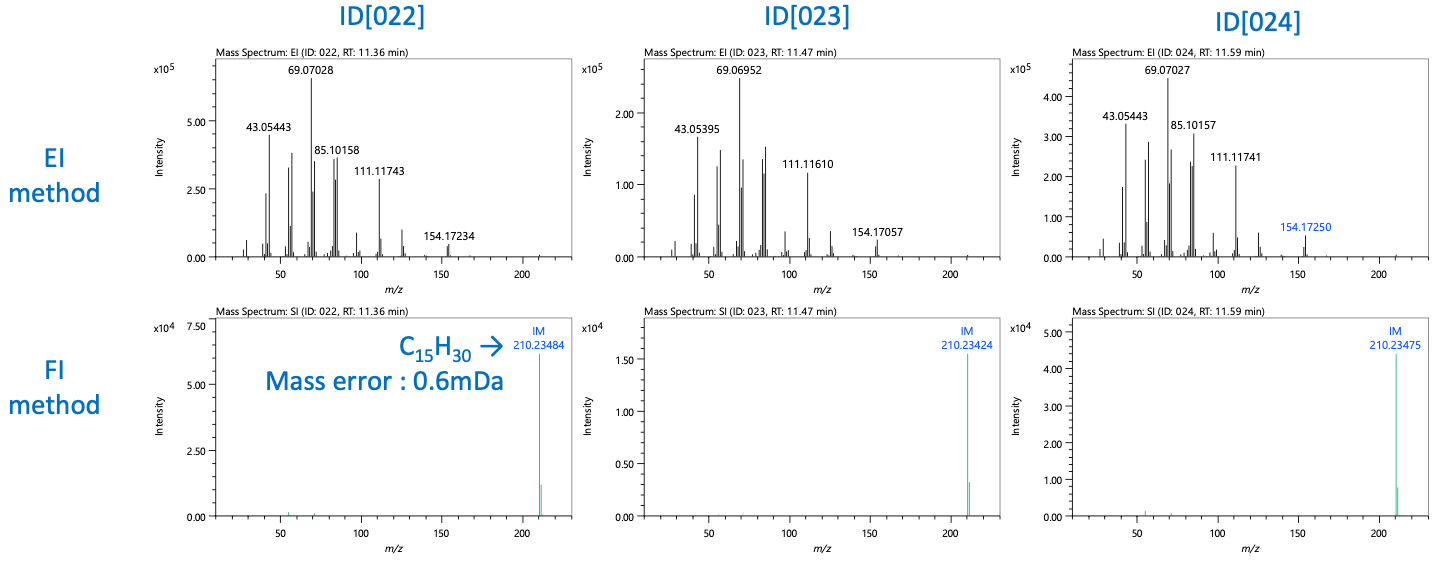
Figure 5 Mass spectra of EI / FI method
Figure 6 shows the AI structure analysis results for peak ID022. Structural formula originating from polypropylene were derived with high score.
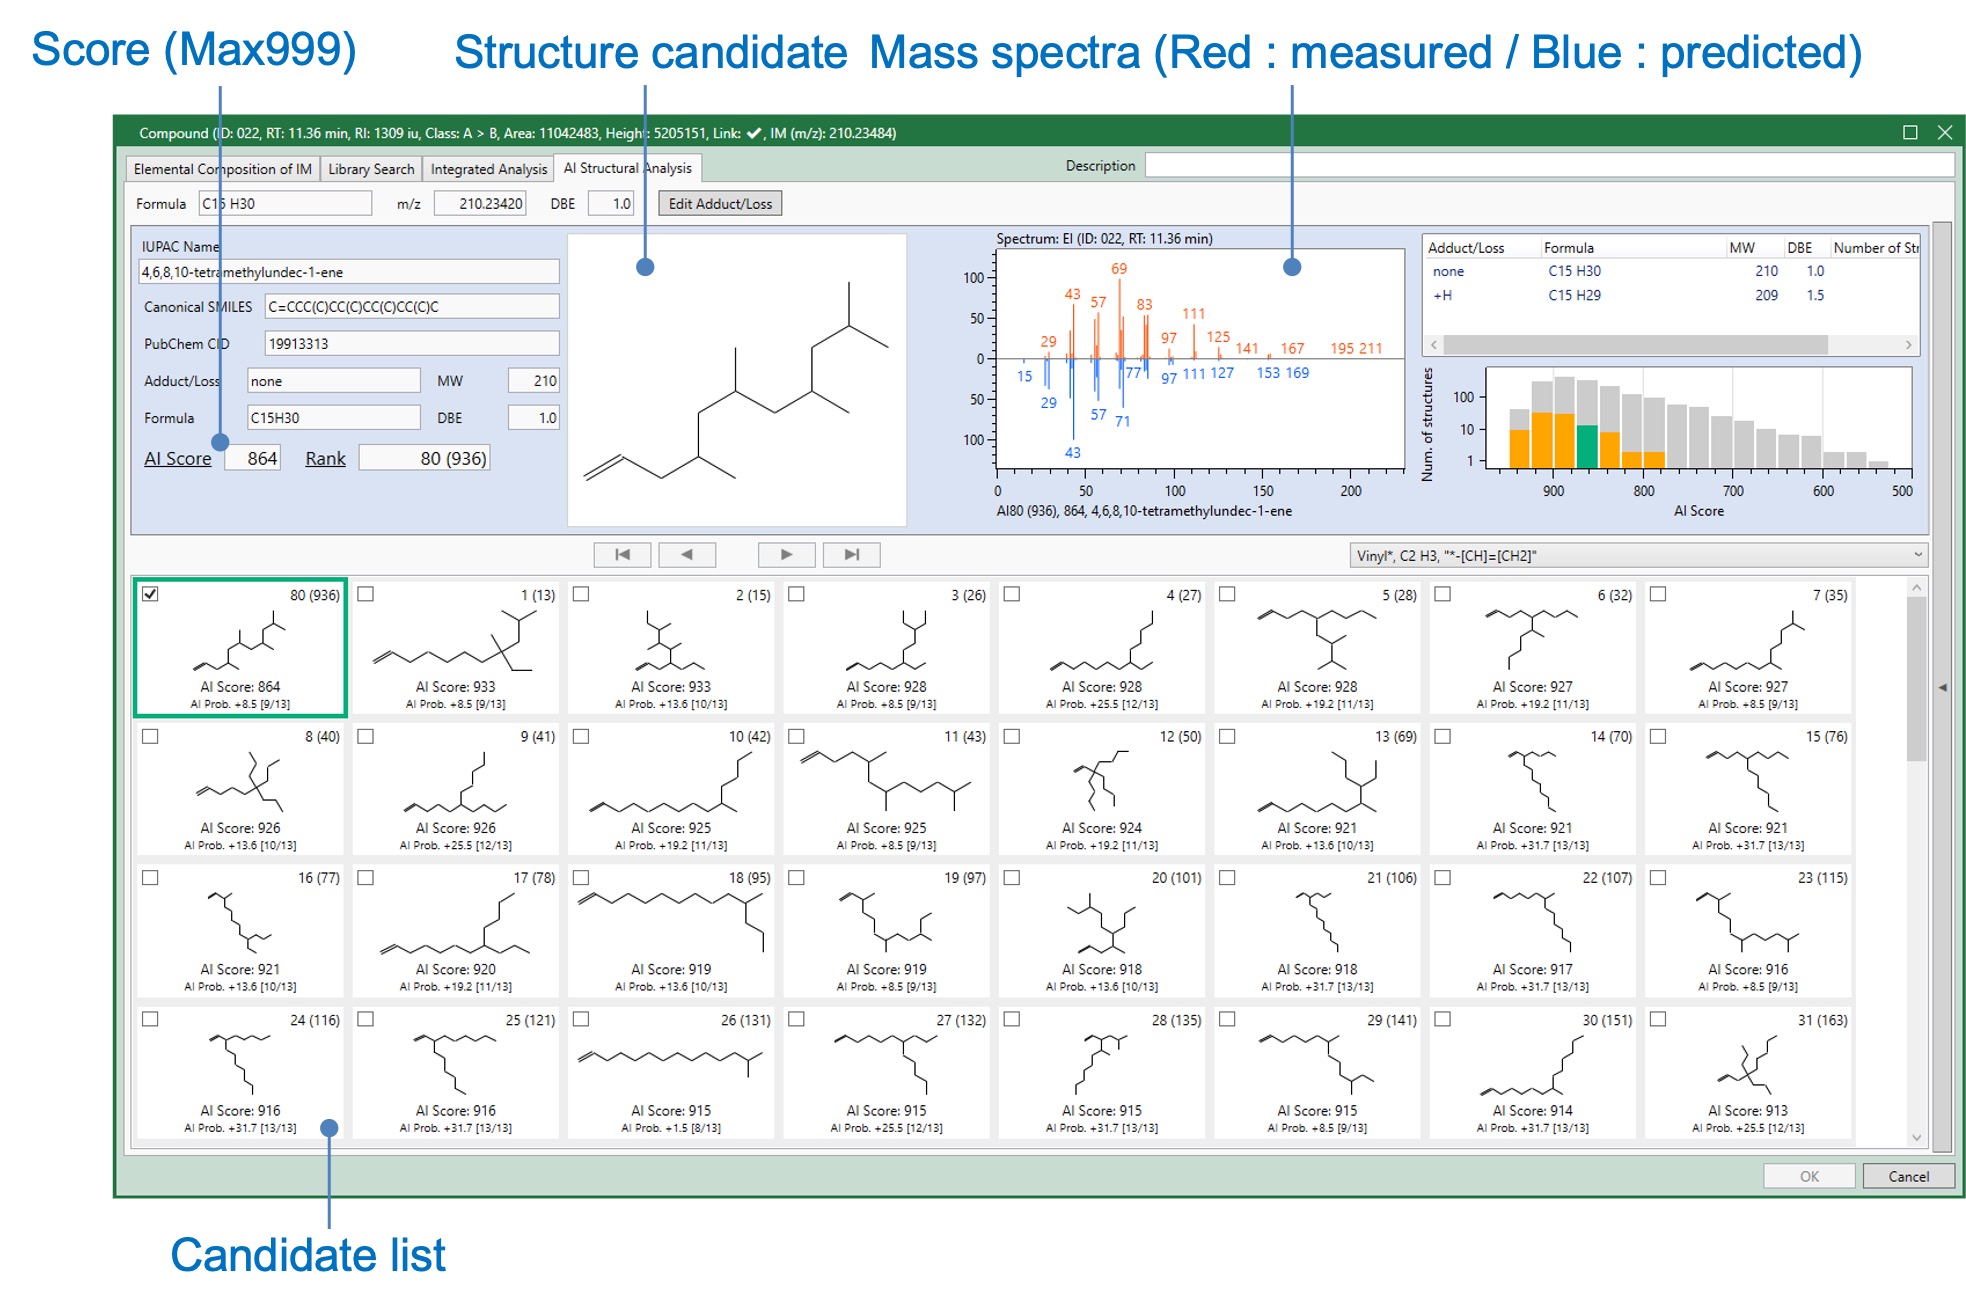
Figure 6 Result of AI structural analysis (ID 022)
Identification of stereoisomers by retention index and user library
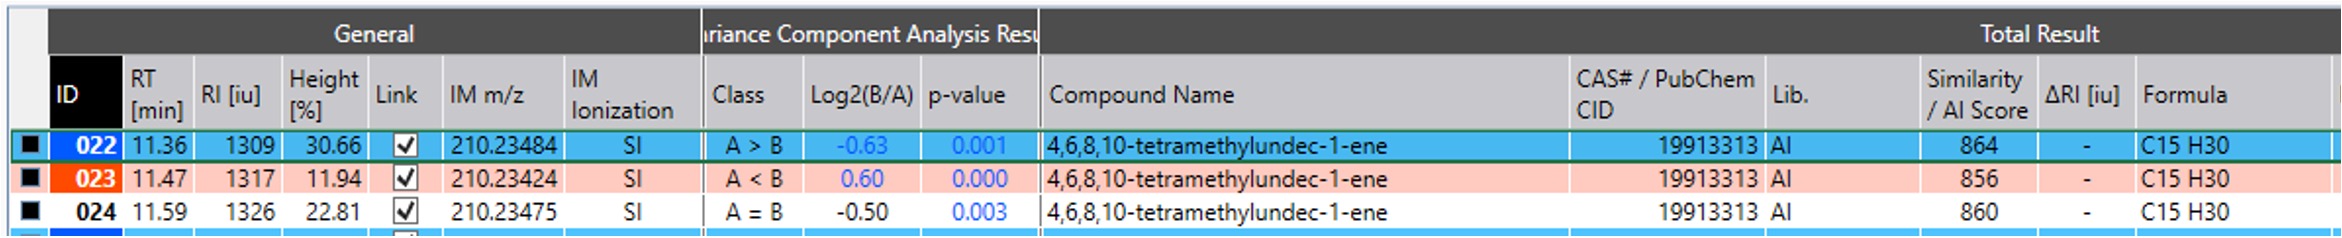
Table 2 shows the qualitative analysis results by AI structural analysis only. Since AI structural analysis cannot distinguish stereoisomers, the same compound name (structural formula) was displayed for all three peaks.
Table 2 Results of qualitative analysis (Only AI structural analysis)
The user library of msFineAnalysis AI is effective for identifying these stereoisomers. Figure 7 shows a screenshot of msFineAnalysis AI user library registration. In the user library, measured mass spectra, compound names and structural formulas derived from AI structural analysis, and retention index values can be registered. Adding the stereoisomer name to the compound name, it becomes possible to identify it in subsequent analyses.
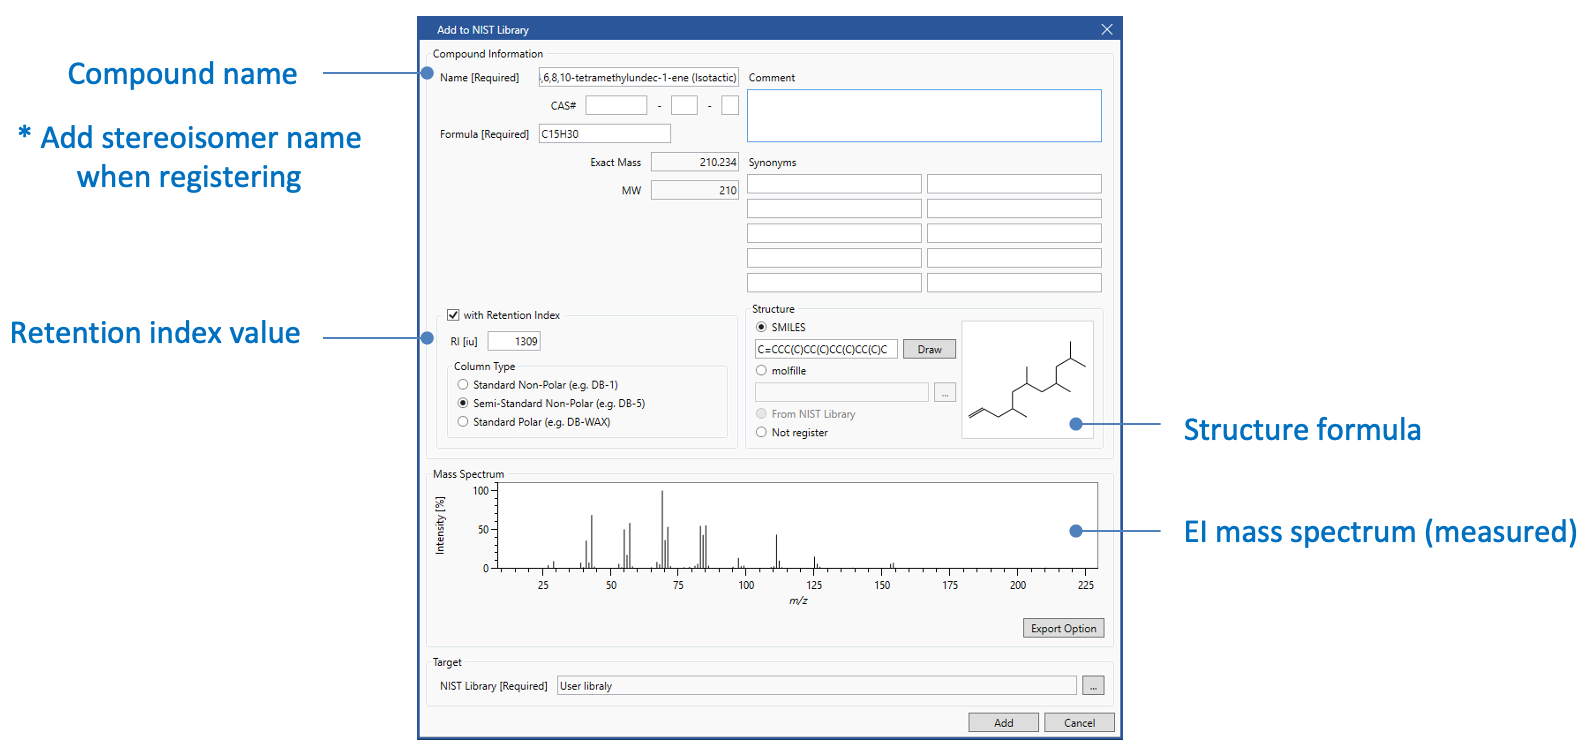
Figure 7 Screenshot of user library registration
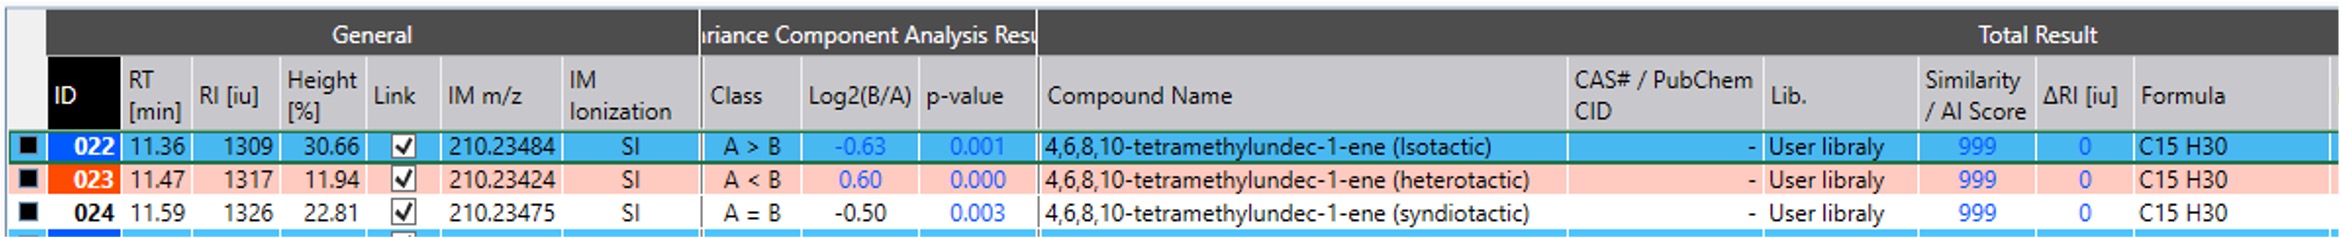
Table 3 shows the qualitative analysis results when using the user library. The retention index has made it possible to identify stereoisomers. The user library created here conforms to the NIST format and can be used with other compatible qualitative analysis software. This allows similar analyzes to be performed with low-resolution MS such as QMS.
Table 3 Results of qualitative analysis (With user library)
Conclusion
By using JMS-T2000GC and msFineAnalysis AI, the structural formula of a polypropylene pyrolyzate could be derived, which was not registered in the NIST library. In addition, stereoisomers could be identified by using the difference analysis function and the user library. Accumulated data can be expanded to low-resolution MS such as QMS, and the JMS-T2000GC and msFineAnalysis AI set can be expected to improve the analytical capabilities of the laboratory.
Reference
1) Shin Tsuge, Hajime Ohtani, Chuichi Watanabe (2011), Pyrolysis - GC/MS Data Book of Synthetic Polymers, Elsevier
Solutions by field
Related products
Are you a medical professional or personnel engaged in medical care?
No
Please be reminded that these pages are not intended to provide the general public with information about the products.