Structural Analysis of Polyethylene Terephthalates with Different Crystallinity using Reactive Pyrolysis GC-TOFMS and NMR
MSTips No. 400
Polyethylene terephthalate (PET) is a thermoplastic polyester that is obtained by polycondensation of ethylene glycol and terephthalic acid and has excellent transparency, toughness, rigidity, and heat resistance (Figure 1). PET can be roughly divided into two types, crystalline PET (C-PET) and amorphous PET (A-PET), depending on the processing method. C-PET has the characteristics of high strength and heat resistance due to the regular arrangement of the molecules in the crystallized part, which increases the density. A-PET is characterized by high impact strength and easy bending. However, the amorphous portion of A-PET slowly crystallizes due to long-term use and heat history, causing changes over time. Changes in density generate internal stress that cuts polymer chains, which can lead to deterioration in flexibility, impact resistance, strength, etc. Therefore, a polymer was devised in which about 30-40% of the ethylene glycol in PET was replaced with cyclohexanedimethanol, and this is called glycol-modified PET (G-PET, PETG) (Figure 2). G-PET is treated as an amorphous resin because the polymer does not crystallize even during the molding process.
In this application note, two types of commercially available PET resins are analyzed by reactive pyrolysis GC-TOFMS and NMR, and the results of analysis to determine whether they are PET or G-PET are reported.
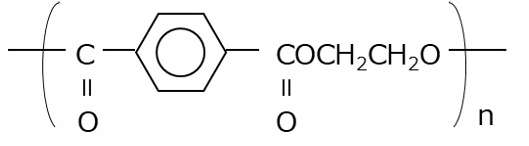
Figure 1 PET (A-PET & C-PET) structural formula
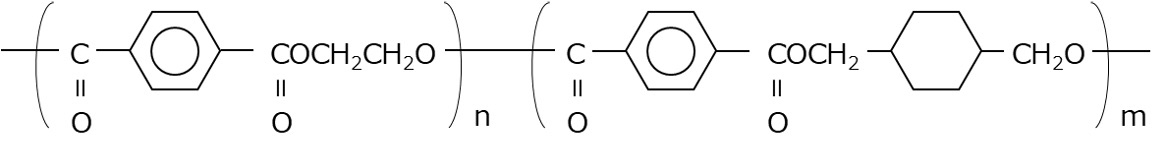
Figure 2 G-PET structural formula
Experiments
Both commercially available PET film and PET plate were freeze-ground and used as samples. The measurement conditions for each analytical instrument are shown below.
Reactive pyrolysis GC-TOFMS
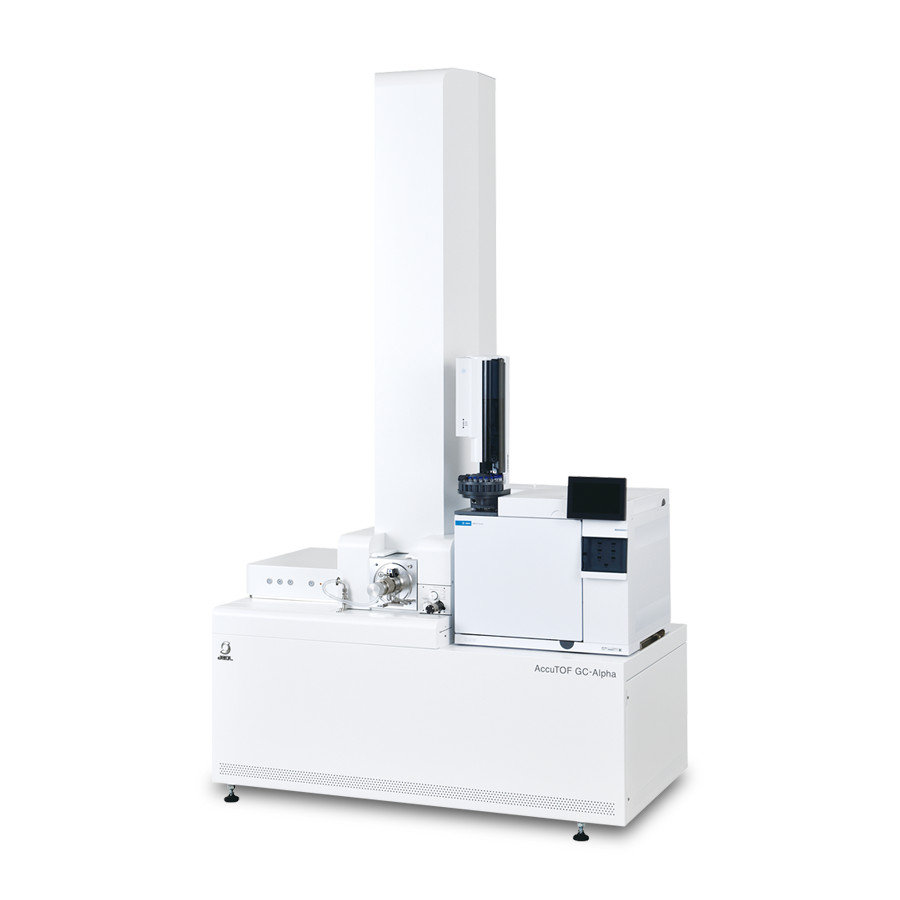
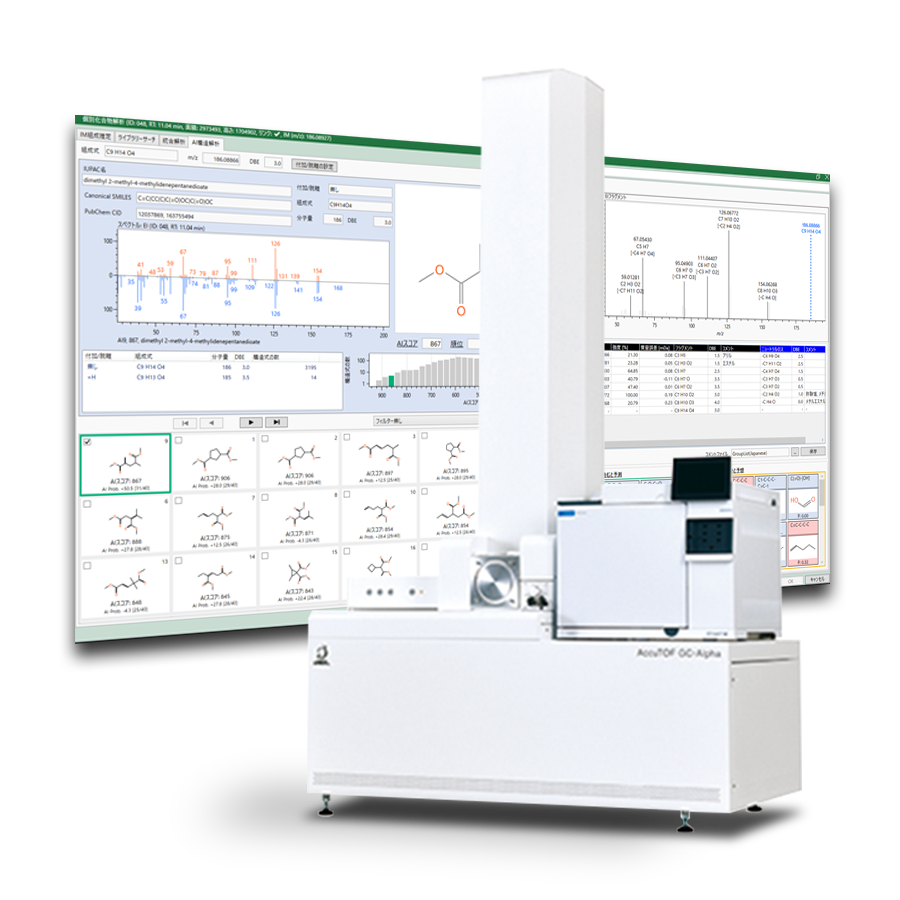
A gas chromatograph time-of-flight mass spectrometer JMS-T2000GC (JEOL Ltd.) equipped with a pyrolyzer EGA/PY-3030D (Frontier Labs Ltd.) was used for the measurements. Samples were subjected to measurements together with 10 µL of tetramethylammonium hydroxide (TMAH) 25% (w/w) methanol solution (EI method: n=3, FI method: n=1). The sample amount was 0.2 mg for the EI method and 0.5 mg for the FI method. Using msFineAnalysis (JEOL Ltd.), the obtained data were subjected to differential analysis between the two samples of PET film and PET plate, followed by qualitative analysis and structural elucidation of the components characteristic of G-PET. Other detailed conditions are shown in Table 1.
NMR
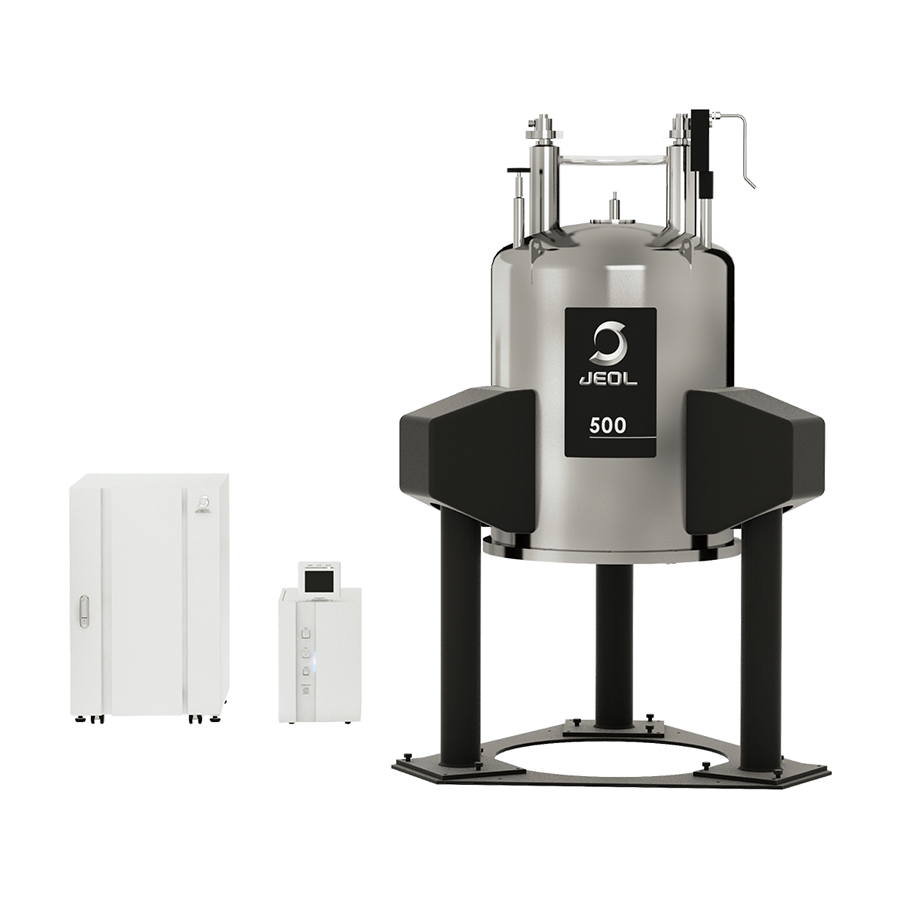
The sample was dissolved in deuterated trifluoroacetic acid (TFA-d1) and 1H NMR measurements were performed using JNM-ECZL400S (JEOL Ltd.). The NMR database of PoLyInfo (NIMS) [1] was used as a reference for the structural analysis.
Table 1 Py-GC-TOFMS measurement and analysis conditions
| Pyrolysis conditions | |
|---|---|
| Pyrolyzer | EGA/PY-3030D (Frontier Labs Ltd.) |
| Pyrolysis Temperature | 400°C |
| GC conditions | |
| Column | DB-5MS UI (Agilent Technologies) |
| 30 m x 0.25 mm, 0.25 μm | |
| Oven Temperature | 40°C (2 min) - 20°C/min |
| -320°C (10 min) | |
| Injection Mode | Split mode (100:1) |
| Carrier flow | He: 1.0 mL/min |
| MS conditions | |
|---|---|
| Spectrometer | JMS-T2000GC (JEOL Ltd.) |
| Ion Source | EI/FI combination ion source |
| Ionization | EI+:70 eV, 300 μA |
| FI+:-10 kV | |
| Mass Range | m/z 29 - 600 |
Results
Measurement results of reactive pyrolysis GC-TOFMS
Figure 3 shows EI TICC of reactive pyrolysis GC-TOFMS (blue: PET film, red: PET plate). Peaks 1 to 3 were observed as common components for both samples. In addition, peaks 4 to 11 were observed as components characteristic of the PET plate. Table 2 shows the integrated analysis results by msFineAnalysis of peaks 1 to 11 from the PET plate. The integrated analysis is a method to uniquely determine the molecular formula by integrating and analyzing the library database (DB) search results using the EI spectrum and the composition estimation results of the molecular ions in the FI spectrum. From this, it was found that peaks 1 to 3 are methylated derivatives of terephthalic acid and ethylene glycol, which are reaction pyrolysis products of PET. From the results of NIST library database (DB) search and molecular ion composition estimation of the FI spectrum, peaks 6 and 7 were presumed to be structure B or its isomer, and peaks 8 and 9 were presumed to be structure C or its isomer, respectively. Although peaks 4 and 5 could not be found in the DB search, they could be assumed to be structure A or its isomers from the results of EI spectrum and molecular ion composition estimation of FI spectrum. As described above, peaks 4 to 9 were found to be three types of reaction pyrolysis products derived from cyclohexanedimethanol and having different numbers of methyl groups. It was also speculated that there are two isomers for each type.
Next, peak 10 was presumed to be structure D from the DB search results and molecular ion composition estimation results of the FI spectrum, and was a reaction pyrolysis product reflecting the structure of PET. On the other hand, there was no corresponding compound for peak 11 in the DB search. Structural analysis was carried out from characteristic fragment ions (m/z 93, 108, 126) when comparing the EI spectrum with that of peak 10 and the result of molecular ion composition estimation of the FI spectrum. As a result, it was presumed to be structure E in which terephthalic acid and cyclohexanedimethanol were bound.
From the above results, it was presumed that the PET film was PET (A-PET or C-PET) and the PET plate was G-PET.
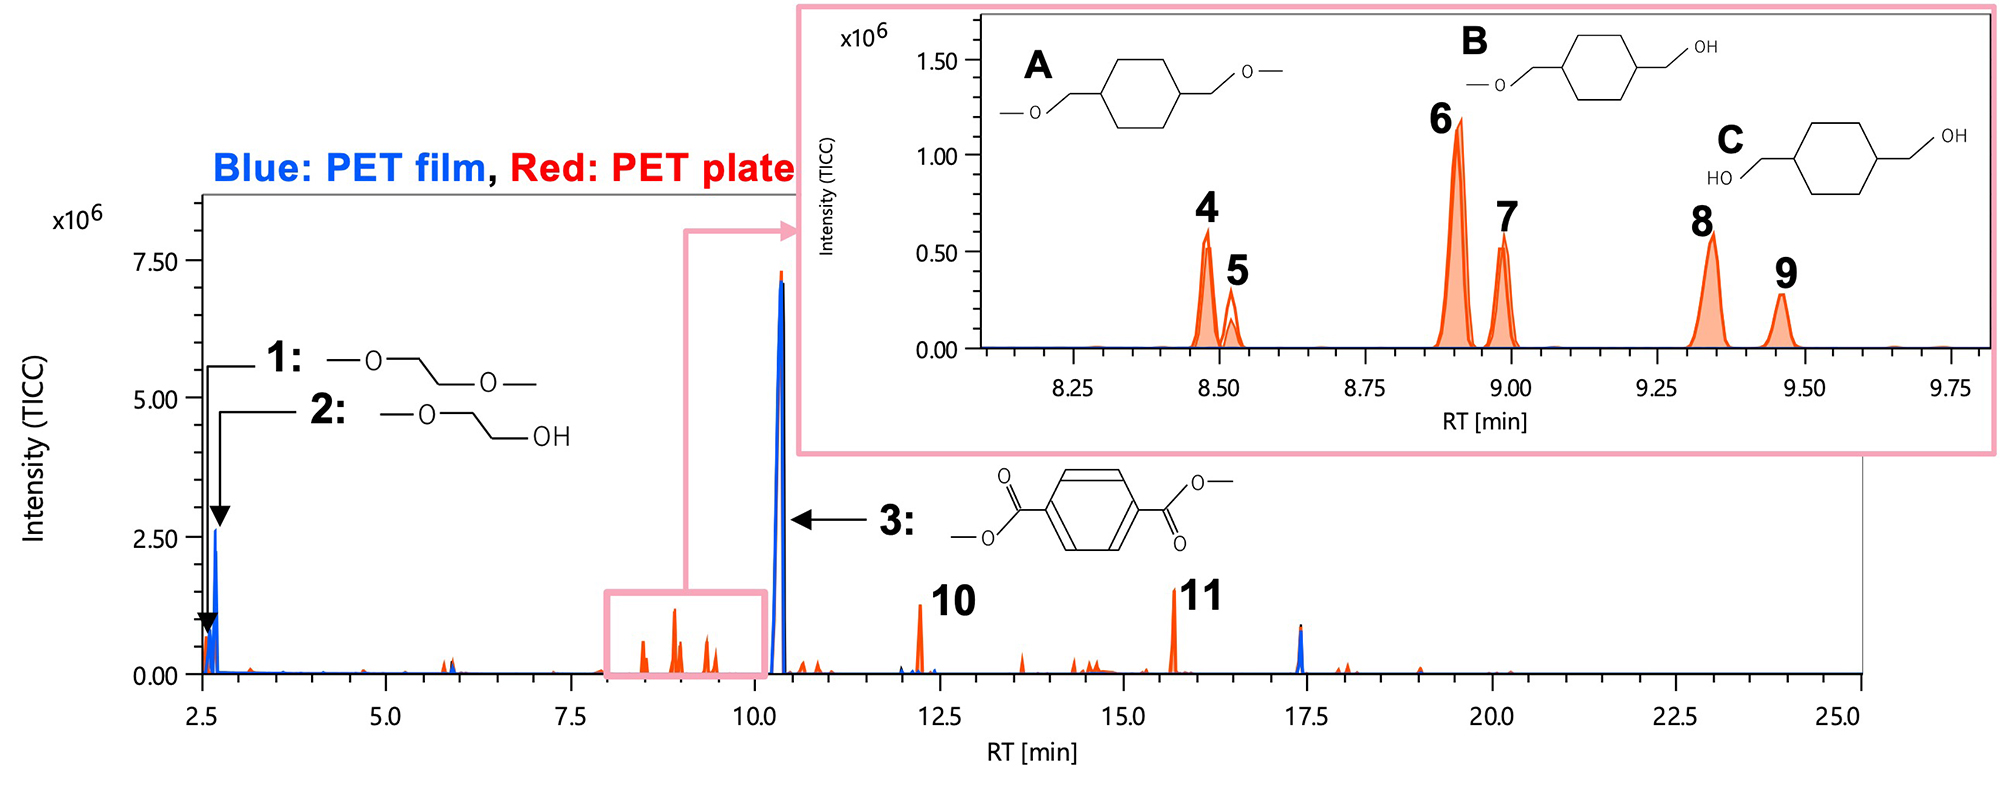
Figure 3 TICC of EI data
Table 2 Integrated qualitative analysis result of PET plate
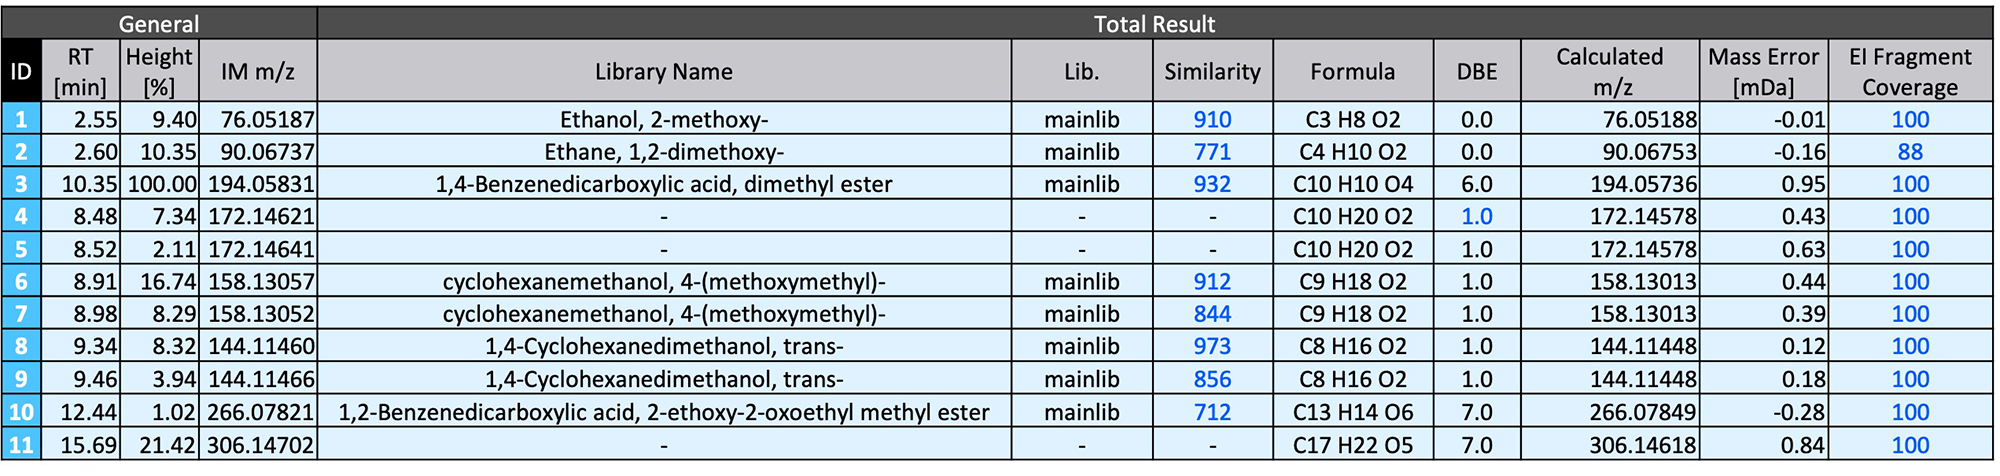
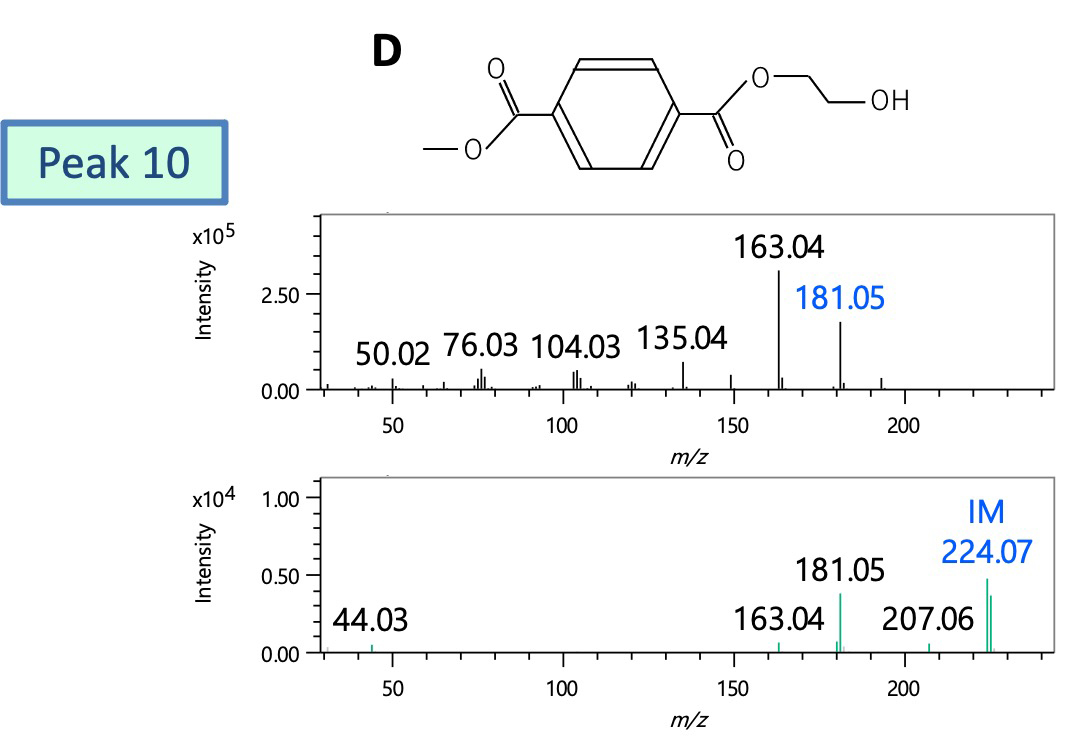
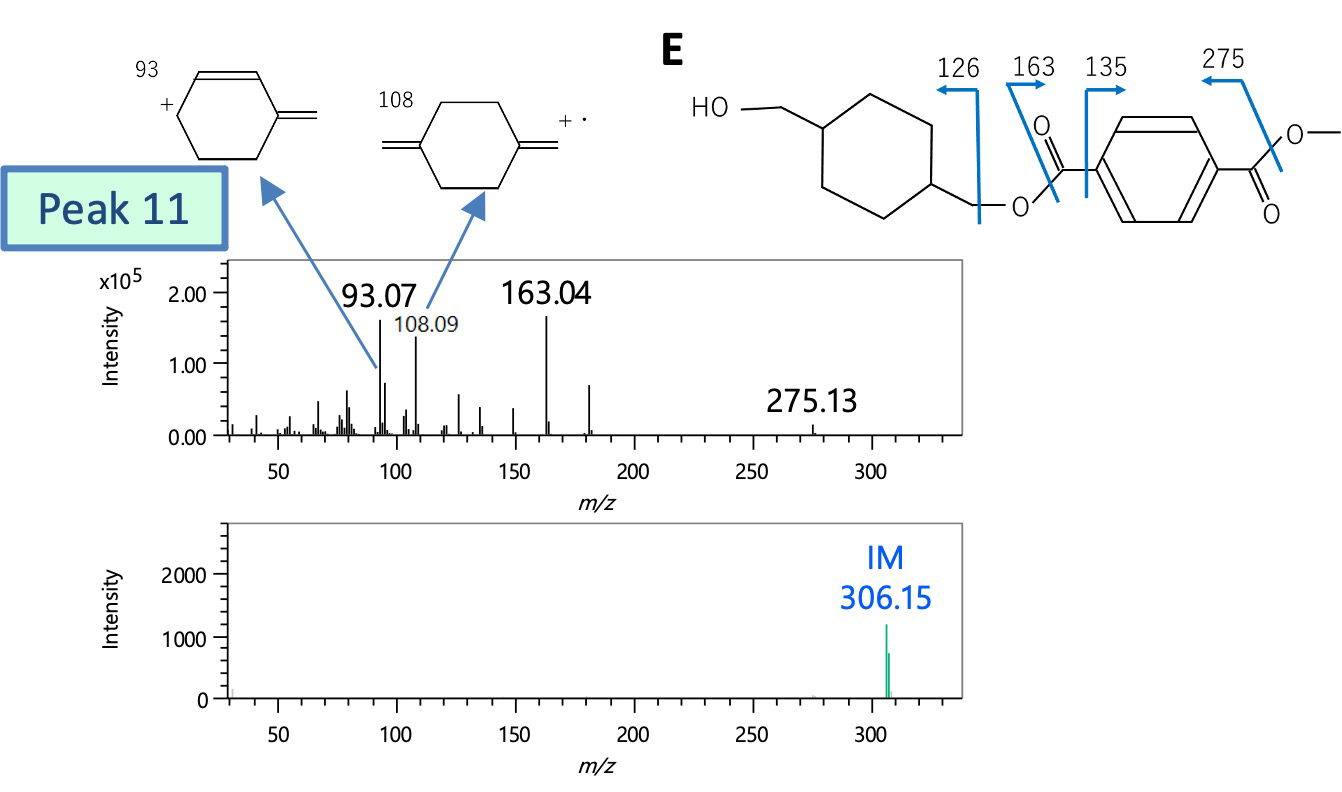
Figure 4 Mass spectra of peaks 10 and 11
1H NMR measurement results
Figure 5 shows the 1H NMR spectra of the PET film and the PET plate. Peaks 1 and 2 derived from terephthalic acid and ethylene glycol were commonly observed in the spectra of both samples. On the other hand, multiple peaks (peaks 3 to 12) were observed around chemical shifts of 1 to 5 ppm only for the PET plate. The PET plate was presumed to be G-PET from the results of reactive pyrolysis GC-TOFMS, so we searched PoLyInfo by polymer name and compared the NMR spectra listed with the observed NMR spectrum, and found high similarity. After confirming that, peak assignment was performed. As a result, peaks 3 to 12 were found to be derived from cyclohexanedimethanol. In the NMR spectrum, the peaks derived from the structural isomers of cyclohexanedimethanol are separated, and it is characteristic that the abundance ratio of the isomers can be discussed. Also, when the ratio of ethylene glycol and cyclohexanedimethanol was calculated from each peak area value for the PET plate, the ratio was approximately 2:1.
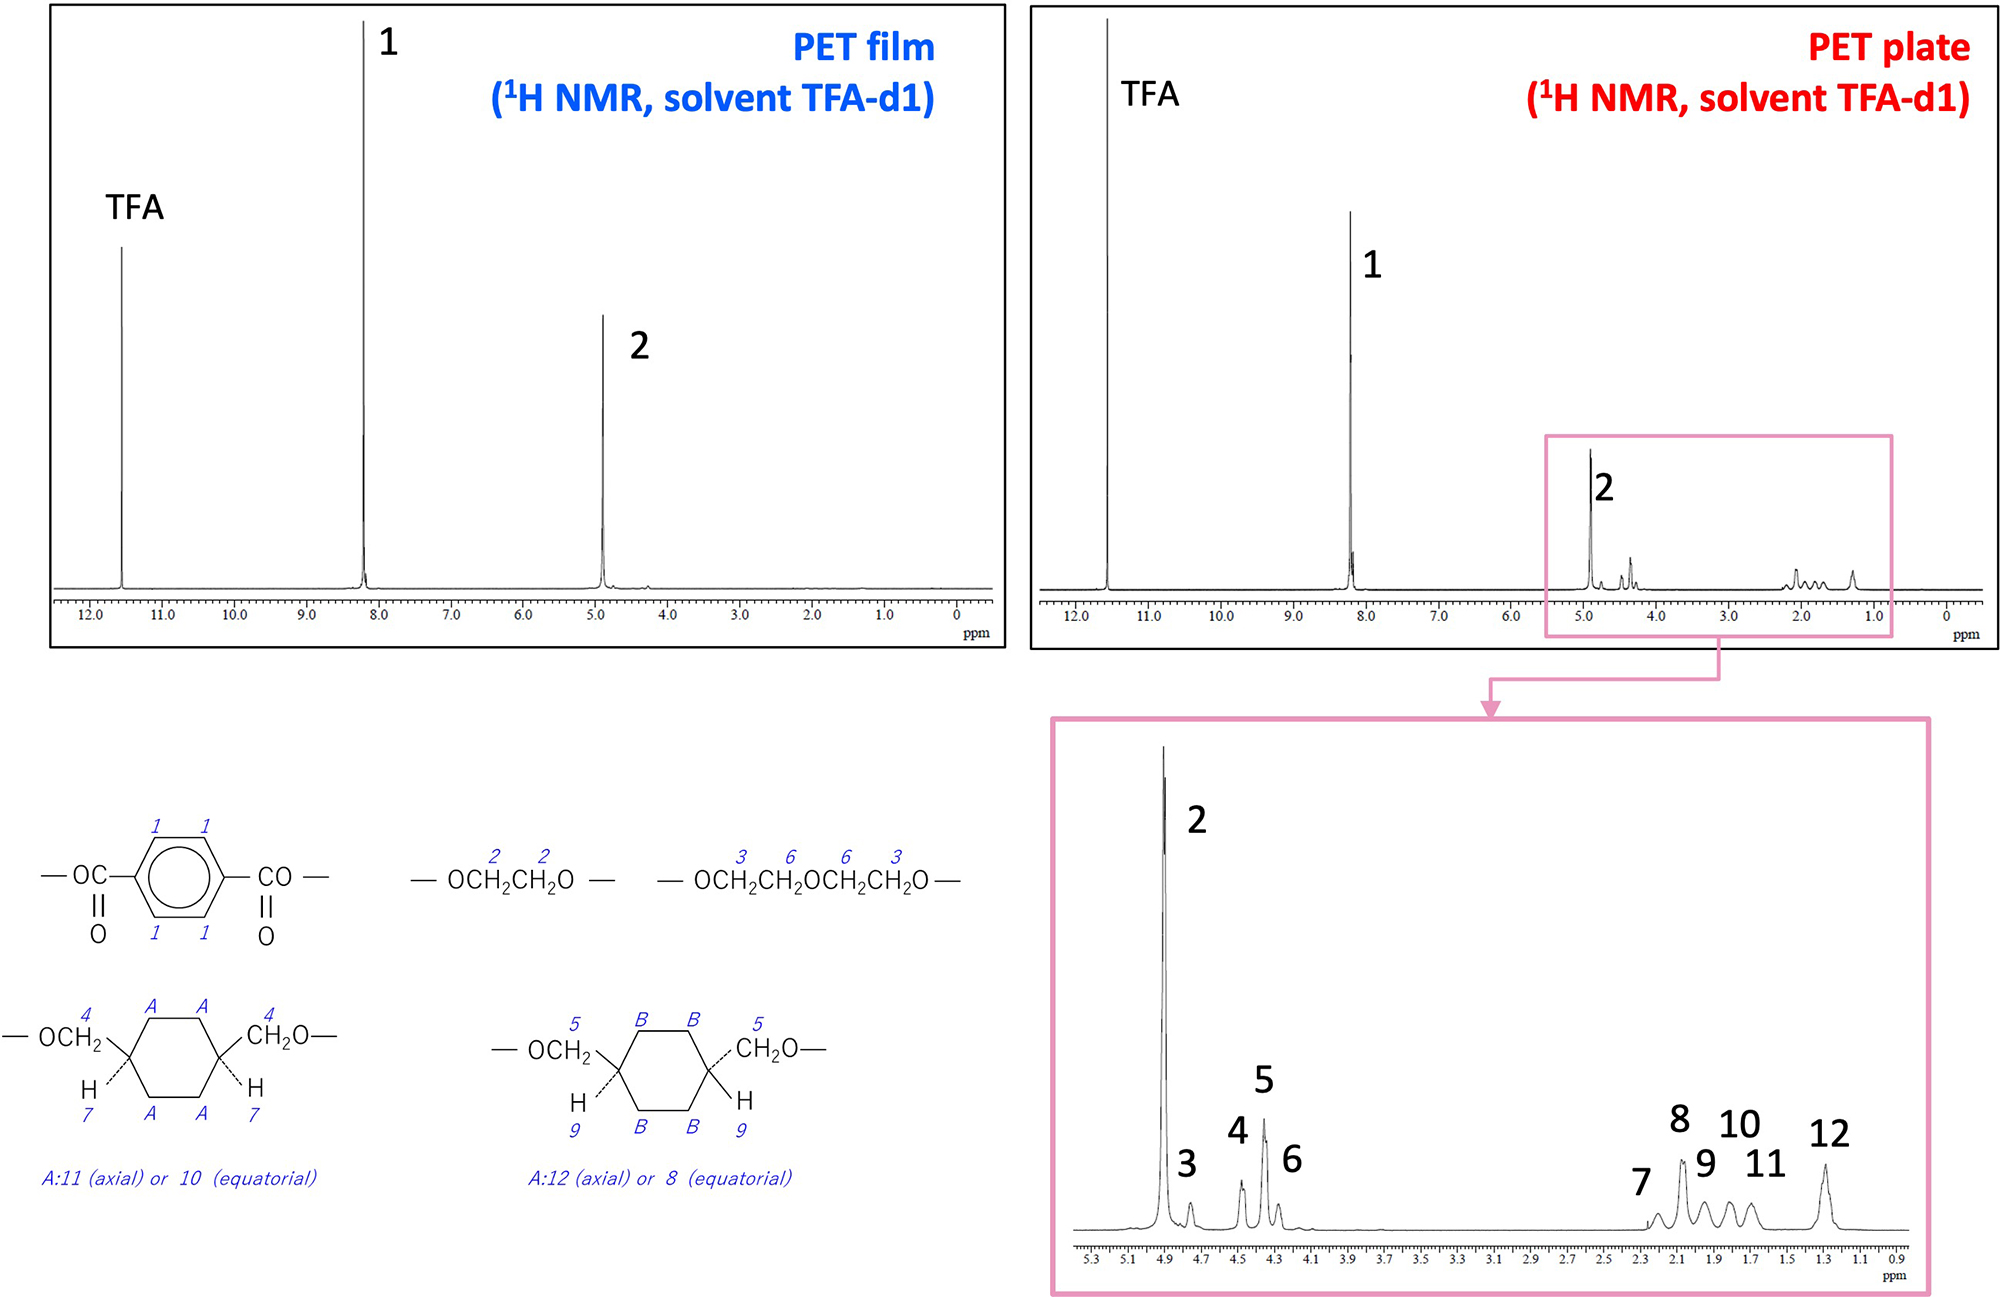
Figure 5 1H NMR spectra of PET film and PET plate
Summary
In this application note, we reported the results of structural analysis of commercially available PET film and PET plate by reactive pyrolysis GC-TOFMS and 1H NMR. Reactive pyrolysis GC-TOFMS clarified the difference in structure between the PET film and the PET plate, and was able to deduce that they were PET (A-PET or C-PET) and G-PET, respectively. Based on this information, the analysis of the 1H NMR results was facilitated, and it was found that the structural isomers and the ratio of ethylene glycol/cyclohexanedimethanol could be discussed. In this way, it is effective to comprehensively utilize the information obtained from each technique in structural analysis of polymers.
Reference
[1] NMR Database, https://polymer.nims.go.jp [accessed 2022-08-31]
Solutions by field
Related products
Are you a medical professional or personnel engaged in medical care?
No
Please be reminded that these pages are not intended to provide the general public with information about the products.