Workflow for Elucidating Complex Molecular Structures by using XtaLAB Synergy-ED and JEOL MS and NMR,
part 1 : JASON 1H Spectrum Simulation
ED2023-01E
Elucidate the best fit three-dimensional molecular structure using MS, NMR and XtaLaB Synergy-ED data
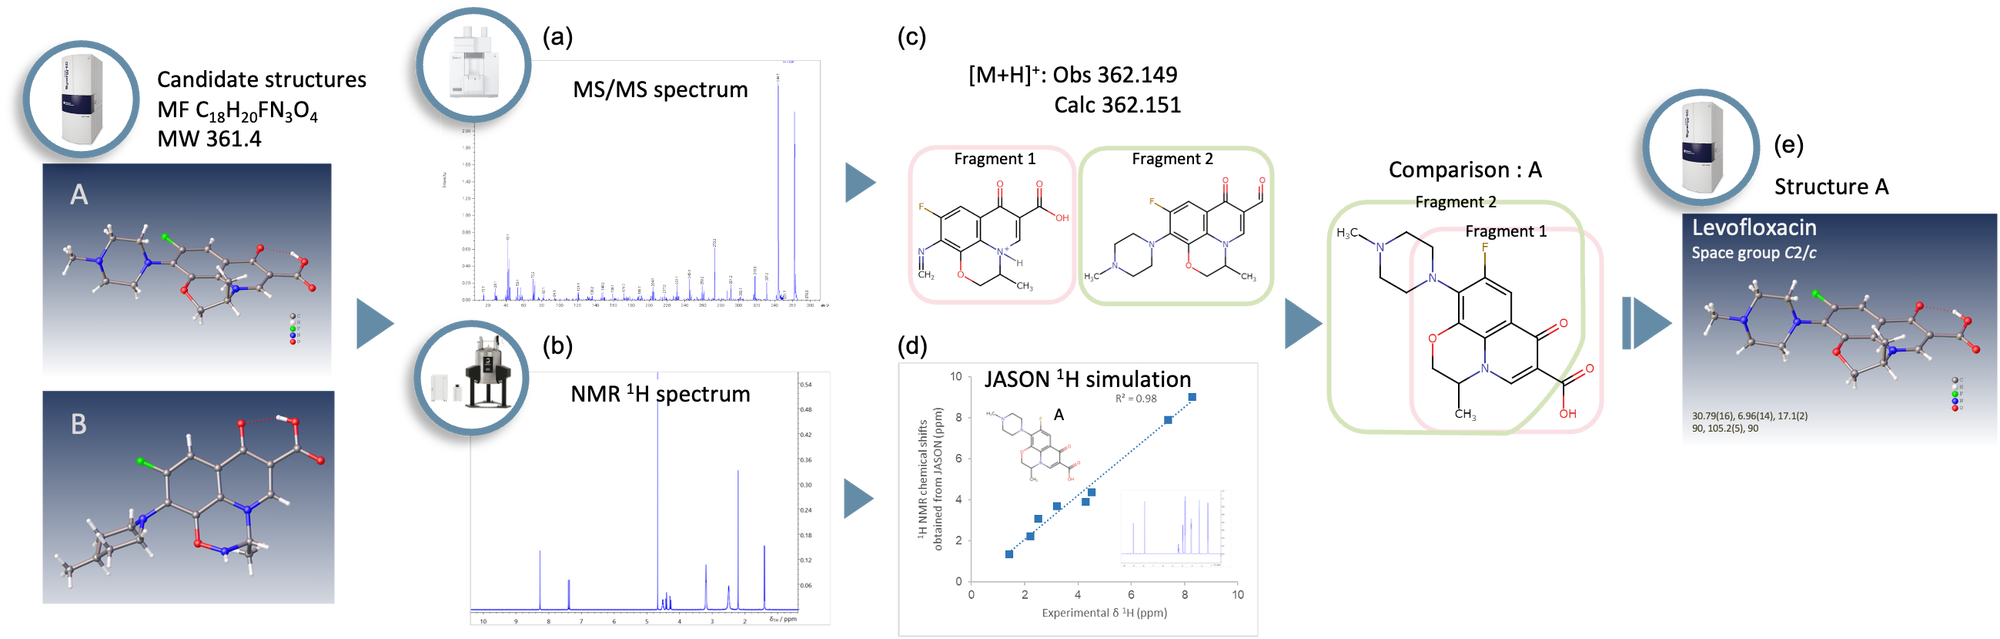
Figure 1. Workflow for analyzing the three-dimensional molecular structure of Levofloxacin. (a) MS/MS spectrum was measured using the JMS-S3000 SpiralTOF™-plus 2.0. (b) 1H NMR spectrum was measured using the JNM-ECZL 500R. (c) Accurate mass and estimated partial structures. (d) Correlation between the experimental 1H NMR chemical shifts and the simulated 1H NMR chemical shifts as predicted using JASON. (e) Crystal structure was obtained from the electron diffraction structure analysis using XtaLAB Synergy-ED.
XtaLAB Synergy-ED allows molecular structure analysis of submicron particles of laboratory chemicals, reagents and so on. Furthermore, the detailed chemical structure information can be obtained from a comprehensive analysis using the JEOL mass spectrometer (MS) and nuclear magnetic resonance (NMR) spectrometer. Figure 1 shows a workflow for the three-dimensional molecular structure analysis of Levofloxacin. This workflow identifies the optimum structure of the experimental MS, NMR, and electron diffraction data. In addition, it is possible to evaluate the consistency of the estimated structures by using the correlation between the experimental 1H NMR chemical shifts and the simulated 1H NMR chemical shifts of candidate structures. In the following, this application note explains the structure analysis workflow using the 1H NMR spectrum simulation of JASON (JEOL Analytical Software Network).
MS-JASON 1H NMR spectrum simulation and XtaLAB Synergy-ED : Diflubenzuron
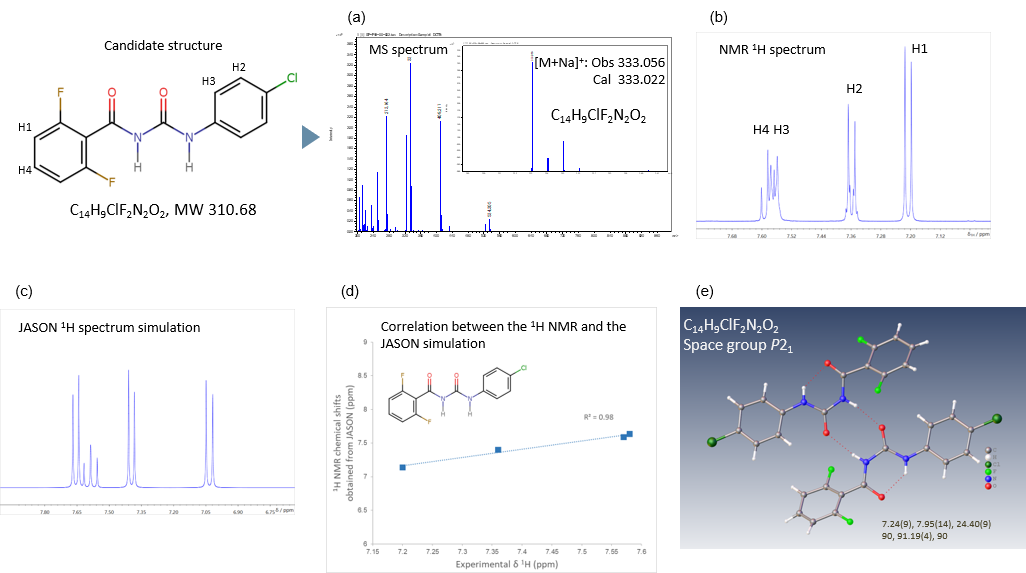
Figure 2. Workflow for analyzing the three-dimensional molecular structure of Diflubenzuron. (a) MS spectrum was measured using the JMS-S3000 SpiralTOF™-plus 2.0. (b) 1H with 19F decoupling NMR spectrum was measured using the JNM-ECZL 500R. (c) Simulated 1H NMR spectrum was predicted using JASON. (d) Correlation between the experimental 1H NMR and the simulated 1H NMR chemical shifts as predicted using JASON. (e) Crystal structure was obtained from XtaLAB Synergy-ED.
Figure 2 shows the results of the comprehensive analysis of Diflubenzuron powder, obtained from MALDI-TOFMS (matrix-assisted laser desorption/ionization time-of-flight mass spectrometry) using the JMS-S3000 SpiralTOF™-plus 2.0, NMR analysis using the JNM-ECZL 500R and electron diffraction analysis using XtaLAB Synergy-ED. For elucidating the molecular structure, the molecular formula is determined by using the Mass spectrum (Figure 2(a)). Then the result of MALDI-TOFMS is evaluated complementarily with the correlation between the experimental 1H NMR and the simulated 1H NMR chemical shifts of the estimated structure (Figure 2(d)). In Figure 2(d), this correlation showed good consistency. Furthermore, an initial structural model obtained from the electron diffraction analysis is refined using the MALDI-TOFMS and NMR results. Figure 2(e) shows the refined molecular structure elucidated from the comprehensive analysis of MALDI-TOFMS and NMR.
MS-JASON 1H NMR spectrum simulation and XtaLAB Synergy-ED : Voriconazole
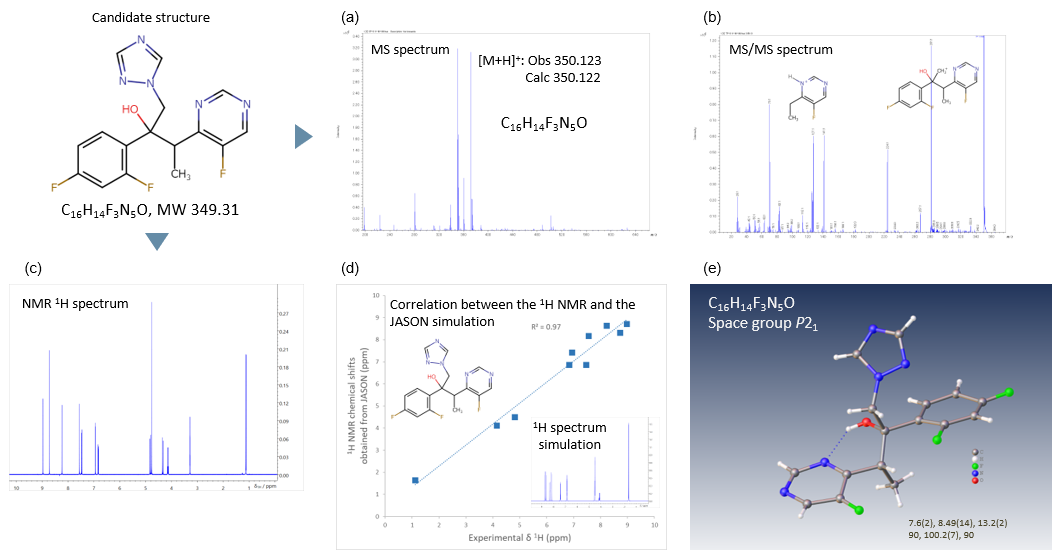
Figure 3. Workflow for analyzing the three-dimensional molecular structure of Voriconazole. (a) MS spectrum and (b) MS/MS spectrum were measured using the JMS-S3000 SpiralTOF™-plus 2.0. (c) 1H with 19F decoupling NMR spectrum was measured using the JNM-ECZL 500R. (d) Correlation between the experimental 1H NMR chemical shifts and the simulated 1H NMR chemical shifts as predicted using JASON. (e) Crystal structure was obtained from the electron diffraction structure analysis using XtaLAB Synergy-ED.
Figure 3 shows the results of the comprehensive analysis of Voriconazole powder, obtained from MALDI-TOFMS, NMR and electron diffraction analysis. The molecular formula and the partial structures are estimated by using the Mass spectrum (Figure 3(a)) and the MS/MS spectrum (Figure 3(b). Then the result of MALDI-TOFMS is evaluated complementarily with the correlation between the experimental 1H NMR chemical shifts (Figure 3(c)) and the simulated 1H NMR chemical shifts of the estimated structure (Figure 3(d)) . In Figure 3(d), this correlation showed good consistency. Figure 3(e) shows the refined molecular structure elucidated from the comprehensive analysis of MALDI-TOFMS and NMR.
Solutions by field
Related products

Are you a medical professional or personnel engaged in medical care?
No
Please be reminded that these pages are not intended to provide the general public with information about the products.