Delta Tips: How to Pick Peaks in 2D Spectra
NMDT_0065
This issue of Delta Tips shows how to pick peaks in 2D spectra in the 2D Viewer window.
Automatic Peak Picking:
Click the Auto Peak Pick button to automatically pick the peaks which are above the peak threshold level.
Manual Peak Picking:
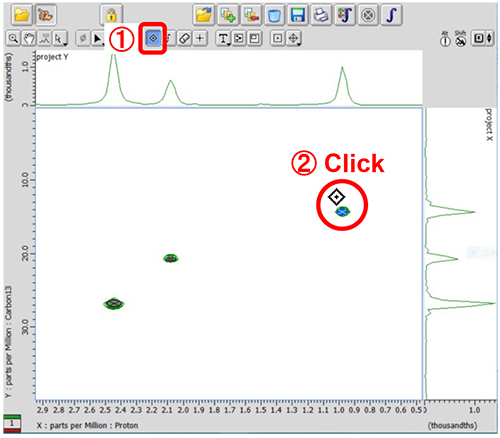
① Click the Create Peak button. Note that the cursor has changed into the Peak symbol.
② Click the 2D data with the cursor.
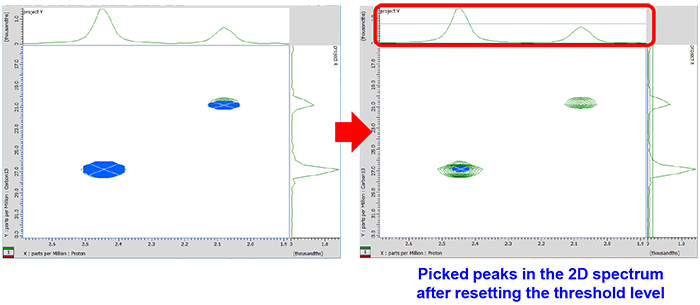
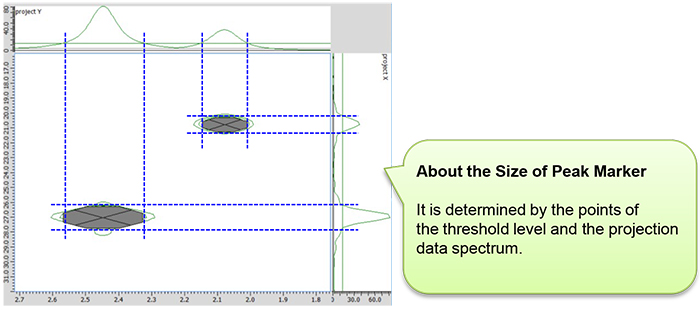
It is possible to pick the peaks which are above the peak threshold level.
Peak picking in 2D spectrum
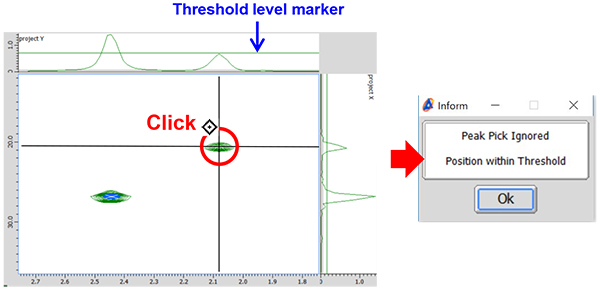
★It is impossible to select the peaks which are below the peak threshold level.
If you try to select this peak, an inform dialog box appears and the peak is ignored.
It is possible to set the peak threshold level manually as follows.
A. Using the Level Tool:
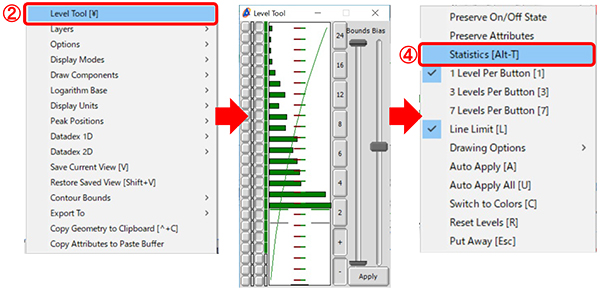
① Push and hold the right mouse button on the 2D data to display the context menu.
② Select Level Tool to display the Level Tool window.
③ Push and hold the right mouse button in the Level Tool window to display the context menu of the Level Tool window.
④ Select Statistics in the context menu of the Level Tool window.
⑤ Select a point in the ⑤ area in the Level Tool window to set the peak threshold level.
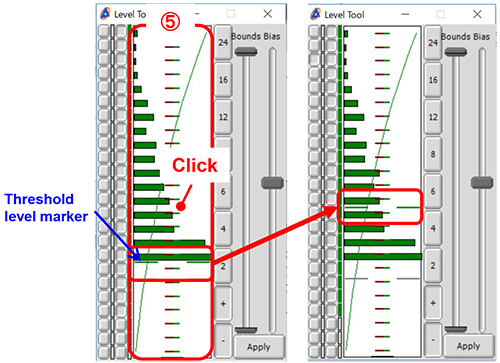
⑥ Click the Apply button in the Level Tool window to apply the change.
★It is possible to apply changes automatically as follows:
Select Auto Apply in the context menu of the Level Tool window (see above).
Note that the Apply button has changed into the Auto Apply button.
B. Using the Projection data:
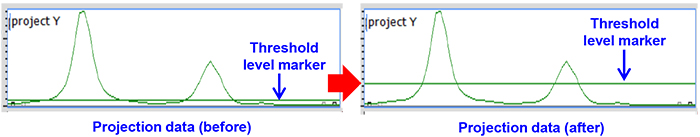
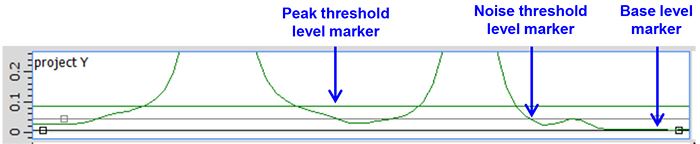
① Click inside the Projection data area and click the Threshold button in the 2D Viewer window to display the threshold level markers on the projection data.
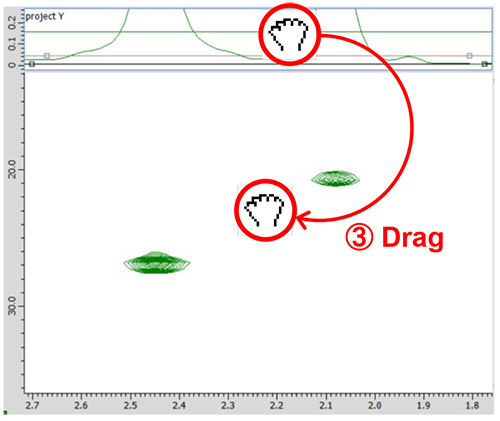
② Select the peak threshold level marker and note that the cursor has changed into the Threshold symbol. Drag and drop it where needed.
③ Right-click the projection data and drag onto the 2D data to apply the changes to the 2D data. It is possible to use this function only when the Threshold button is selected and has changed into the button highlighted in blue.
④ Click the Auto Peak Pick button or the Create Peak button (please see page 1) to pick peaks which are above the threshold level.
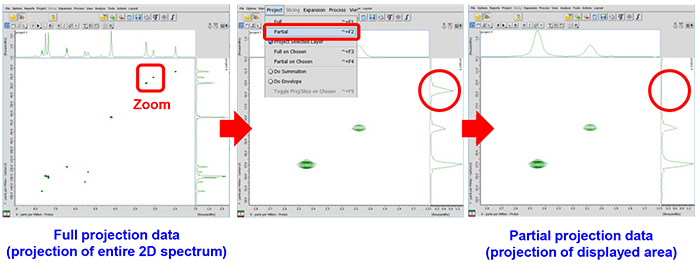
★The projection data display full projection as default. It is possible to display
the projection data of the currently displayed area as follows:
Zoom your 2D data and select Project-Partial in the 2D Viewer window.
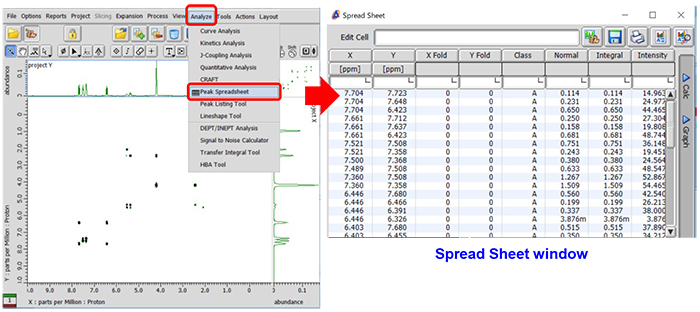
★Details for all picked peaks can be summarized in the Spread Sheet window as follows:
Select Analyze-Peak Spreadsheet to open the Spread Sheet window.
★For the details of the Spread Sheet window, refer to Delta Tips Spread Sheet (Part 1) and Deconvolution Function (⇒NMDT_0008 and ⇒NMDT_0059).
- Please see the PDF file for the additional information.
Another window opens when you click. 
PDF 1.35 MB
SEARCH APPLICATIONS
Related Products
Are you a medical professional or personnel engaged in medical care?
No
Please be reminded that these pages are not intended to provide the general public with information about the products.