Change in ESR line-shape with sample concentration
ER220002E
ER220002E
Example of measurement -TEMPOL-
The line-shape and width of the ESR signal change under the influence of the sample state (gas, liquid, solid, concentration, etc.). When the sample in solution is measured at low temperature, as the viscosity of the sample increases, the molecular motion of radicals is suppressed and the line-shape of the ESR signal also changes. Please refer to application note ER210002E for example of measurement.
In this note, we will introduce the line-shape change of the ESR signal with concentration when TEMPOL powder is diluted with ultrapure water. ESR signal was measured under the same conditions except for the amplitude. When measuring TEMPOL powder, single ESR line was observed at g = 2.0070. When TEMPOL powder was diluted to 0.2 mol/L with ultrapure water, single line was observed as well. Further diluting to 0.1 mol/L confirmed splitting of the ESR signal, and at 0.02 mol/L, splitting of 3 lines by nitrogen nuclei was observed at g = 2.0057. Electron exchange between radicals occurs frequently as the radical concentration in the sample increases. The result is that the magnetic interaction averages to a single line. For the samples with hyperfine interaction, it is necessary to dilute to an appropriate concentration.
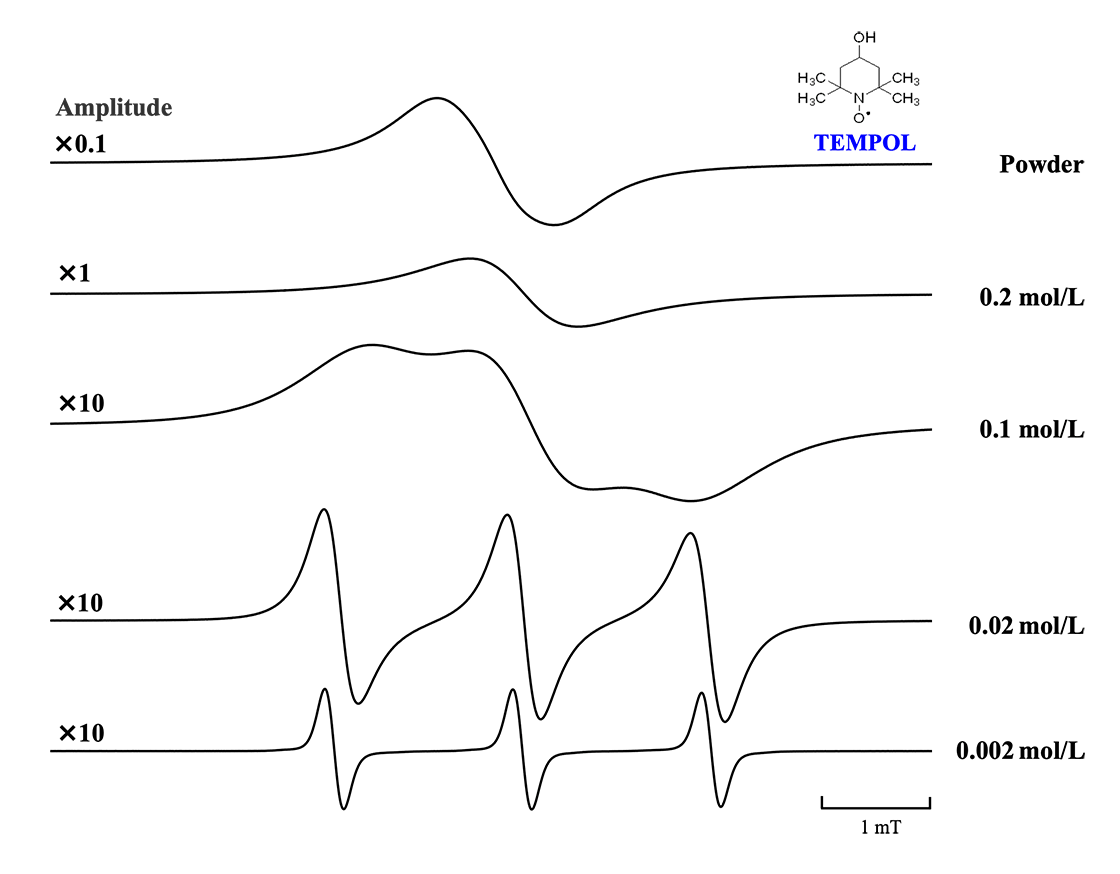
Figure 1. Change in ESR line-shape with concentration of TEMPOL.
Solutions by field
Related products
Are you a medical professional or personnel engaged in medical care?
No
Please be reminded that these pages are not intended to provide the general public with information about the products.