Variation of ESR line shape with temperature
ER210002E
Variation of ESR signal of TEMPOL solution
TEMPOL was dissolved in the mixed solvent of ultrapure water and glycerin and was measured at some temperatures with a variable temperature controller (ES-13060DVT5). At 25 °C, the ESR signal was split into three lines (2nI = 2 × 1 × 1 + 1 = 3) due to the presence of one 14N (I = 1) in the vicinity of an unpaired electron. Figure 1 shows that line shape and intensity of the ESR signal changes with temperature. An isotropic ESR signal is observed in solution phase due to fast molecular motion. On the other hand, the viscosity of the sample increases and the ESR signal line shape becomes anisotropic (anisotropic g and A tensors) as the temperature decreases. The mobility change of radical (such as the rotational correlation time) is estimated from the change of the ESR signal line shape[1].
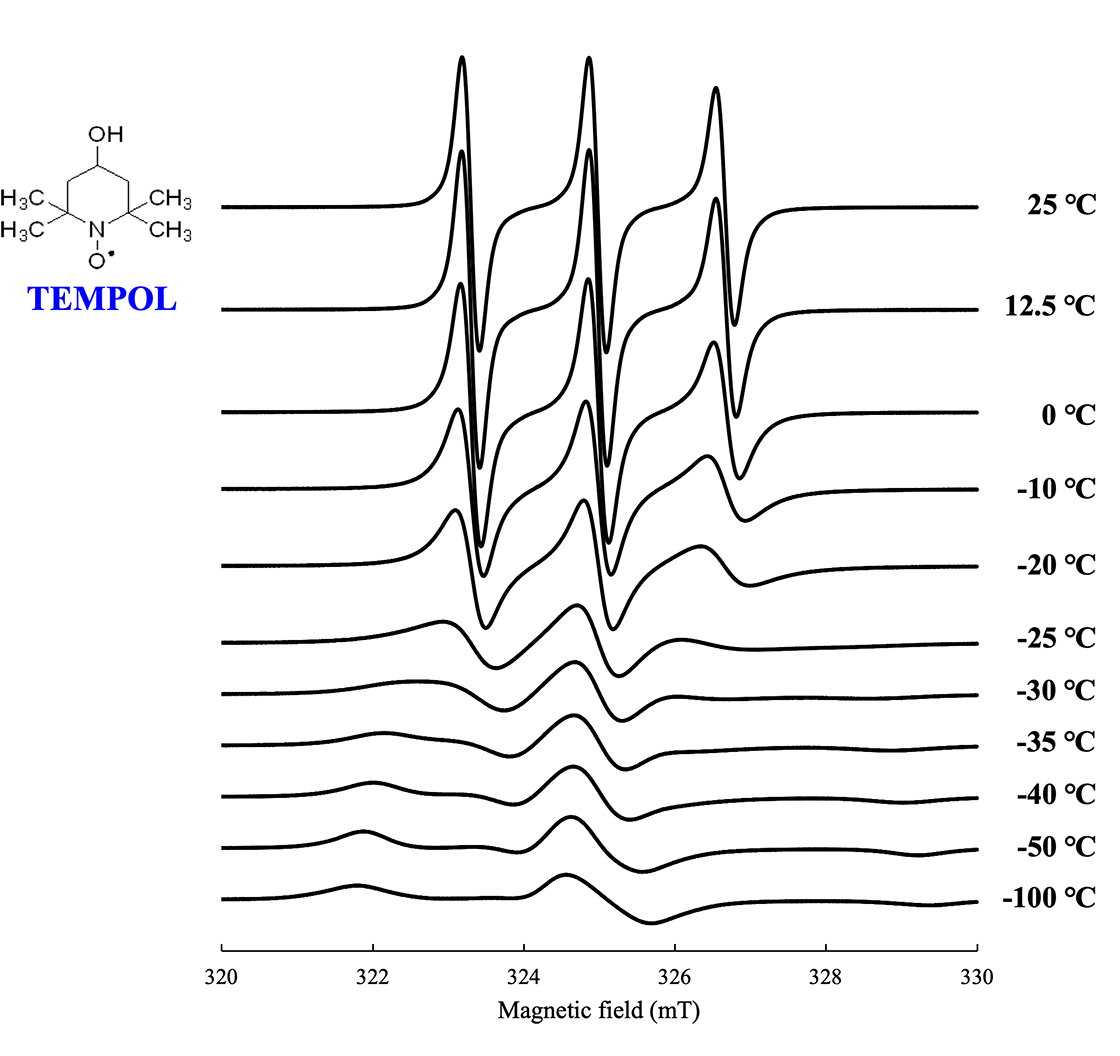
Figure 1. Temperature dependence of the ESR line shape of TEMPOL.
Reference
[1] Berliner J. L. (1976) : Spin Labeling : Theory and Applications (Molecular Biology Series, Vol 1), Academic Press, 608p.
- Please see the PDF file for the additional information.
Another window opens when you click. 
PDF 612.9 KB
SEARCH APPLICATIONS
Related Products
Solutions by field
Are you a medical professional or personnel engaged in medical care?
No
Please be reminded that these pages are not intended to provide the general public with information about the products.