Integrated Analysis of an Acrylic Resin using msFineAnalysis Ver.2
MSTips No.300
General
Electron ionization (EI) is commonly used in GC-MS systems and produces mass spectra that are characterized by extensive fragmentation. In this case, compounds are typically identified by searching the fragmentation pattern against mass spectral databases. However, molecular ions may be weak or absent in EI mass spectra. Conversely, soft ionization methods such as field ionization (FI), photoionization (PI), and chemical ionization (CI) can provide molecular ions with minimal fragmentation. Furthermore, a high-resolution time-of-flight mass spectrometer (HRTOFMS) can be used to measure the exact masses for both the molecular ions and fragment ions. Combining the exact mass and molecular weight information with the results of a conventional library search can enhance the accuracy of identification when database searches alone are insufficient.
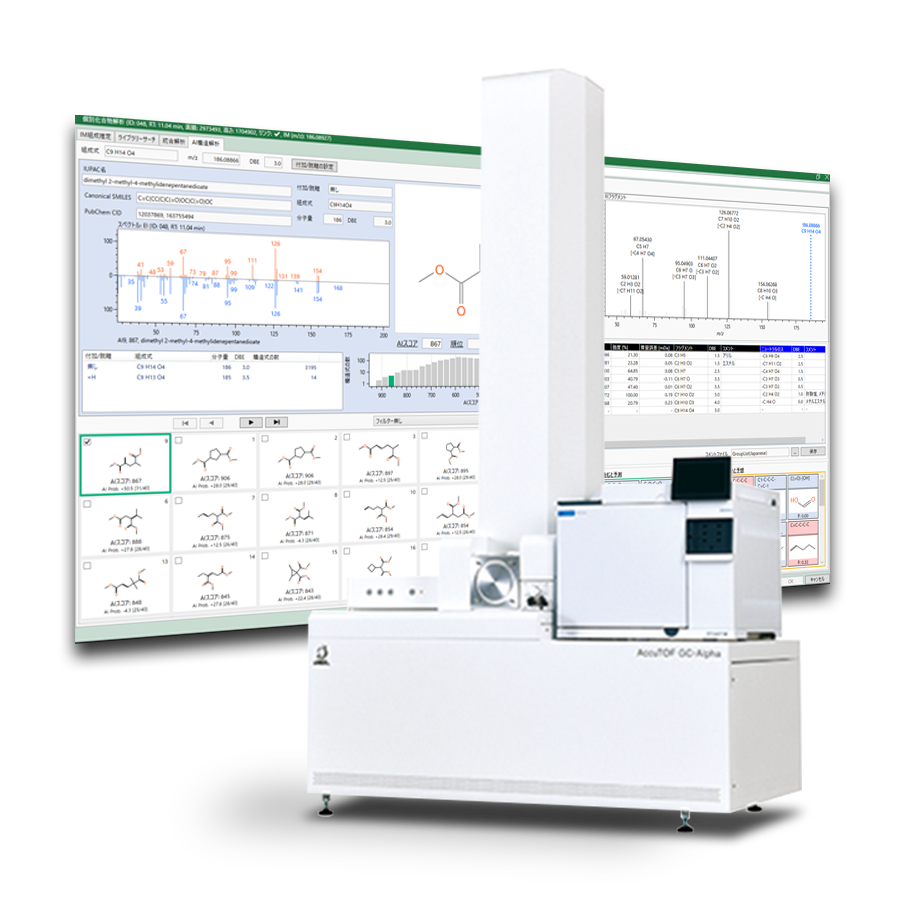
In 2018, msFineAnalysis Ver.1 software was released in which data acquired by EI, soft ionization, and accurate mass measurements were automatically integrated to generate a qualitative report for samples measured by these techniques with GC-MS. Recently, msFineAnalysis Ver.2 was introduced as an enhanced version with additional features. In this work, we will describe the changes in Ver.2, which now includes chromatographic deconvolution, and present applications using the new features.
Software Enhancements
Changes in msFineAnalysis Ver.2:
Version 2 continues to use the integrated analysis work flow (see MS Tips 275) and TICC peak detection developed in Ver.1. Major changes from Version 1 include: 1) Improved graphical user interface (GUI), 2) chromatographic deconvolution, and 3) Group Analysis.
1) Improved GUI:
Version 2 supports two languages: English and Japanese. The GUI was extensively modified to display tabulated integrated analysis results and chromatograms on a single view. Color schemes are now represented by Color Universal Design (CUD) to enhance visibility for people with different kinds of color vision.
2) Chromatographic deconvolution:
Chromatographic deconvolution reconstructs mass spectra by using information (m/z, area) of peaks detected in extracted ion chromatograms (EIC) using the exact masses of the ions observed. This provides high-quality mass spectra for coeluting components that may appear as a single peak in the total ion current chromatogram (TICC).
3) Group Analysis:
Group analysis identifies related compounds in a complex mixture by creating selected ion chromatograms for compounds that have common fragment ions or common neutral losses. This makes it easier to examine component groups and isomers having a similar partial structure.
Experimental
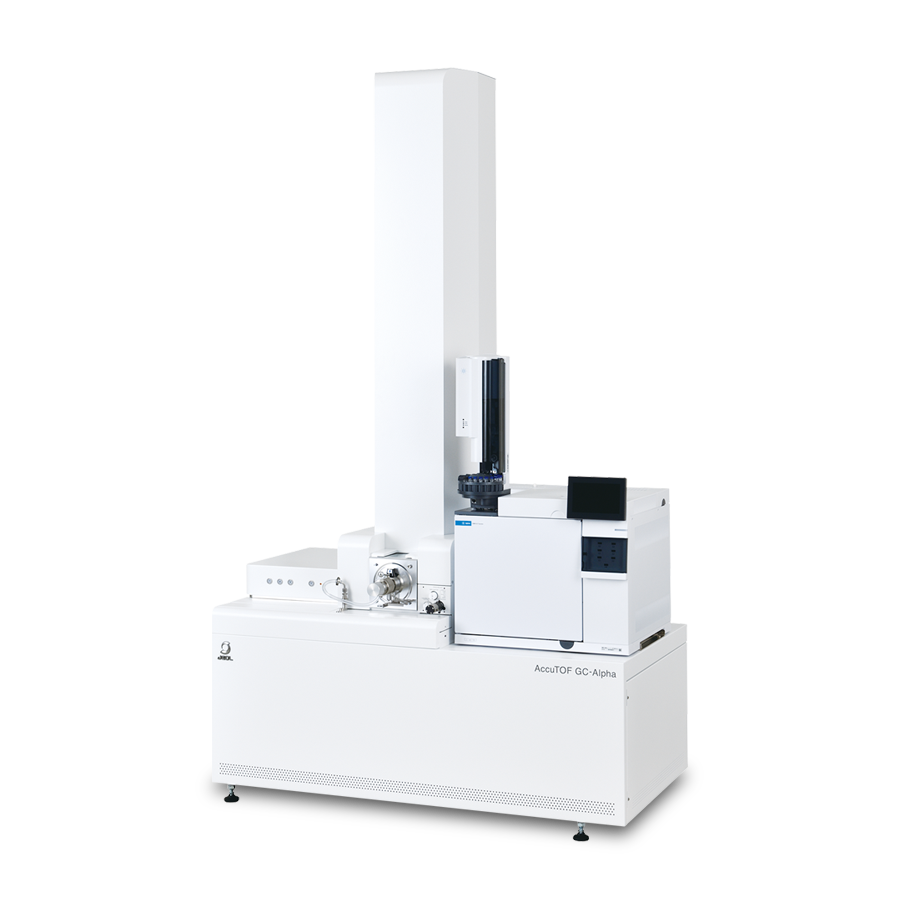
A commercial acrylic resin was used as a model sample. A JEOL JMS-T200GC GC-HRTOFMS was used for analysis, and a Frontier Lab pyrolysis inlet was used for sample pretreatment. Additionally, the system was equipped with an EI/FI combination ion source for this work. The resulting data were analyzed by using msFineAnalysis version 2 (JEOL). Table 1 shows the pyrolysis and GC-HRTOFMS analysis conditions.Table 1. Measurement conditions
| [Pyrolysis condition] | |
| Pyrolyzer | PY-3030D (Frontier Lab) |
| Pyrolysis Temperature | 600°C |
| [GC condition] | |
| Gas Chromatograph | 7890A GC (Agilent Technologies) |
| Column | ZB-5MSi (Phenomenex), 30m x 0.25mm, 0.25μm |
| Oven Temperature | 40°C (2min)-10°C/min-320°C (15min) |
| Injection Mode | Split mode (100:1) |
| [MS condition] | |
| Spectrometer | JMS-T200GC (JEOL Ltd.) |
| Ion Source | EI/FI combination ion source |
| Ionization | EI+: 70eV, 300μA |
| FI+: -10kV, 40mA/30msec | |
| Mass Range | m/z 35-800 |
| [Data processing condition] | |
| Software | msFineAnalysis (JEOL Ltd.) |
| Library database | NIST17 |
| Tolerance | ±5mDa |
| Electron | Odd |
| Element set | C:0-50, H:0-100, O:0-10 |
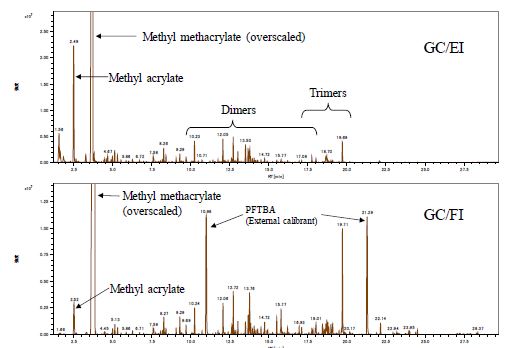
Figure 1. Py-GC/EI and Py-GC/FI total ion current chromatograms of an acrylic resin polymer at 600°C
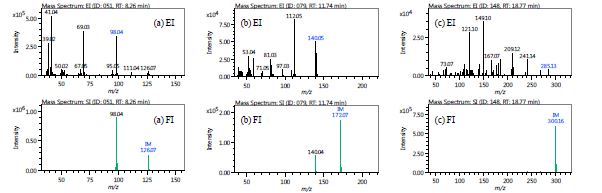
Figure 2. EI and FI mass spectra of related compounds with (a) monomer, (b) dimer and (c) trimer
Results and Discussion
Figure 1 shows the TICC data for both GC/EI and GC/FI measurements. Methyl acrylate (MA) and methyl methacrylate (MMA) were detected at high intensity. Dimers and trimers were observed at retention times of 10 min and 18 min, respectively. Figure 2 shows typical mass spectra for the monomers, dimers, and trimers. Molecular ions were detected at high relative intensity in FI mass spectra but were weak or absent in the EI mass spectra. Many of the acrylic resin pyrolysates do not have entries in the library database, making it difficult to identify their components by library search alone. Additionally, soft ionization was essential because EI did not produce molecular ions for many compounds as shown in Figure 2b and 2c.
When the msFineAnalysis Auto Analysis was used on for the GC/EI and GC/FI data, 161 components were automatically detected. Ultimately, molecular formulas of 154 components out of the 161 were uniquely identified. Additionally, the formulas of EI fragment ions, which were obtained from accurate mass data, resulted in structural information for the sample molecules. Next, monomers, dimers, and trimers were examined using Group Analysis—the results are shown in Table 2. Out of the 161 components, 46 were directly related to the monomers, dimers, and trimers. In Group Analysis, molecular ions of a desired repeat unit formula are specified and analyzed, speeding up the analysis process. The results for the Group Analysis can be exported, making it easier to calculate the relative intensities using the sum of the chromatogram peak areas shown in Table 2. Other components detected include pyrolysis products in which alkyl chains are bonded with monomers, dimers, and trimers.
Table 2. Integrated qualitative analysis result for monomer, dimer, trimer and their isomers
| Type | Compound | Formula | Mw | Isomer | Sum of chromatogram peak area | Relative Intensity [%] |
| Monomer | Methyl acrylate (MA) Methyl methacrylate (MMA) |
C4H6O2 C5H8O2 |
86 100 |
2 3 |
55,268,874 837,060,254 |
5.8 88.0 |
| Dimer | MA + MA MA + MMA MMA + MMA |
C8H12O4 C9H14O4 C10H16O4 |
172 186 200 |
3 5 11 |
1,620,349 11,853,421 23,475,603 |
0.2 1.2 2.5 |
| Trimer | MA + MA + MA MA+ MA + MMA MA + MMA + MMA MMA + MMA + MMA |
C12H18O6 C13H20O6 C14H22O6 C15H24O6 |
258 272 286 300 |
3 6 9 4 |
1,181,635 7,004,668 5,205,642 9,045,242 |
0.1 0.7 0.5 1.0 |
Conclusions
The integrated analysis method produces highly accurate qualitative analysis results from the database entries with high match scores by combining the library search results and molecular formula estimation. Additionally, this analysis makes it possible to determine molecular formulas for unknown components not registered in a library database that cannot be identified by database searching alone. The integrated analysis method made it possible to determine molecular formulas from exact mass results, regardless of the level of match factor score. This narrowed down the candidate compositions, demonstrating the effectiveness of this software for GC/MS qualitative analysis.
- Please see the PDF file for the additional information.
Another window opens when you click. 
PDF 1.46MB
Related Products
Are you a medical professional or personnel engaged in medical care?
No
Please be reminded that these pages are not intended to provide the general public with information about the products.