Kramers-Kronig analysis
Kramers-Kronig analysis
A spectrum of electron energy-loss spectroscopy (EELS) gives the imaginary part of the reciprocal of the dielectric function 1/ ε(ω). When the Kramers-Kronig relation is applied to the imaginary part, the real part of 1/ ε(ω) is obtained. The complex dielectric function ε(ω)=ε1(ω) + iε2(ω) is derived from the obtained real and imaginary parts of 1/ ε(ω) using algebraic calculations. The method to derive ε(ω) = ε1(ω) + iε2(ω) from the imaginary part of 1/ ε(ω) is called "Kramers-Kronig analysis (KK analysis)". Since the complex dielectric function provides the optical properties (refractive index, reflectance and optical absorption) of materials, KK analysis is an essential method to obtain the optical properties of materials from the EELS spectrum.
Procedure of Kramers-Kronig analysis in EELS
The procedure to obtain the complex dielectric function ε(ω) from an EELS spectrum of diamond using KK analysis is described below.
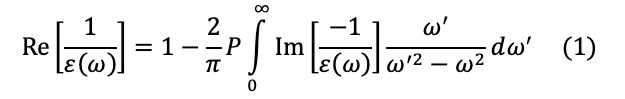
- 1 ) The multiple scattering intensity of plasmon (the collective oscillation of the whole valence electrons) is removed from the EELS spectrum of diamond (black line in Fig. 1(a)) by using the Fourier-log deconvolution method, as indicated with arrow ①.
- 2 ) The tail of the zero-loss peak at an energy range of 0-2 eV is removed (arrow ② in Fig(a)). Two methods are used to remove the tail; one is to directly measure the zero-loss intensity distribution without inserting a specimen, and the other is to reproduce the intensity distribution using a certain mathematical function for fitting.
- 3 ) The spectral intensities which are scattered outside the acceptance angle of the analyzer are corrected. It is noted that the inelastic scattering of electrons is almost forward scattering, but part of inelastic scattering goes out of the acceptance angle of the analyzer.
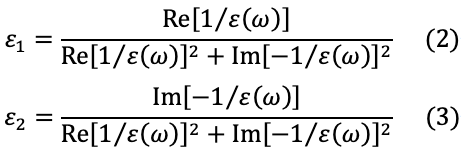
The spectrum subjected to the corrections of 1) to 3) is called "single scattering spectrum distribution (SSD)". - 4 ) The SSD intensity ISSD(ω) is normalized to derive the loss function Im[-1/ ε (ω)] (solid line in Fig. 1(b)). For the normalization of ISSD(ω), the Sum-rule method (Appendix 1) is applied, which is based on the fact that the spectral intensity is proportional to the number of electrons in a solid.
- 5 ) Using the Kramers-Kronig relation (equation 1) (described below), Re[1/ ε (ω)] is derived from Im[-1/ ε (ω)] (dotted line in Fig. 1(b)).
- 6 ) Finally using algebraic equations (2) and (3) (described below), the dielectric function ε (ω) is derived (Fig. 1(c)).
Kramers-Kronig relation
The Kramers-Kronig relation (The relation between the real and imaginary parts of the frequency response function in the linear response theory) is used to obtain the real part of the complex dielectric function Re[ε (ω)] from the imaginary part of the function Im[ε (ω)], the imaginary part being obtained by spectroscopic measurements [1, 2]. Similarly, from the loss function Im[–1/ ε (ω)] obtained by an EELS spectrum, Re[1/ ε (ω)] is derived using the following equation (1) or the Kramers-Kronig relation.
Here, Re and Im represent respectively the real and imaginary parts of the complex function. ω represents the angular frequency. P is called "principal value of Cauchy's integral", which means the integral except for the pole ω = ω'. The integral of the angular frequency is performed from 0 to infinity but the energy range of the measured EELS spectrum is limited less than 100 eV. Thus, for calculating equation (1), the spectrum is extrapolated up to 400-500 eV.
From Re[1/ ε (ω)] and Im[-1/ ε (ω)], the real part ε1(ω) and the imaginary part ε2(ω) of the complex dielectric function are calculated using the following algebraic equations (2) and (3).
What are revealed from the dielectric function
From the derived dielectric function (Fig. 1(c)), the followings are revealed.
- 1 ) The real part ε1(0) of the dielectric function at ħω=0 eV derived from the EELS measurement, that is, the dielectric constant of diamond is ε=5.7. The value is in good agreement with an optical measurement result.
- 2 ) It is seen that the plasmon excitation conditions, ε1(ω)~0 and ε2(ω)<<1 are satisfied at an energy of ħω=34 eV. The volume plasmon peak is observed in the EELS spectrum at the energy.
- 3 ) ε1(ω) shows a strong resonance-type dispersion at 12 eV. This corresponds to an interband transition. At this event, a strong spectral peak (blue peak) in the imaginary part ε2(ω) appears due to an energy absorption by the transition. This interband transition is the transition from the bonding orbital σ to the anti-bonding orbital σ* of the sp3 electron orbital. A weak absorption due to the transition from the 2p bonding orbital to the 2s anti-bonding orbital is seen at approximately 7 eV, showing a weak dispersion of ε1(ω) and a weak absorption of ε2(ω) (vertical dotted line).
- 4 ) At 5.5 eV (inverted triangle ▼), the onset in the intensity of ε2(ω) is seen. This corresponds to an indirect transition between the two energy bands, which needs phonon excitations. Thus, this absorption is weak compared with the absorption due to the direct transition.
It should be noted that a shoulder at 7 eV and a peak at 12 eV in the imaginary part ε2(ω) due to energy absorptions are not clearly observed in the EELS spectrum (Fig. 1(a)). Those structures are elucidated only when the EELS spectrum is transformed to the imaginary part ε2(ω) of the dielectric function by KK analysis.
On the other hand, the spectrum of ε2(ω) obtained by optical measurement does not provide the plasmon peak. The advantage of EELS is that plasmons can be observed directly. Furthermore, the band gap energy can be measured directly from the onset energy of the EELS intensity (inverted triangle ▼ in Fig. 1(a)) without KK analysis, and also agrees with the onset ofε2(ω) (inverted triangle ▼ in Fig. 1(c)).
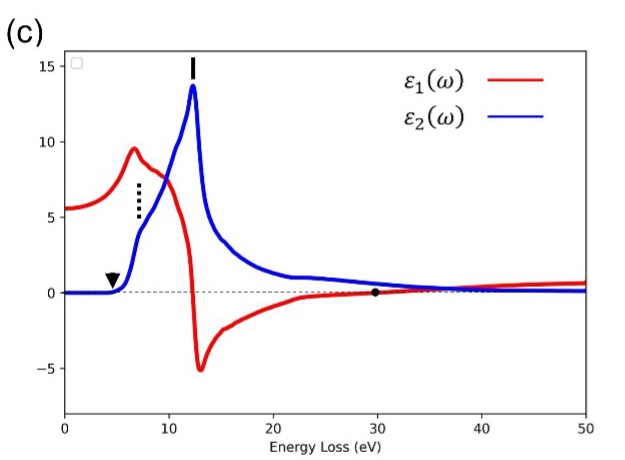
Fig. 1 (a) Experimental EELS spectrum of diamond (black line) and the single scattering distribution (SSD) (red line).
SSD is the spectrum obtained by removing both the multiple plasmon scattering intensity (arrow ①) and the zero-loss peak intensity (arrow ②).
(b) The solid line represents the loss function Im[-1/ ε (ω)] which is obtained by normalizing the SSD.
A dotted line represents Re[1/ ε (ω)] derived by using equation (1). (c) The real part ε1(ω) (red line) and the imaginary part ε2(ω) (blue line) of the obtained dielectric function using equations (2) and (3) described in Appendix 2.
Comparison with a spectrum obtained by an optical measurement
From the obtained dielectric function  , the complex refractive index
  (refractive index n(ω) and extinction coefficient k(ω)), reflectance R(ω) and optical absorption coefficient μ(ω) can be calculated. Those values can be compared with the values obtained by optical measurements (optical properties refer to Appendix 2).
Fig. 2 (a) shows the reflection spectrum calculated from the dielectric function derived from the EELS spectrum. The spectral structures at 7 eV, 13 eV and 21 eV of this reflection spectrum are in good agreement with the structures obtained by an optical measurement (Fig. 2(b)) [4]. This demonstrates that the optical properties can be derived correctly from the EELS spectrum.
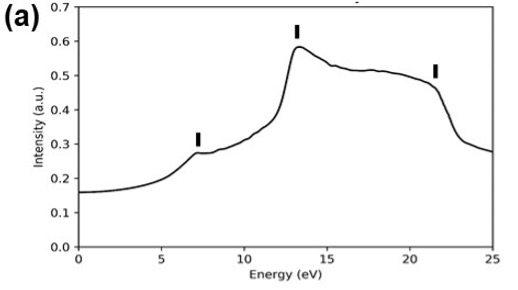
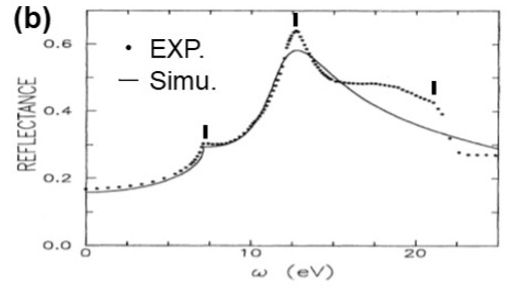
Fig. 2 (a) Reflection spectrum calculated by using the dielectric function derived from an EELS spectrum.
(b) The dotted line shows a reflection spectrum obtained from an optical measurement [4].
The solid line shows a reflection spectrum calculated with a band structure assumed. The reflection spectrum derived from EELS (Fig.(a)) is in good agreement with that of the optical measurement (Fig.(b)).
(By Associate Professor Yohei Sato, Tohoku University)
References:
- [1] F. Wooten, "Optical properties of solids", Academic press INC. (1972).
- [2] M. Watanabe, S. Satoh, "Introduction to Synchrotron Radiation science", Tohoku University Press (in Japanese).
- [3] R. F. Egerton, Electron Energy-Loss Spectroscopy in the Electron Microscope
- [4] A. D. Papadopoulos, Phys. Rev. B, 43, 5090 (1991).
https://doi.org/10.1103/PhysRevB.43.5090
Appendix 1: Normalization of SSD
An example of normalization of ISSD(ω) to use the Sum-rule method is presented.
When the density of valence electrons N of a material is known, ISSD(ω) is normalized by using the following equation.
Here, A is the normalization constant, ωp is the angular frequency of the plasmon, e is the charge of an electron, and m is the mass of the electron. A is determined from the second and third terms of eq. (6). The dielectric function is derived from the equation A・ISSD(ω)=Im[-1/ ε(ω)].
Appendix 2: Relations between the dielectric function and optical properties
The relations between the dielectric function ε (ω)=ε1(ω)+iε2(ω) and the optical properties are shown as follows.
Related Term(s)
Term(s) with "Kramers-Kronig analysis" in the description
Are you a medical professional or personnel engaged in medical care?
No
Please be reminded that these pages are not intended to provide the general public with information about the products.