


Predicting NMR Spectra from Molecular Structure – Application of Topological Descriptors and QSPR Models
NM250009
This document introduces the application of QSPR (Quantitative Structure–Property Relationship) models for forward analysis, which predicts NMR spectra from molecular structures.
By leveraging JEOL’s NMR data analysis software JASON[1] and its Python®[2] interface BeautifulJASON[3], the workflow enables seamless execution from descriptor extraction to spectral prediction.
The goal is to achieve high prediction accuracy and model interpretability, even in small-data environments, by quantifying electronic and structural features of molecules.
Key objectives:
Develop high-accuracy NMR spectral prediction models under limited data conditions
Design interpretable models through descriptor contribution analysis and visualize structural trends using clustering
This approach aims to enhance efficiency and reliability in molecular design through the integration of automated NMR analysis and Materials Informatics (MI).
For reverse analysis (predicting molecular structure from NMR spectra), please refer to Application Note NM250008E: “Molecular Structure Estimation from NMR Spectra: Practical Reverse Analysis Using QSPR Models.”
Challenges in NMR Spectral Quantification and Role of QSPR Models
NMR spectra provide highly valuable structural information but are strongly influenced by measurement conditions (e.g., solvent, concentration, temperature), making peak positions and integration values variable and challenging for quantitative feature extraction.
Traditional quantum chemical calculations offer high accuracy but are computationally intensive, limiting real-time applicability.
In contrast, QSPR models based on electronic and topological descriptors enable lightweight, fast predictions and facilitate multi-spectrum comparison and structure-based screening.
Forward Analysis
Forward analysis—predicting NMR spectra from molecular structure—is a key approach for quantitatively capturing structure–spectrum relationships.
This study focuses on ppm prediction using QSPR models by converting electronic and topological features into numerical descriptors.
Analysis Approach
Figure 1 illustrates the forward analysis workflow, which combines electronic, structural, and topological descriptors with nonlinear regression models for ppm prediction and clustering for structural trend visualization:
Design and selection of local descriptors (e.g., electron density, hybrid orbitals, graph centrality)
Nonlinear regression models (e.g., Gradient Boosting) for ppm prediction
Clustering (UMAP + HDBSCAN) for visualizing structural space and analyzing error trend
These methods enable quantitative understanding of how molecular features influence NMR spectra and deepen insights into structure–spectrum relationships.
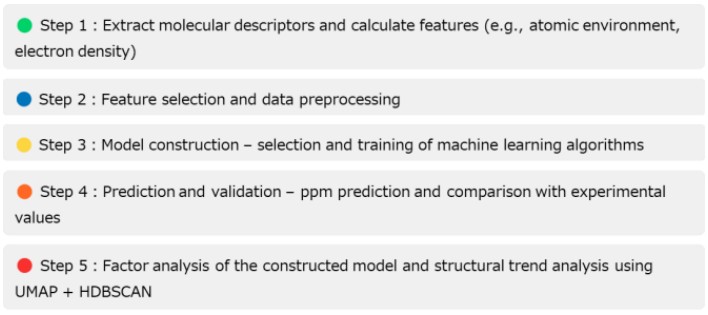
Figure 1. Example Workflow for Forward Analysis
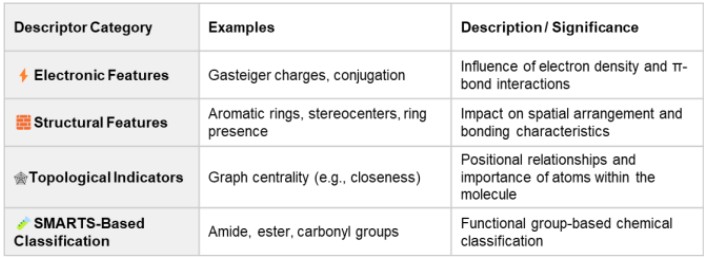
Table 1. Selected Descriptors Used in This Study
Lists key descriptors related to physical and chemical factors influencing ppm shifts.
Molecular List Used for Model Training
As shown in Table 2, multiple molecules with diverse characteristics—such as aromaticity, functional group variety, and stereochemical features—were selected to build the ppm prediction model.
These molecules were chosen to evaluate the generalization performance of the model.
Structural descriptors were extracted from SMILES representations and used as input for machine learning algorithms.
Figure 2 illustrates the structures of the selected molecules.
Table 2. Molecules Used for Model Training
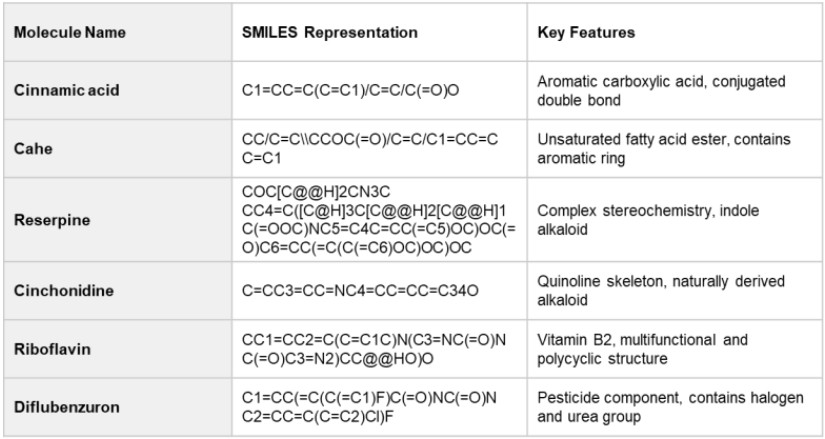
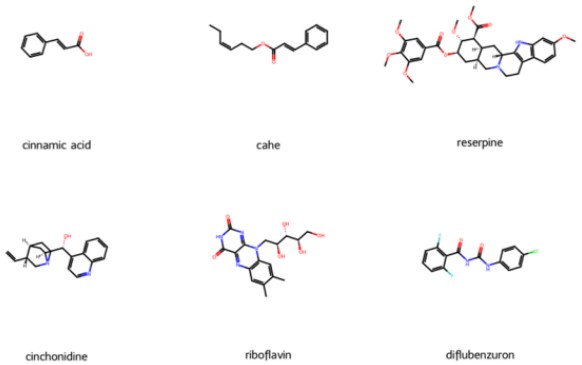
Figure 2. Structures of Molecules Used for Training
Comparison of Regression Models
To improve ppm prediction accuracy, several regression algorithms were compared, as summarized in Table 3. Evaluation metrics included RMSE (Root Mean Squared Error) and R² (Coefficient of Determination). Among the tested models, Gradient Boosting achieved the lowest error and highest R², confirming its superior accuracy and robustness for ppm prediction.
Table 3. Comparison of Regression Models for ppm Prediction
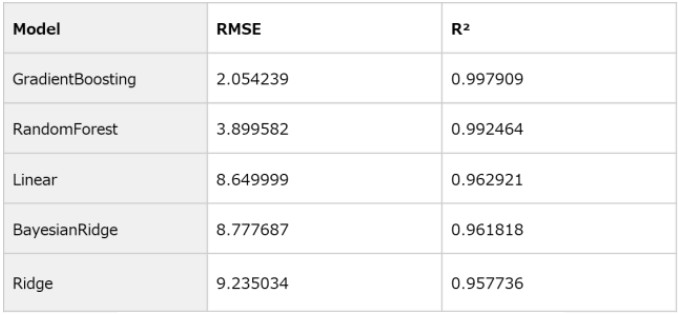
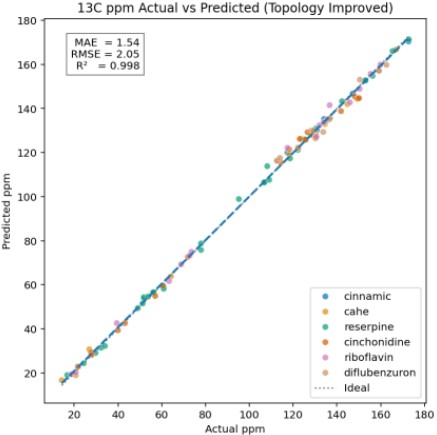
Figure 3. Predicted vs. Experimental ¹³C ppm Values Using Gradient Boosting
Table 4. Error Statistics by Molecule
Model Construction and Evaluation
Gradient Boosting: An ensemble learning method that builds weak learners sequentially to improve prediction accuracy. In this study, it provided stable predictions and favorable error distribution.
Bayesian Ridge Regression: A linear regression approach with Bayesian regularization to prevent overfitting. However, it showed insufficient performance for nonlinear relationships in this dataset.
Prediction Results
Figure 3 shows a scatter plot comparing predicted ppm values with experimental measurements for the Gradient Boosting model.
Data points are color-coded by molecule, and both the ideal line (x = y) and regression line are displayed for visual assessment.
Performance metrics (MAE, RMSE, R²) are shown in the upper-left corner:
MAE: Average absolute error, indicating overall deviation.
RMSE: Root mean squared error, emphasizing large deviations.
R²: Degree to which predictions explain observed values (closer to 1 indicates better fit).
The model achieved RMSE = 2.054 and R² = 0.998, demonstrating high accuracy and stability even under small-data conditions.
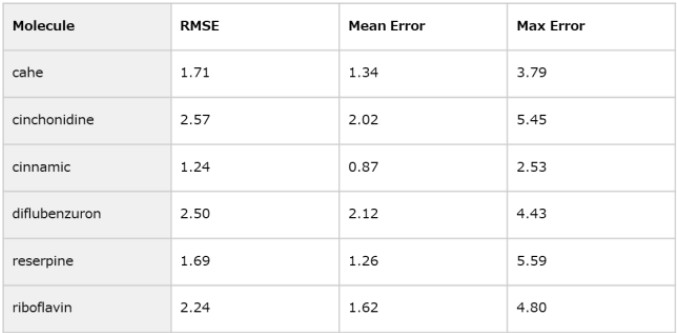
Error statistics for each molecule are summarized in Table 4.
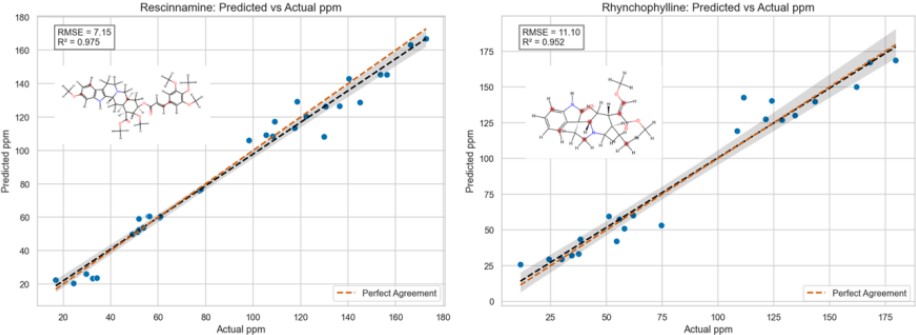
Figure 4. Prediction of ¹³C ppm Values for Unknown Molecules: Rescinnamine and Rhynchophylline
Prediction Performance for Unknown Molecules
Figure 4 shows the predicted ¹³C ppm values for two unknown molecules—Rescinnamine and Rhynchophylline—using the constructed model.
Despite being trained on a small dataset, the model achieved accurate predictions for both molecules, demonstrating its generalization capability and potential for practical applications.
Further improvements are expected through expansion of training data and optimization of descriptor design.
Feature Importance Analysis
Figure 5 illustrates the quantitative evaluation of feature importance in the ppm prediction model.
Feature importance measures how much each descriptor contributes to improving prediction accuracy, based on impurity reduction (e.g., mean squared error) during tree-based model splits.
The results indicate that both structural features (e.g., local atomic environment, hybridization) and electronic features (e.g., partial charges, conjugation) are critical for accurate ppm prediction.
For example, the descriptor num_neighbors, representing the number of adjacent atoms, was identified as a major contributing factor, highlighting the strong influence of local structure on ppm values.
Impact of Adding Topological Descriptors
Figure 6 visualizes error reduction when topological descriptors were added, using a Violin plot and an error reduction map for Cinchonidine.
Topological descriptors quantify connectivity and positional relationships within a molecular graph, complementing structural and electronic features.
The map shows regions with significant error improvement (darker blue indicates greater improvement), confirming that complex molecules benefit most from topological information.
Figure 7 compares prediction error distributions before and after adding topological descriptors using a KDE plot:
RMSE decreased from 3.26 to 2.05 (≈37% reduction)
R² improved from 0.995 to 0.998, indicating enhanced explanatory power
These results demonstrate that topological descriptors play a complementary role in improving model performance and capturing structural constraints.
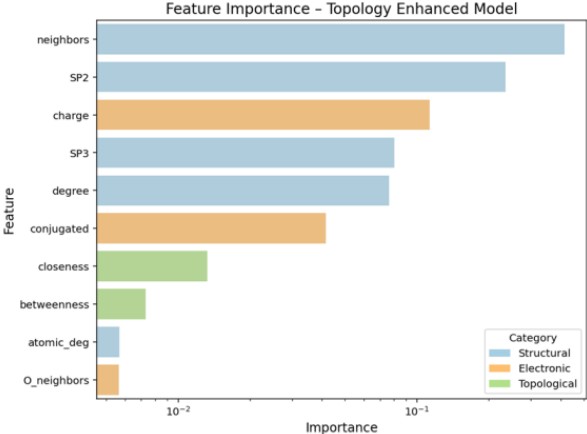
Figure 5. Feature Importance in ppm Prediction Model
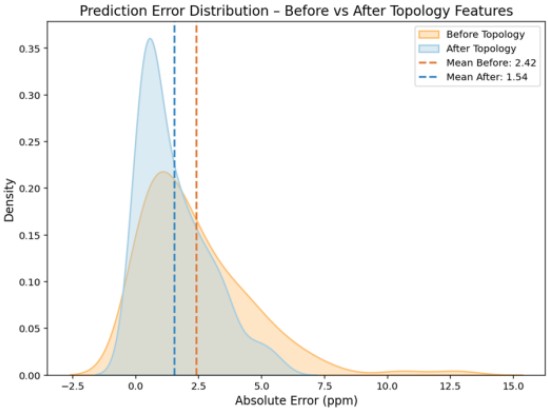
Figure 7. KDE Plot of Prediction Error Distribution Before and After Adding Topological Descriptors
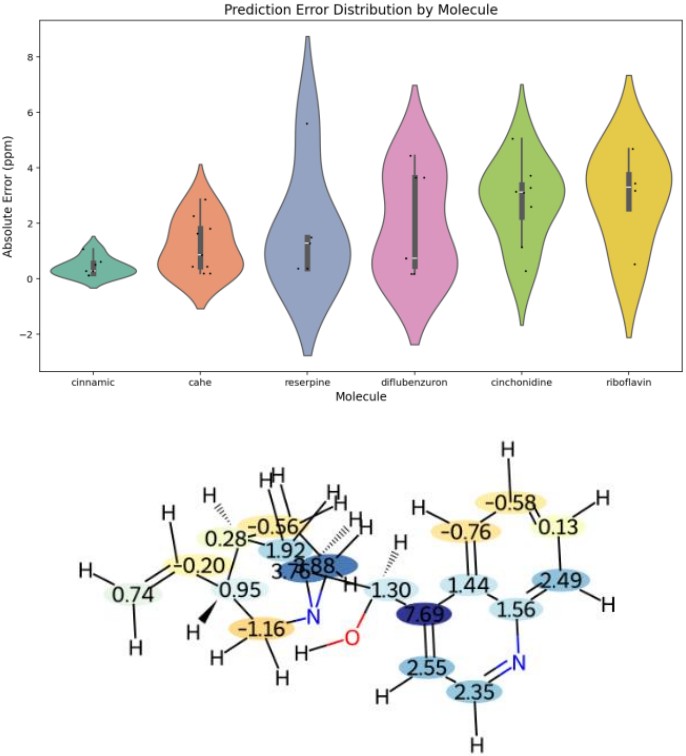
Figure 6. Effect of Adding Topological Descriptors: Violin Plot and Error Reduction Map (Cinchonidine)
Cluster Analysis and Descriptor Correlation
Cluster Analysis Using UMAP + HDBSCAN
Figure 8 shows the distribution of molecular clusters in structural space and the trend of prediction error improvement within each cluster.
To visualize high-dimensional descriptor data effectively, UMAP (Uniform Manifold Approximation and Projection) was applied for dimensionality reduction, preserving nonlinear structural relationships.
Additionally, HDBSCAN (Hierarchical Density-Based Spatial Clustering) was used to extract natural cluster distributions based on density structure.
Analysis revealed that clusters 4, 2, and 3 exhibited higher median error improvement, indicating stable enhancement trends.
Cluster 2, with the largest number of data points, appears to represent a central structural region contributing significantly to model improvement.
These findings suggest that specific regions in structural space play a key role in improving prediction performance, providing valuable guidance for future descriptor design and data selection.
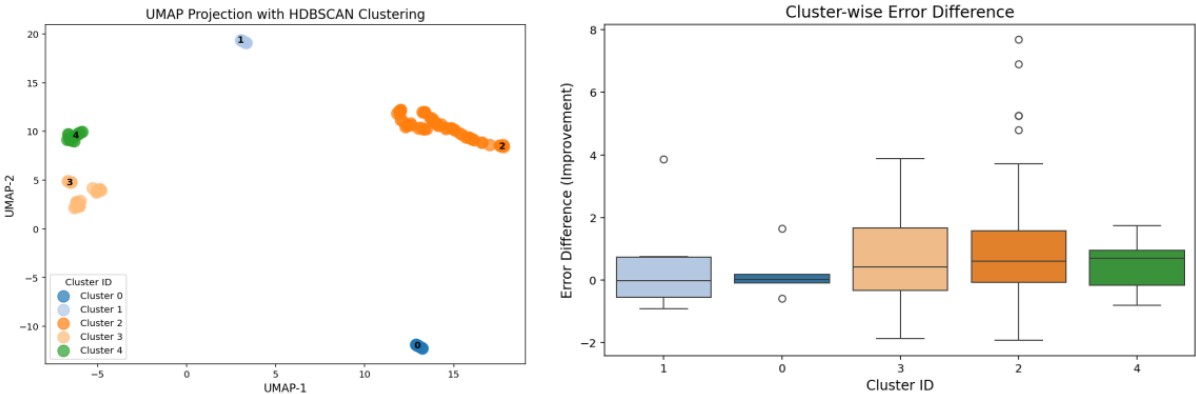
Figure 8. Cluster Distribution in Structural Space and Error Improvement Trends (UMAP + HDBSCAN)
Relationship Between Descriptors and Error Improvement
Understanding the meaning of features in structural space requires correlation analysis between descriptor trends and error improvement across clusters.
Spearman correlation analysis was applied to quantify relationships between descriptors and error reduction, identifying descriptors with high sensitivity in the model.
Figure 9 shows that descriptors such as is_aromatic and is_in_ring strongly correlate with error improvement, indicating that aromaticity and ring structures are critical factors for enhancing prediction accuracy.
Figure 10 plots the average values of these descriptors for each cluster, revealing that Cluster 2 contains molecules with high aromaticity and polar atoms, contributing to stable improvement trends.
This analysis highlights the importance of incorporating aromatic and ring-related descriptors in future model optimization.
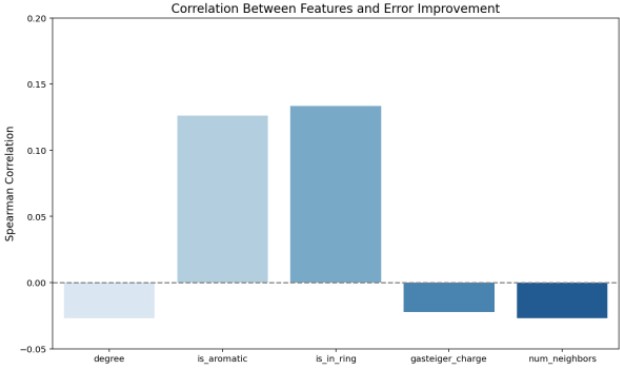
Figure 9. Spearman Correlation Analysis of Descriptors Related to Error Improvement
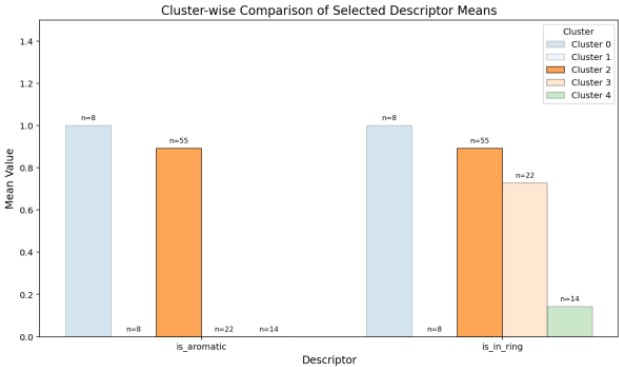
Figure 10. Cluster-Level Averages of Aromaticity and Ring Structure Descriptors
Spatial Spread of Improved Atoms and Their Relationship to Structural Space
To investigate factors contributing to model improvement, the spatial distribution of improved atoms was analyzed using Spread Score.
Spread Score quantifies the extent of structural improvement by counting neighboring atoms within a defined radius around an improved carbon atom and applying distance-based weighting.
This metric provides insight into whether improvements are localized or spread across a broader structural environment.
Spread Score Distribution Across Clusters
Figure 11 shows Violin plots of Spread Score for each cluster, visualizing distribution trends.
Clusters 2 and 3 exhibit high Spread Scores, indicating improvements across a wide structural range.
Clusters 0 and 1 show low Spread Scores, suggesting localized improvements, while Cluster 4 displays a unique distribution with high Spread Scores in specific structural environments.
Heteroatom Distribution Around Improved Atoms
To evaluate structural diversity, the distribution of heteroatoms (N, O, F, Cl) around improved atoms was analyzed.
Figure 12 reveals that Cluster 2 has a broad heteroatom distribution, indicating high structural diversity.
Clusters 0 and 1 show limited heteroatom presence, while Cluster 4 exhibits distinctive oxygen-related features.
Subgraph Extraction for Structural Features
Table 5 lists subgraphs extracted for improved atoms in Clusters 2 and 4, confirming structural characteristics suggested by Figure 12.
Integration of Carbon and Heteroatom Descriptors
Figure 13 visualizes structural space classification using carbon and heteroatom descriptors with UMAP and HDBSCAN.
Figure 14 overlays cluster IDs and Spread Scores, showing that Cluster 2 aggregates structures with high Spread Scores and aromatic/polar diversity.
Figure 15 presents statistical validation, confirming Cluster 2 as a key contributor to model improvement.
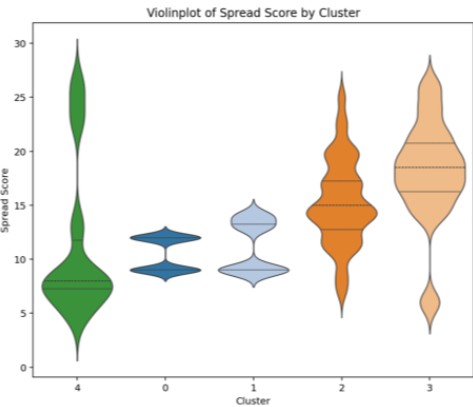
Figure 11. Spread Score Distribution Across Clusters (Violin Plot)
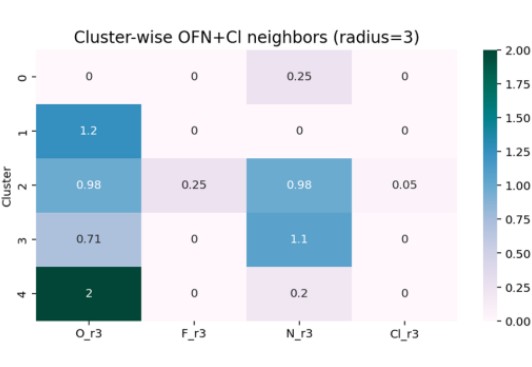
Figure 12. Distribution of Heteroatoms Around Improved Atoms
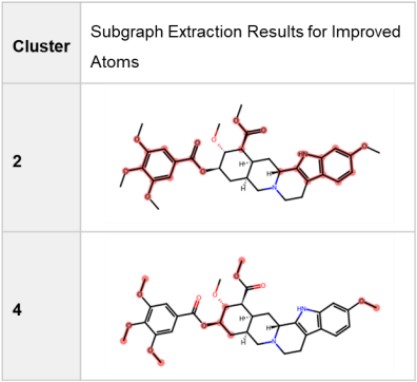
Table 5. Extracted Subgraphs for Improved Atoms in Clusters 2 and 4
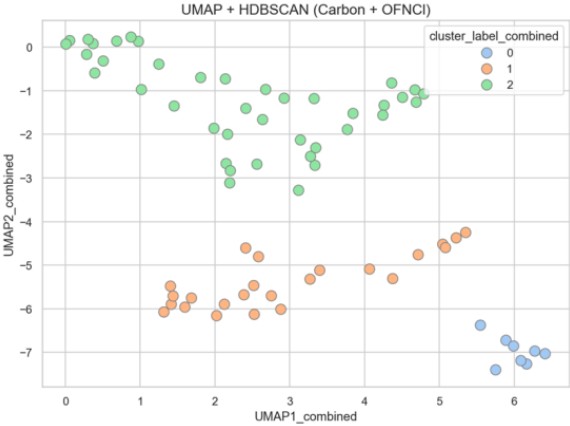
Figure 13. Structural Space Classification Based on Carbon and Heteroatom Descriptors
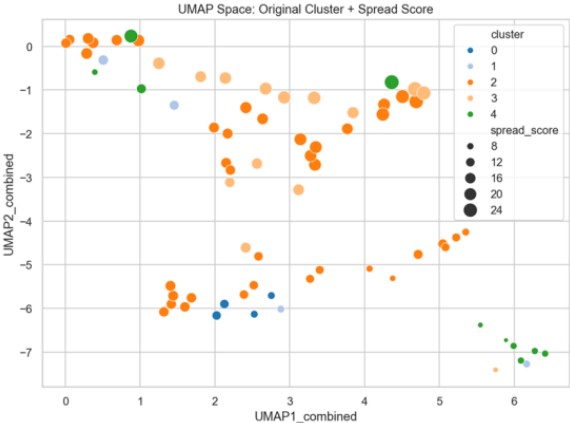
Figure 14. Overlay of Cluster IDs and Spread Score Trends
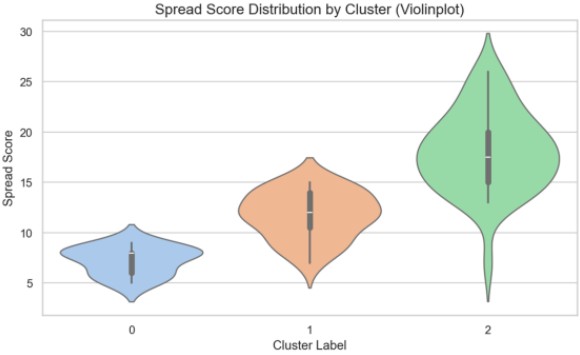
Figure 15. Spread Score Distribution and Statistical Summary
Conclusion
This study demonstrated that high-precision molecular evaluation is achievable even in low-data environments by leveraging molecular descriptors for ppm prediction based on NMR spectra. Using machine learning models—particularly Gradient Boosting—we achieved stable predictions that capture non-linear relationships, and confirmed generalizability to previously unseen molecules.
Feature importance analysis revealed that descriptors related to aromaticity and ring structures significantly contributed to error reduction. Molecules belonging to clusters 2 and 3 were identified as central regions for model improvement.
Spatial analysis using quantitative indicators of the local environment around improved carbon atoms confirmed that broader surrounding environments contribute to enhanced prediction accuracy. Furthermore, by integrating UMAP and HDBSCAN for structural space classification and incorporating descriptors involving heteroatoms (O, F, N, Cl), we visualized improvement trends that conventional classifications could not capture.
These results indicate that the designed descriptors—especially those representing electronic and structural diversity of aromatic and polar atoms—contribute to model enhancement when combined with topological features.
Summary
This approach provides a powerful method for advancing NMR spectrum utilization by quantitatively evaluating physicochemical properties of molecules through descriptors and extracting structural trends to guide molecular design. It is highly compatible with existing materials informatics tools and holds promise for applications in experimental design and molecular screening.
The spectrum prediction model developed in this study is expected to support structural annotation, screening of unknown compounds, and inverse design. Moreover, integrated analysis with other spectroscopic techniques such as MS and XRF will enable more comprehensive structural understanding.
Future directions include integration with molecular generation AI and enhancement of model interpretability, contributing to materials design support and standardization. Additionally, combining this approach with cloud-based analysis tools will enable a more robust cycle of experimentation, analysis, and design.
Environment and Libraries
This study was conducted in a Python 3.13 environment, integrating molecular structure analysis, machine learning, statistical analysis, and visualization.
The main libraries used were:
RDKit: Chemical structure manipulation, descriptor calculation, and visualization
pandas / NumPy [5][6]: Data processing and numerical computation
NetworkX [7]: Molecular graph structure analysis
scikit-learn [8]: Machine learning model development and evaluation (including linear regression, ensemble learning, SVM, Gaussian process regression)
scikit-learn modules: PCA, feature standardization, label encoding
By combining these libraries, we implemented descriptor design, model construction, and structural space visualization.
References
[1] JEOL Analytical Software Network
JASON official site
[2] Python is a trademark or registered trademark of the Python Software Foundation. Official documentation
[3] BeautifulJASON: Python interface library for JASON and its file format. Documentation
[4] RDKit: Open-source cheminformatics toolkit
Version 2025.03.6. Available at
[5] pandas
[6] numpy
[7] networkx
[8] scikit-learn
Solutions by field
Related products




Are you a medical professional or personnel engaged in medical care?
No
Please be reminded that these pages are not intended to provide the general public with information about the products.