Molecular Structure Estimation from NMR Spectra: Practical Reverse Analysis Using QSPR Models
NM250008
This document introduces the application of QSPR (Quantitative Structure–Property Relationship) models as a reverse analysis approach for estimating molecular structures and properties from NMR spectra.
By leveraging JEOL’s NMR data analysis software JASON[1] and its Python®[2] interface BeautifulJASON[3], the workflow enables seamless execution from spectral data processing to descriptor design and structure search.
The goal is to quantify structural features from spectral information and apply them to similarity searches and structural classification, supporting identification of unknown components and screening applications.
Key topics:
Quantitative evaluation of molecular properties based on spectral data
Structure classification through similarity search and clustering
This integration of NMR analysis and Materials Informatics (MI) aims to improve reliability in molecular identification and structure prediction.
About QSPR Models
QSPR (Quantitative Structure–Property Relationship) models are mathematical frameworks that use molecular descriptors—numerical representations of molecular structures—to predict physicochemical properties and functional characteristics.
By modeling the relationship between molecular structure and properties using statistical and machine learning techniques, QSPR enables the prediction of unknown compound behavior and supports efficient molecular design and screening.
QSPR is widely applied across fields such as drug development, materials design, and spectroscopic analysis, complementing traditional experimental methods with data-driven insights.
In particular, combining experimental data such as NMR spectra with molecular descriptors allows for quantitative understanding of structure–spectrum relationships, even in small datasets, enabling high-accuracy predictions.
This document introduces a practical integration of QSPR modeling with NMR spectral analysis, highlighting its potential for molecular design, screening, and interpretable model construction through descriptor contribution analysis.
About Reverse Analysis
Integrating NMR spectral analysis with QSPR models allows for quantitative evaluation of the relationship between molecular structure and spectral characteristics.
This study focuses on reverse analysis—inferring molecular structure from spectral data—by estimating structural features and physicochemical descriptors (e.g., LogP, TPSA, HBD) from NMR peak positions and integration values.
The approach includes similarity-based scoring and clustering analysis to assess consistency between spectral and structural data, supporting applications such as unknown compound identification, spectrum-based screening, and quality control.
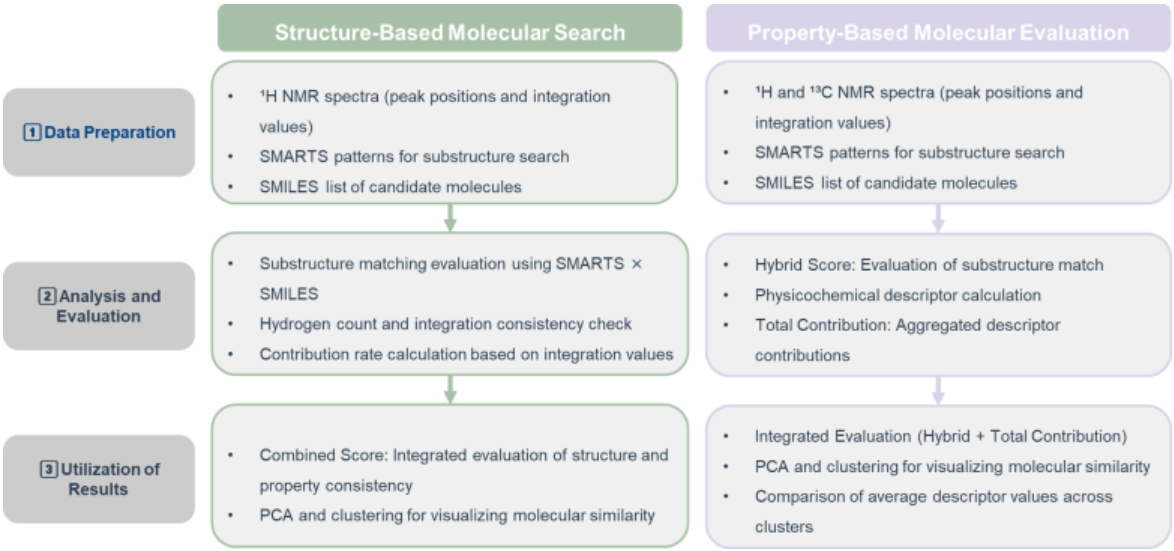
Figure 1. Descriptor-Based Framework for Reverse Analysis
Reverse Analysis Workflow
The reverse analysis workflow, illustrated in Figure 1, combines substructure search with descriptor-based evaluation to quantitatively assess molecular consistency.
Two main perspectives were used in this study:
Structure-Based Molecular Search
Substructure search using SMARTS patterns and evaluation based on hydrogen count and integration consistency.Property-Based Molecular Evaluation
In addition to SMARTS-based structure search, evaluation using physicochemical descriptors and distance metrics such as Euclidean and Mahalanobis distances (which account for covariance in descriptor distributions).
Target Molecule and Candidate List
In this study, Butylparaben was selected as the target molecule.
To evaluate structural similarity, a list of 20 candidate molecules with similar molecular weights was extracted from PubChem[4].
Figure 2 shows the molecular structure and physicochemical descriptors of Butylparaben, calculated using RDKit[5].
Figure 3 displays the molecular structures of the candidate compounds.
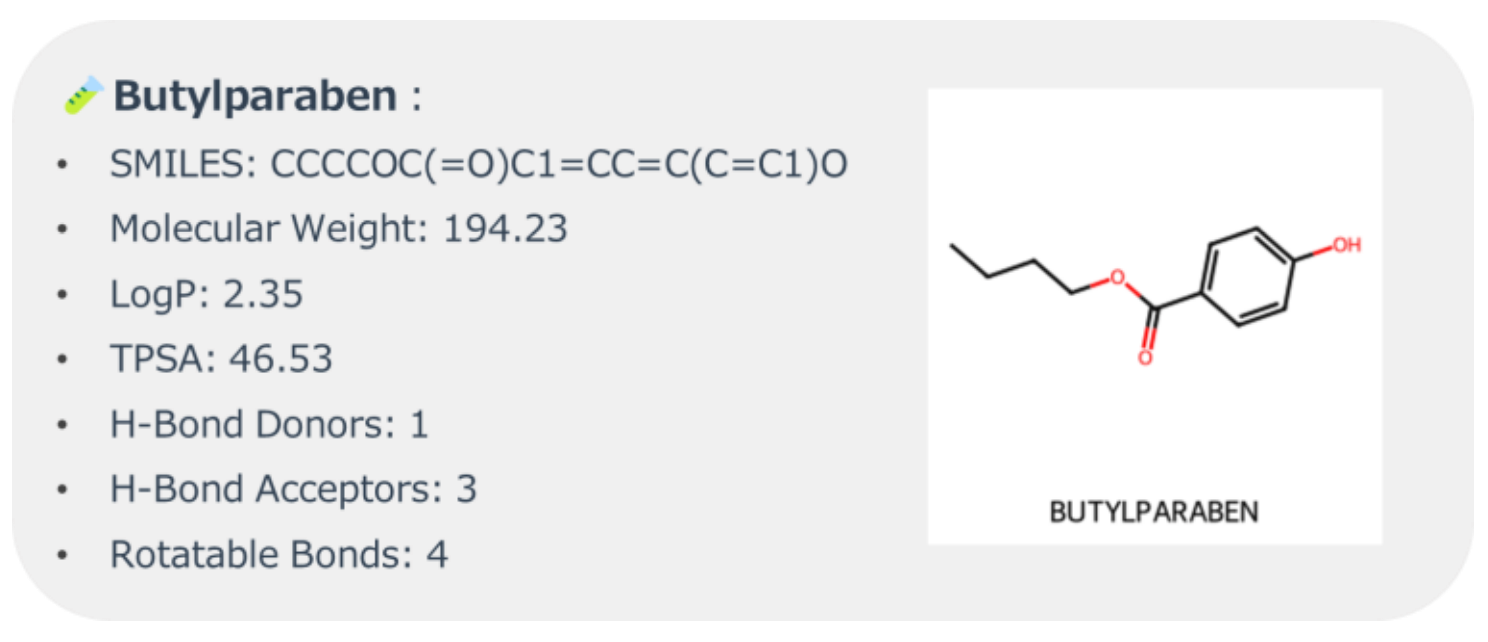
Figure 2. Molecular Structure and Descriptors of Butylparaben
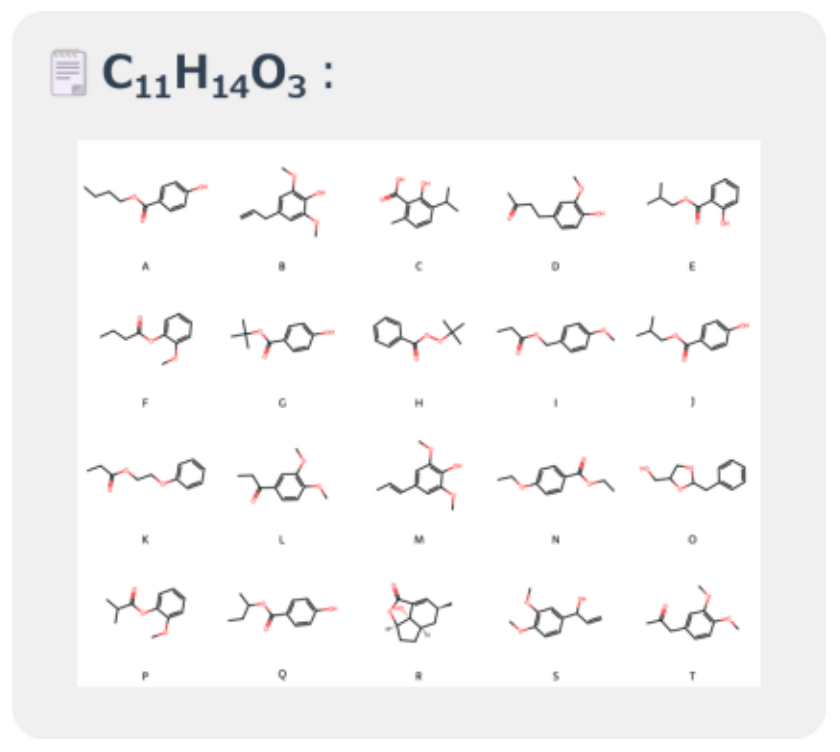
Figure 3. Candidate Molecules with Similar Molecular Weight
Structure-Based Molecular Search
Ranking Based on Combined Score
The evaluation metrics and ranking results based on the Combined Score are summarized in Table1 and Table 2.
Table 1. Evaluation Metrics
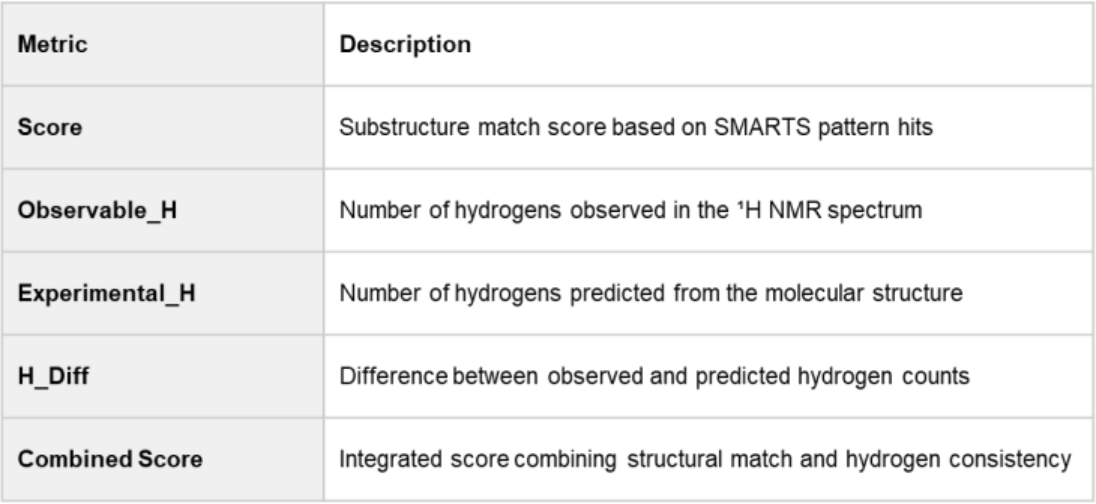
This score integrates two aspects:
Structural Match: Evaluated by comparing the number of matching substructures (SMARTS patterns) between the candidate and the target molecule.
Hydrogen Consistency: Assessed by comparing the number of observable hydrogens in the NMR spectrum with the predicted hydrogen count from RDKit.
Molecules with higher Score and lower H_Diff are considered more consistent with the target spectrum.
The top three ranked molecules are shown in Figure 4.
Similarity Evaluation Using Fingerprints
Structural similarity was quantified using the Tanimoto coefficient, calculated from Morgan fingerprints (radius = 2, 2048 bits) using RDKit.
This metric was used to compare the target molecule with each candidate, supporting the ranking process.
A(Butylparaben)–J(Isobutyl 4-hydroxybenzoate):0.559
A–E(Isobutyl salicylate):0.279
Table 2. Results of Structure-Based Molecular Search
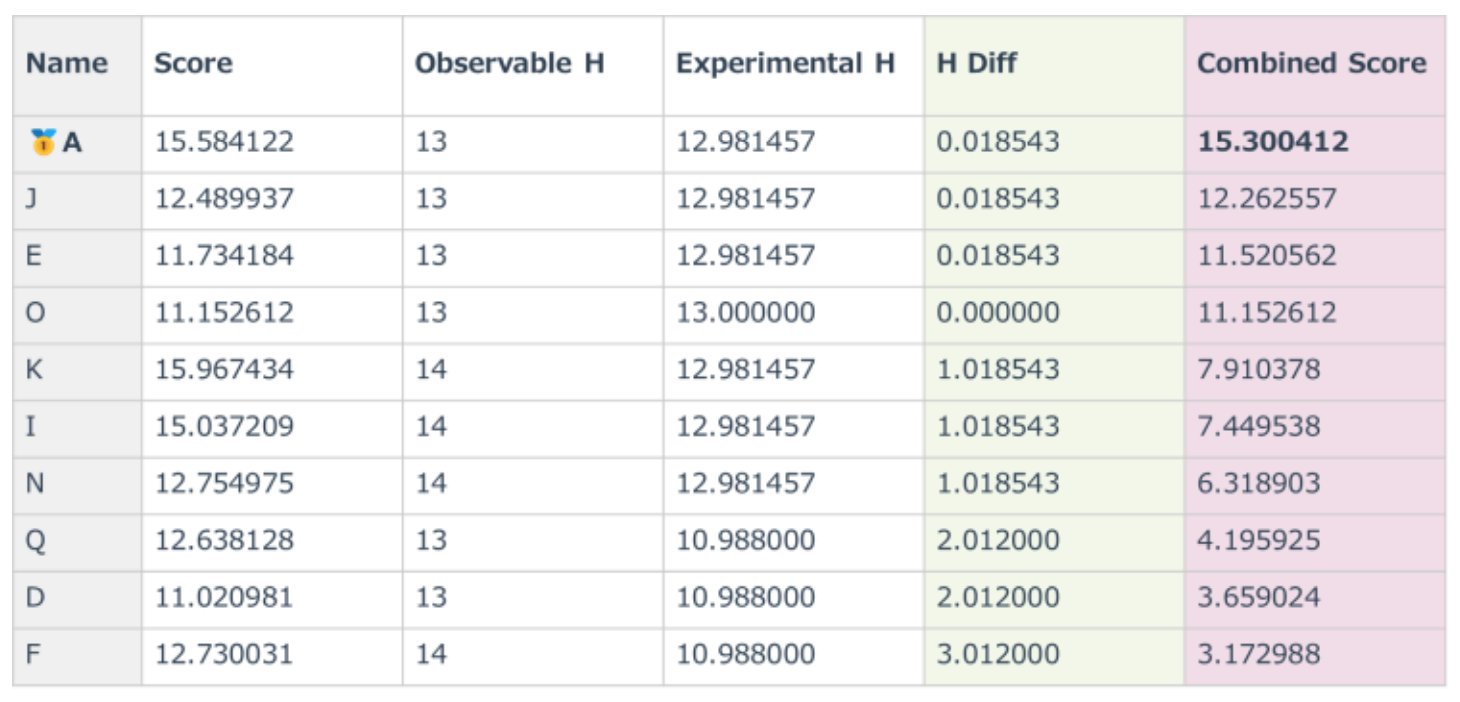
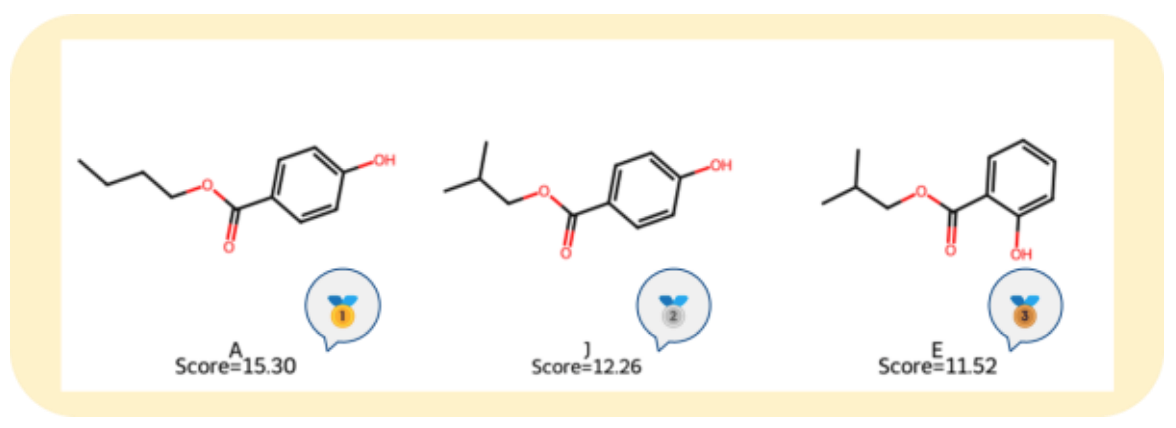
Figure 4. Molecular Structures of the Top Three Candidates
Contribution Distribution Across Molecules
Figure 5 shows a heatmap comparing the contribution distribution of different molecules at each chemical shift.
The metric used here, Normalized Integration, is calculated by dividing the integration intensity of each peak by the number of matched substructures.
This provides a quantitative measure of structural contribution for each peak.
A higher contribution value indicates that a small number of characteristic substructures strongly influence that peak.
In practice, the top-ranked molecules exhibit higher contribution values at specific chemical shifts, suggesting strong consistency with the spectrum and a high likelihood that the matched substructures correspond to those peaks.
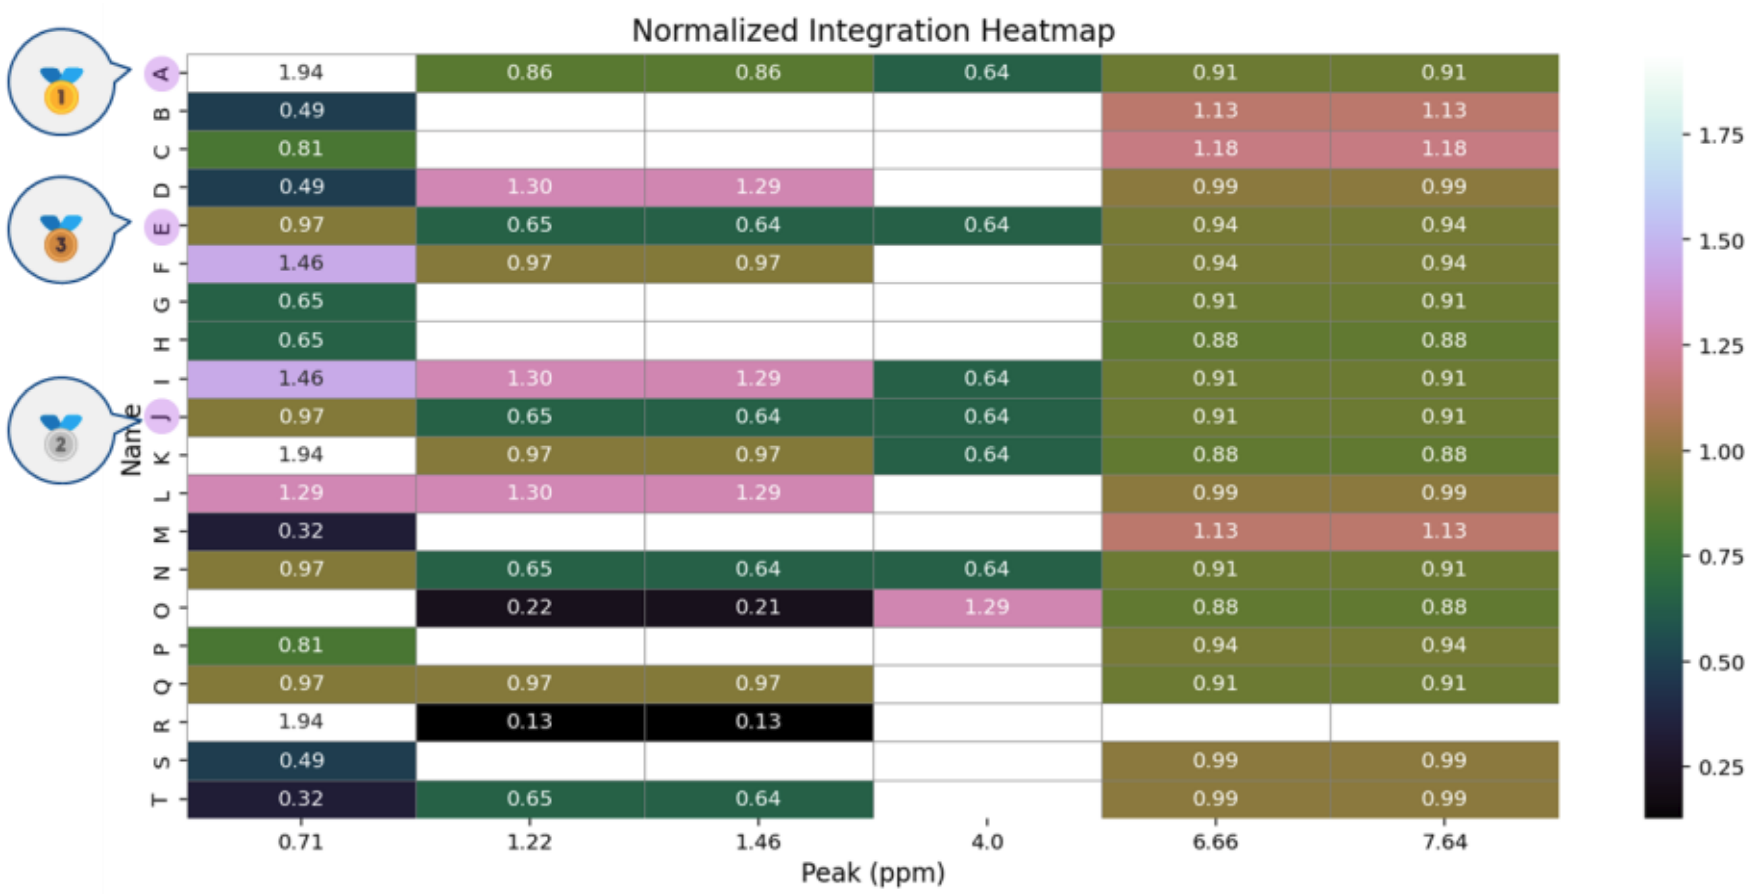
Figure 5. Contribution Distribution of Different Molecules at Each Chemical Shift
Structure Classification by Clustering
Figure 6 visualizes the differences in Match Score (horizontal axis) and Proton Balance Difference (vertical axis), with point size representing the Combined Score.
Molecules located in the lower-right region exhibit high structural consistency and good hydrogen balance.
Based on these results, k-means clustering was applied to group molecules according to structural and spectral consistency (Figure 7).
The optimal number of clusters was determined using the Elbow method, which identifies the point where the error reduction curve shows a distinct bend.
Cluster 0: Located in the lower-right region, showing the best balance (average Score: 13.07, average H_Diff: 1.20). This cluster includes molecules A, J, and E, which maintain high scores (Figure 8).
Cluster 1: Positioned in the upper-left region, with lower consistency (average Score: 7.58, average H_Diff: 5.79).
Hierarchical clustering was also performed to validate the grouping (Figure 9).
Both k-means and hierarchical methods produced similar cluster structures, confirming the reliability of the data (Figure 10).
Combining clustering results with Principal Component Analysis (PCA) provides deeper insight into the distribution trends and characteristics of high-performing molecules.
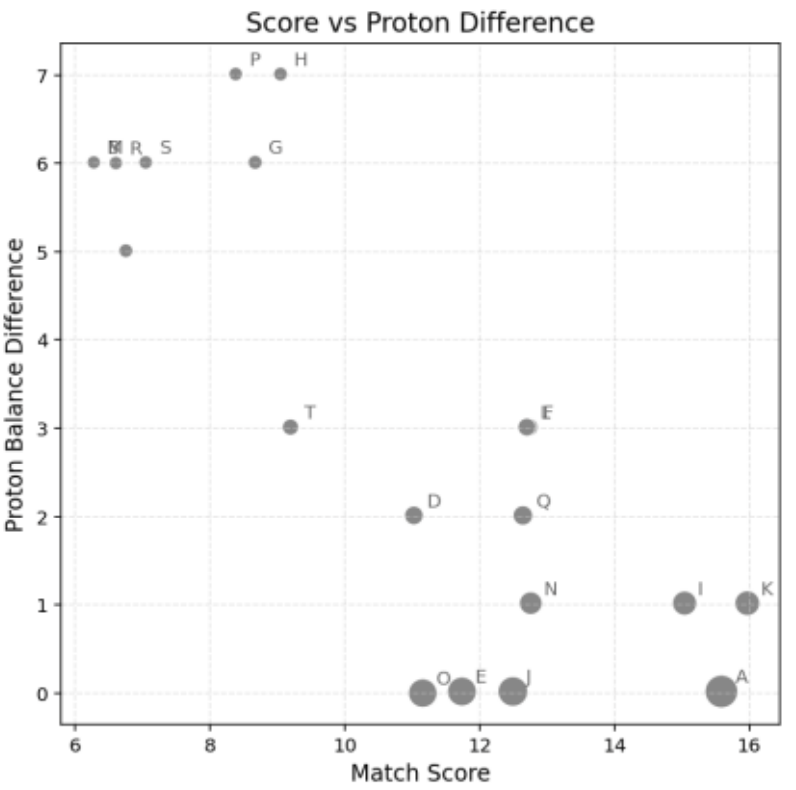
Figure 6. Visualization of Molecular Scores and Hydrogen Balance
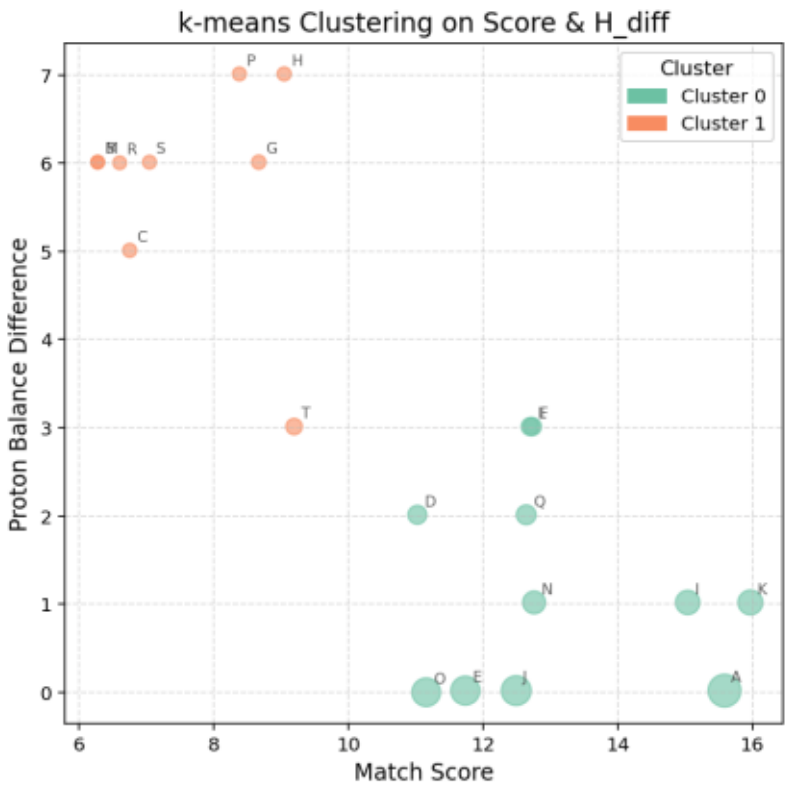
Figure 7. Cluster Segmentation Based on k-means
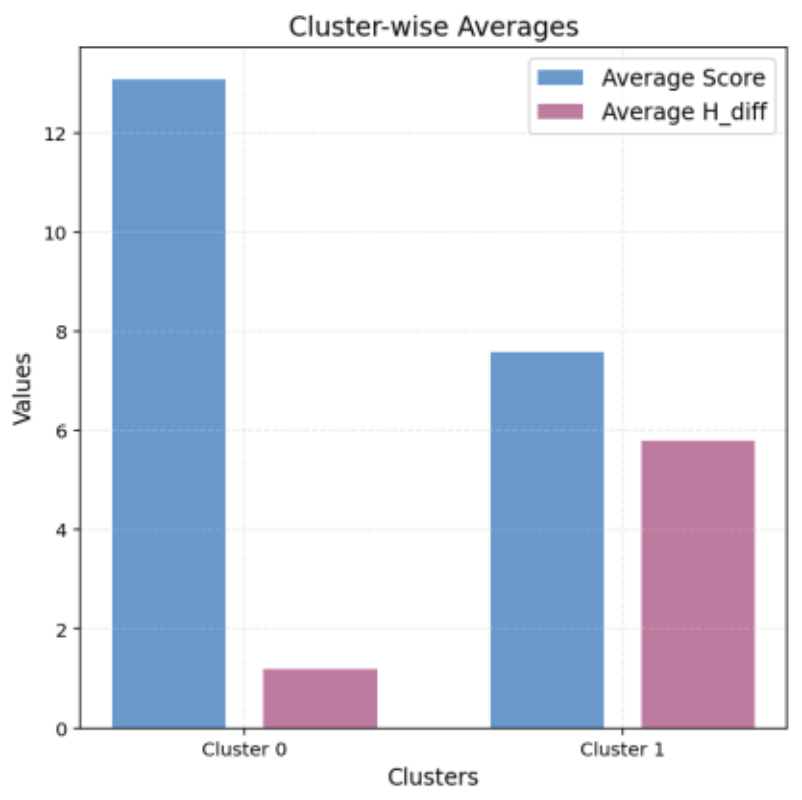
Figure 8. Average Values for Each k-means Cluster
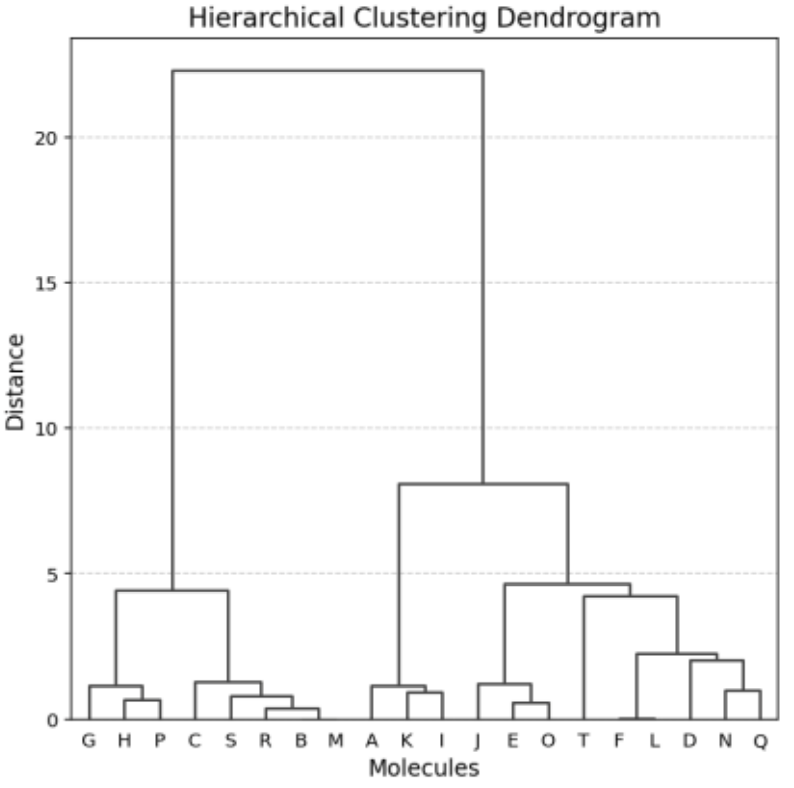
Figure 9. Hierarchical Clustering Results
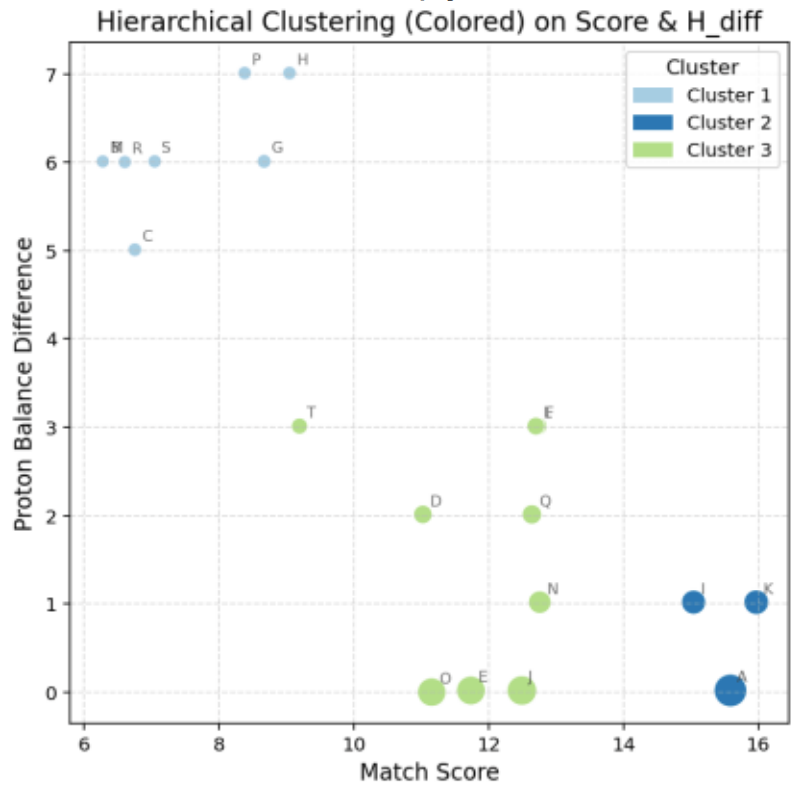
Figure 10. Cluster Segmentation Based on Hierarchical Clustering
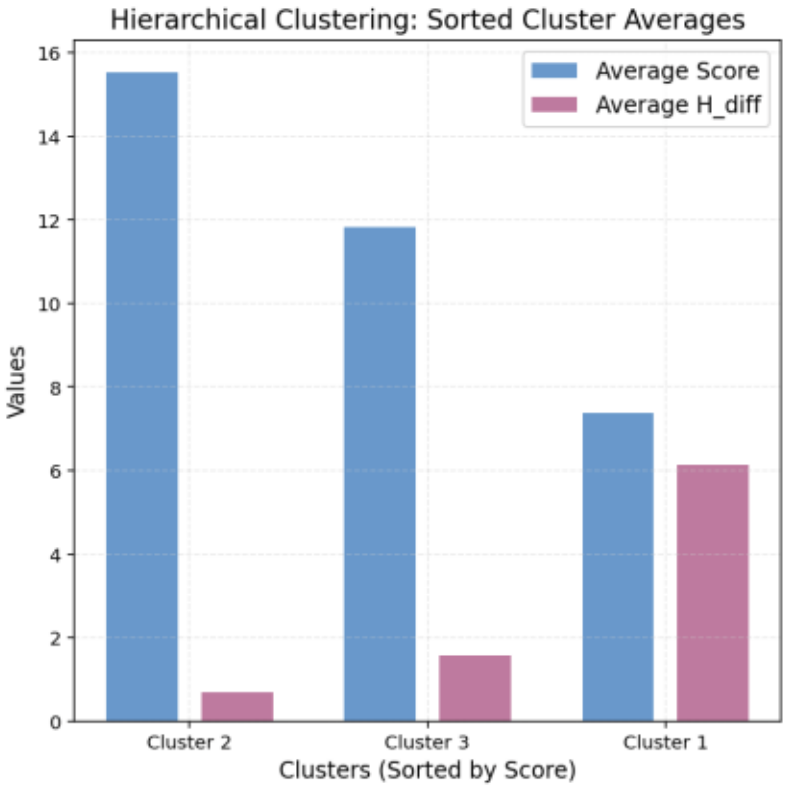
Figure 11. Average Values for Hierarchical Clusters
Property-Based Molecular Evaluation
Ranking of Molecules Using Hybrid Score and Total Contribution
In addition to structure-based molecular search, this study evaluated consistency with NMR spectra using physicochemical descriptors.
The main descriptors used were:
LogP (Logarithm of Partition Coefficient): Indicates lipophilicity, defined as the log of the octanol-water partition coefficient.
TPSA (Topological Polar Surface Area): Sum of polar surface areas of functional groups, related to absorption and permeability.
HBD (Hydrogen Bond Donors): Number of functional groups capable of donating hydrogen bonds (e.g., OH, NH).
HBA (Hydrogen Bond Acceptors): Number of functional groups capable of accepting hydrogen bonds (e.g., O, N).
RB (Rotatable Bonds): Number of freely rotatable single bonds, reflecting molecular flexibility.
These descriptors allow clear evaluation of contribution and importance, providing guidelines for molecular design, such as setting numerical targets for property optimization.
Hybrid Score evaluates structural consistency based on SMARTS pattern matching, while Total Contribution aggregates weighted errors of physicochemical descriptors.
Molecules with low Hybrid Score and low Total Contribution show the best overall consistency.
Property-Based Molecular Search
Figure 12 illustrates the results of property-based evaluation:
Left: Scatter plot of Hybrid Score vs. Total Contribution (lower values indicate better consistency).
Right: Heatmap showing descriptor contribution trends, highlighting molecule A as optimal.
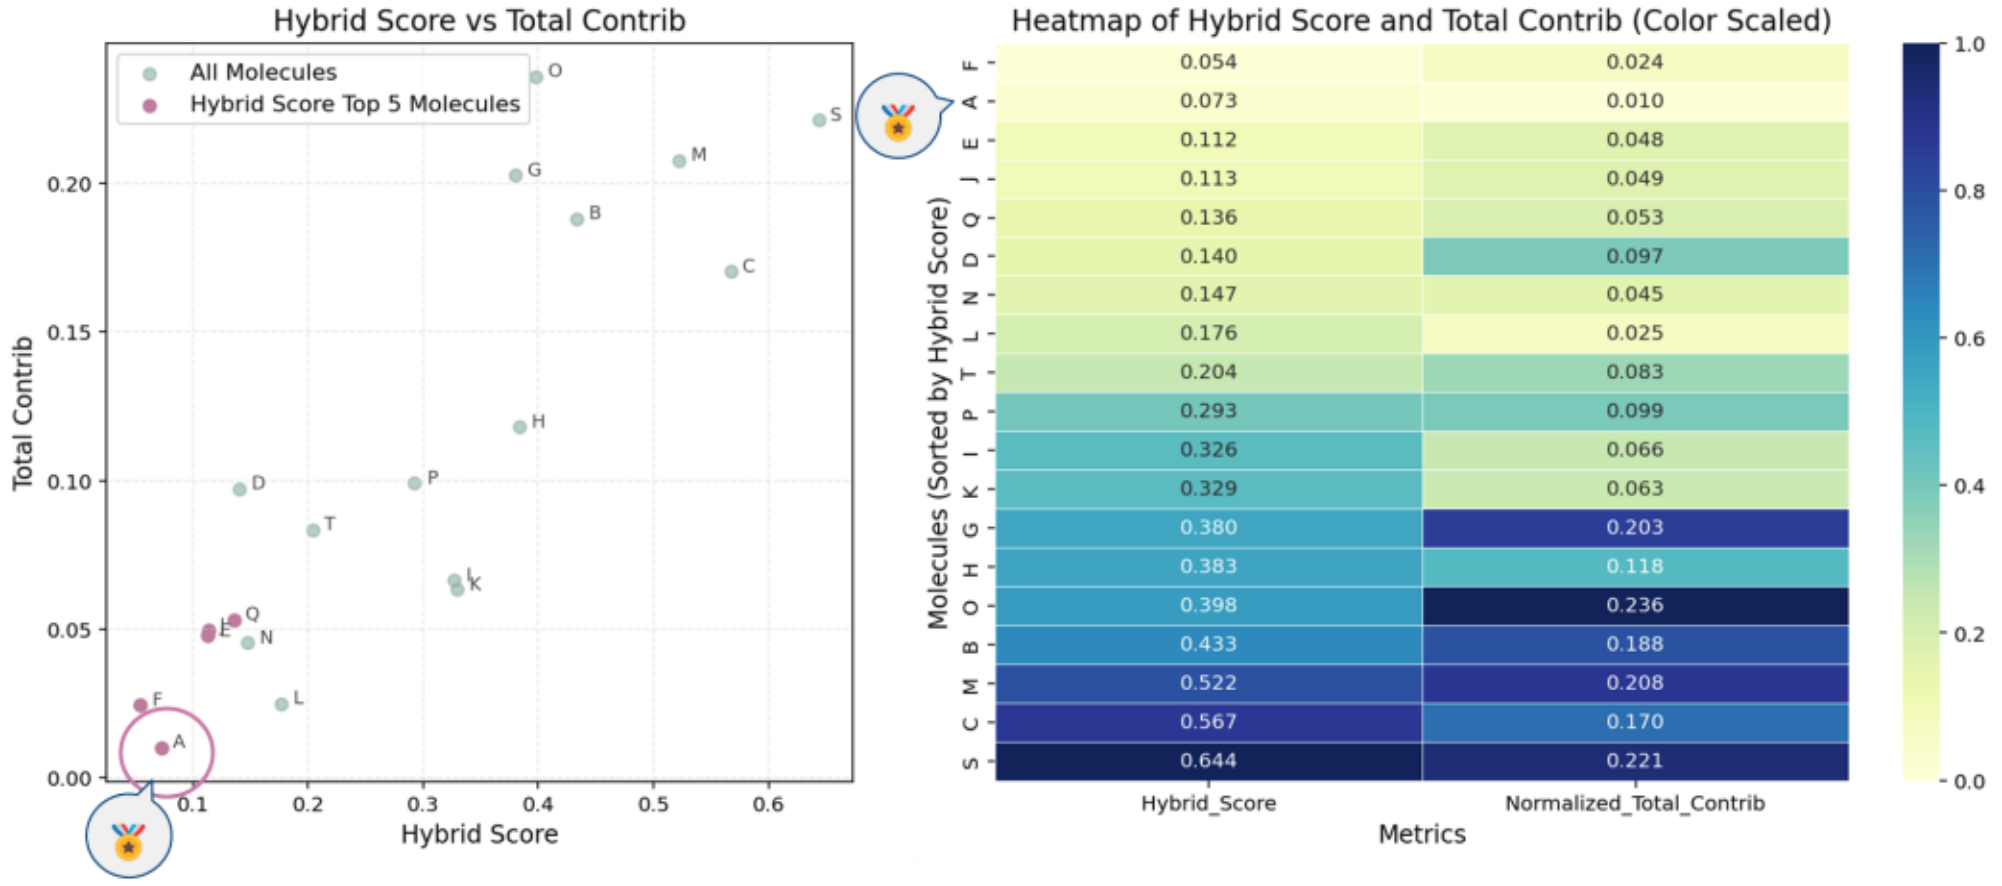
Figure 12. Property-Based Molecular Search Results
(Left: Scatter plot of Hybrid Score vs. Total Contribution; Right: Heatmap)
Principal Component Analysis (PCA) and Clustering
PCA was applied to extract principal components from descriptors and analyze molecular similarity:
PC1 (65.5%) and PC2 (17.6%) explain 83.1% of total variance.
Molecules A and F appear in the upper-right region, indicating significant characteristics, while molecules B and M in the lower-left show distinct properties.
Biplot Analysis (Figure 14):
Positive directions of PC1 and PC2 indicate flexibility and lipophilicity.
The lower-right region corresponds to polarity and water solubility.
The upper-left region is characterized by hydrogen-donating ability and the presence of specific functional groups.
Negative regions represent molecules lacking these properties or showing opposite trends.
Combining PCA with clustering (Figure 15) provides deeper insight into molecular grouping and property trends.
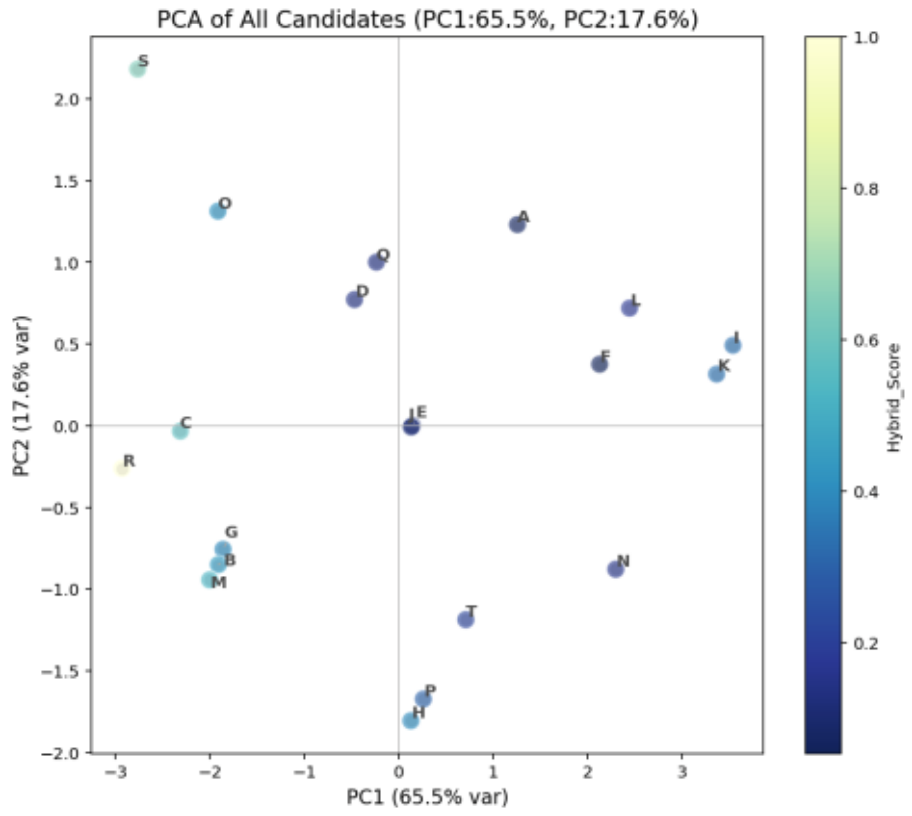
Figure 13. PCA Results
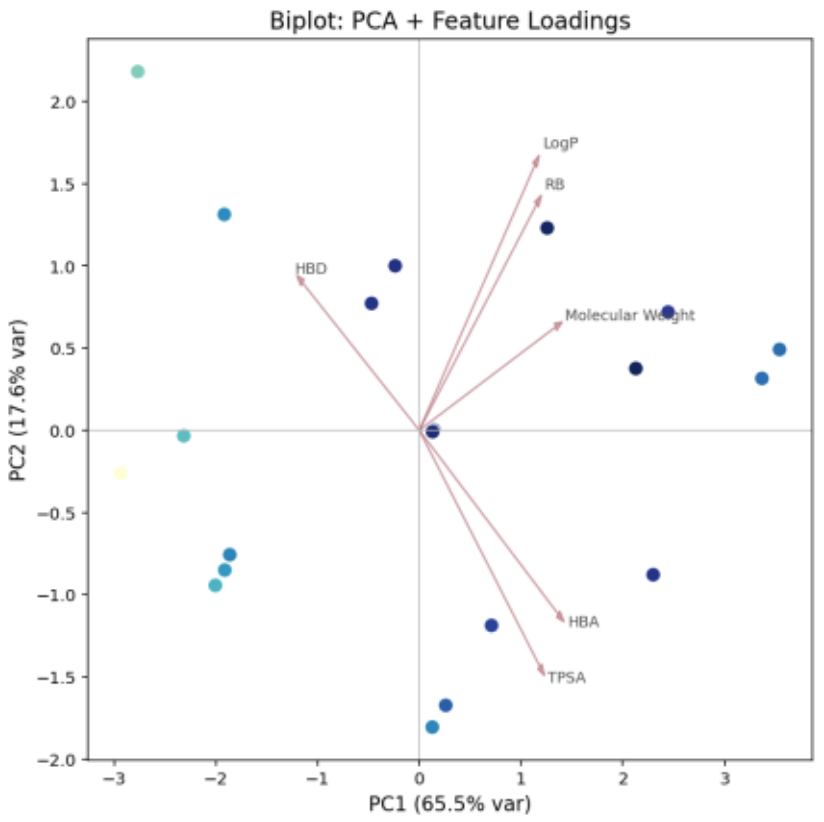
Figure 14. PCA Biplot
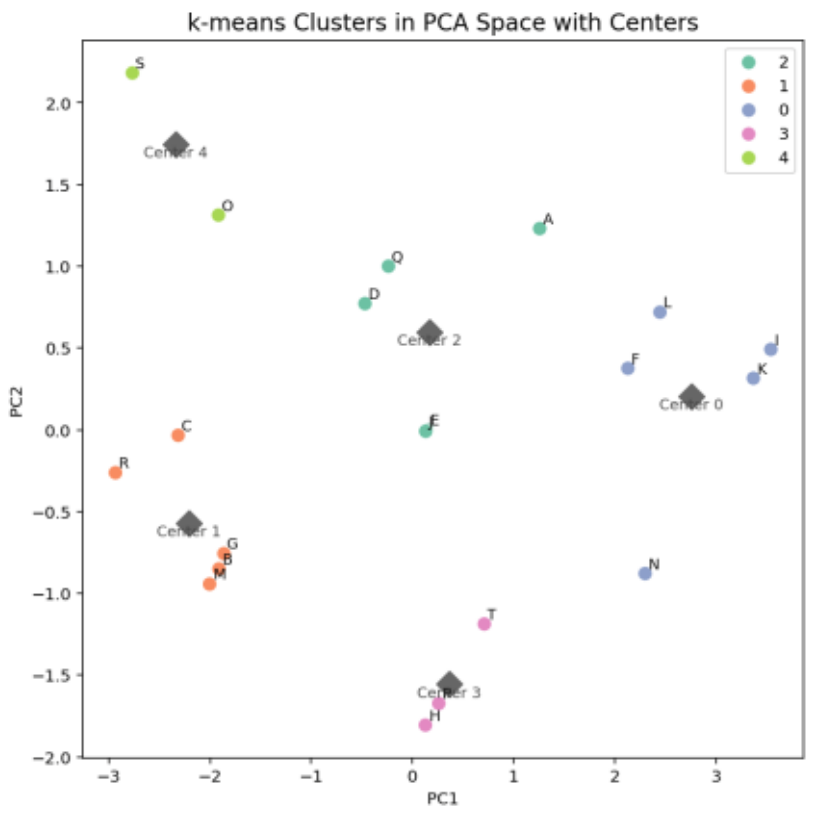
Figure 15. k-means Clustering Results
Further clustering was performed using the k-means method to group molecules based on their characteristics (Figure 15).
Clusters 2 and 0 (upper-right region) include molecules A and F, while Cluster 1 (lower-left region) contains molecules B and M.
Figure 16 compares the correlation results among PC1, PC2, and Hybrid Score:
Hybrid Score shows a negative correlation with PC1 (-0.654) and almost no correlation with PC2 (-0.066).
This suggests that the overall evaluation strongly depends on the characteristics represented by PC1.
Interpretation of PCA Axes:
PC1: Positively correlated with LogP, HBA, TPSA, and RB; negatively correlated with HBD.
→ Represents hydrophobicity and structural complexity.
PC2: Positively correlated with RB and HBD; negatively correlated with TPSA and HBA.
→ Represents molecular flexibility and hydrogen-donating ability.
Examples of Molecular Characteristics
Molecule A: High hydrophobicity and flexibility; located in the positive region of both PC1 and PC2.
→ Likely to exhibit high lipophilicity and good membrane permeability.
Molecule M: High polarity and hydrogen-donating ability; located in the negative region of both PC1 and PC2.
→ Expected to have strong interactions with water and high hydrophilicity.
Validation of Clustering Results
Figure 17 compares the physicochemical descriptor trends of the target molecule (A) with the average values of Cluster 2.
The descriptors of molecule A align closely with the cluster average, confirming the validity of the clustering approach.
These results indicate that setting target property values and reflecting them in molecular design is feasible.
Additionally, leveraging cluster-specific trends can improve search efficiency by excluding clusters that deviate from desired property profiles.
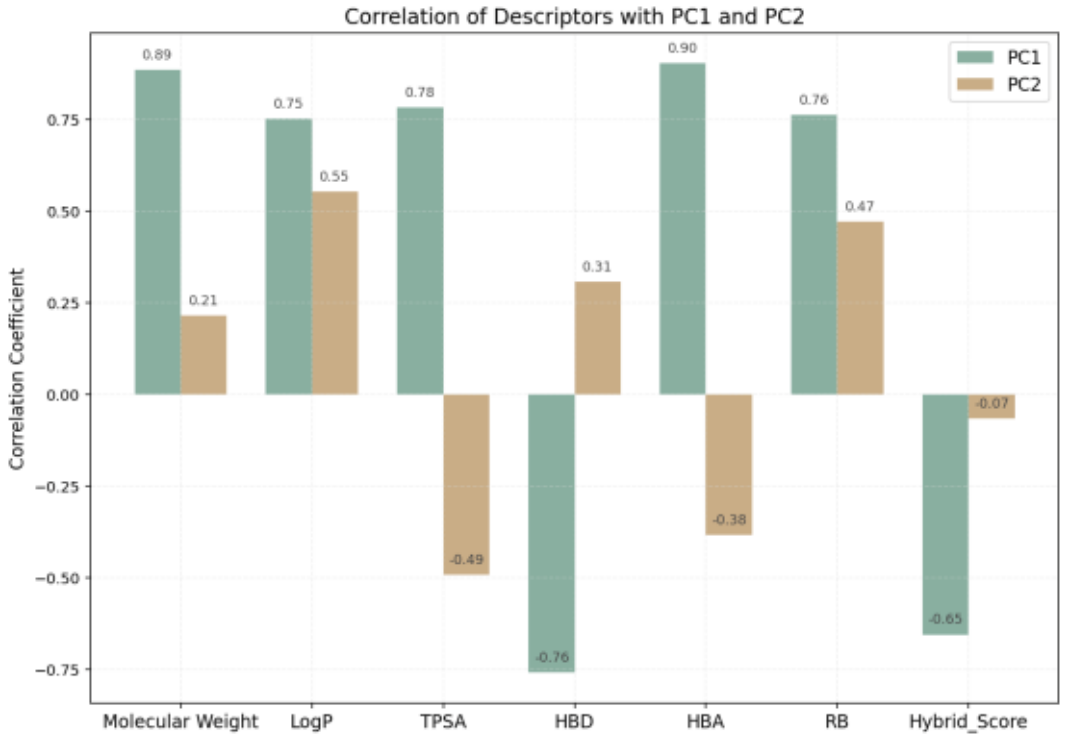
Figure 16. Correlation Analysis of PCA Components and Hybrid Score
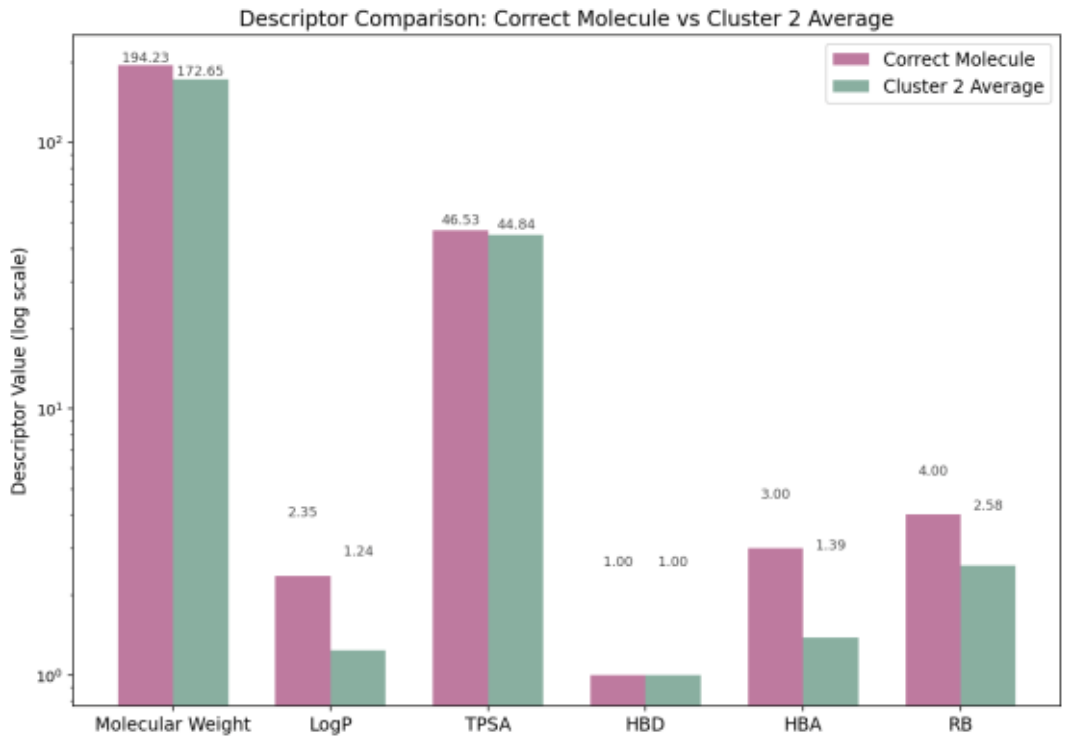
Figure 17. Comparison of Physicochemical Descriptors Between Target Molecule and Cluster 2
Discussion and Future Outlook
This study demonstrated a reverse analysis workflow integrating NMR spectral data with QSPR modeling to quantify relationships between molecular structure and physicochemical properties.
Hybrid Score and Total Contribution provided effective combined evaluation, while PCA and clustering enabled visualization of structural trends and classification.
Future work will focus on expanding descriptors and applying supervised learning to improve prediction accuracy, as well as linking this workflow with molecular design tools for practical applications such as unknown compound identification and screening.
Summary
The proposed approach combines NMR analysis and QSPR modeling to support reliable structure prediction and property estimation.
Integrated evaluation and clustering techniques offer valuable insights for molecular design and screening, laying the foundation for automated NMR analysis and Materials Informatics-driven research.
References
[1] JEOL Analytical Software Network
JASON official site
[2] Python is a trademark or registered trademark of the Python Software Foundation.
Official documentation
[3] BeautifulJASON
A Python interface library for JASON and its file format. Documentation
[4] PubChem Substance and Compound Databases
Kim, S., Thiessen, P.A., Bolton, E.E., et al. Nucleic Acids Research, 44(D1), D1202–D1213 (2016).
DOI: https://doi.org/10.1093/nar/gkv951
[5] RDKit: Open-source cheminformatics toolkit
Version 2025.03.6. Available at: https://www.rdkit.org
Solutions by field
Related products


Are you a medical professional or personnel engaged in medical care?
No
Please be reminded that these pages are not intended to provide the general public with information about the products.