Introduction to Python® Integration Using JASON and BeautifulJASON
NM250006
Currently, JASON[1] provides an efficient environment for NMR spectral analysis using Python[2], leveraging the hierarchical structure of HDF5 files and the functionality of BeautifulJASON.
This document introduces the following two topics:
Overview of BeautifulJASON and an example of NMR spectral analysis using Python
Batch processing example using JASON × BeautifulJASON × Python
1. Overview of BeautifulJASON and Example of NMR Spectral Analysis Using Python
What is BeautifulJASON?
BeautifulJASON is a Python interface library designed to work with JASON and its file format (.jjh5).
It enables direct access and manipulation of spectral data created and stored in JASON from within Python.
This library is suitable for the following use cases:
Automated spectral processing and analysis
Custom layout and report generation
Batch processing and laboratory automation
Integration into data analysis pipelines
BeautifulJASON is particularly useful for users who regularly work with JASON and wish to handle spectral data programmatically.
By invoking JASON functions through Python scripts, users can perform batch processing, statistical analysis, and data visualization beyond the capabilities of GUI-based operations.
Example: Extracting and Analyzing NMR Data Using BeautifulJASON (Single File)
This section presents a simple example of NMR spectral analysis using Python and BeautifulJASON.
The analysis workflow is outlined in Table 1, with each step and the corresponding Python libraries listed.
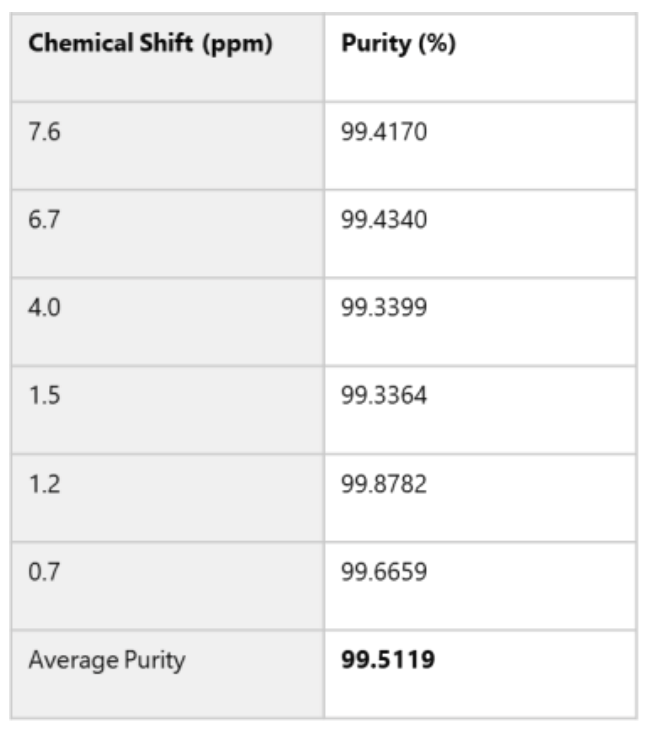
The computed results are shown in Table 2.
This example serves as a practical introduction to BeautifulJASON and can be used as a reference for initial spectral analysis.
Table 1. Workflow Example Using BeautifulJASON (1 file)
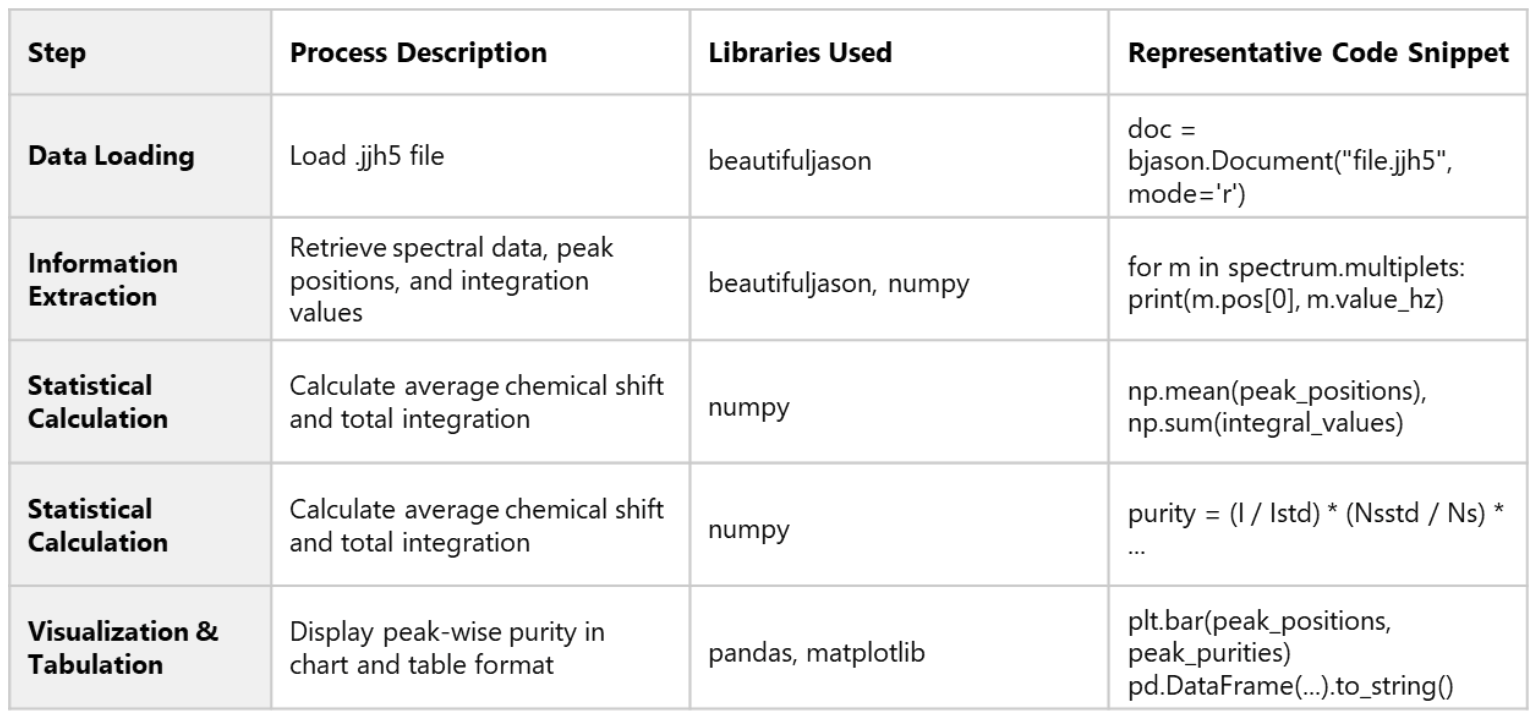
Table 2. Analysis Example
Reading NMR Data and Extracting Information with BeautifulJASON
The code shown in Figure 1 demonstrates how to extract spectral and peak information from .jjh5[3]-formatted NMR measurement data.
This example is useful for understanding the basic usage of BeautifulJASON.
The script retrieves the following information:
Spectrum title and nucleus type
Chemical shift positions and integration values of multiplets[4]
Spectrum structure (e.g., nmr_data, nmr_items)
Such processing is essential for preprocessing and organizing spectral data.
By utilizing BeautifulJASON’s powerful data extraction capabilities, Python-based analysis can be performed smoothly and efficiently.
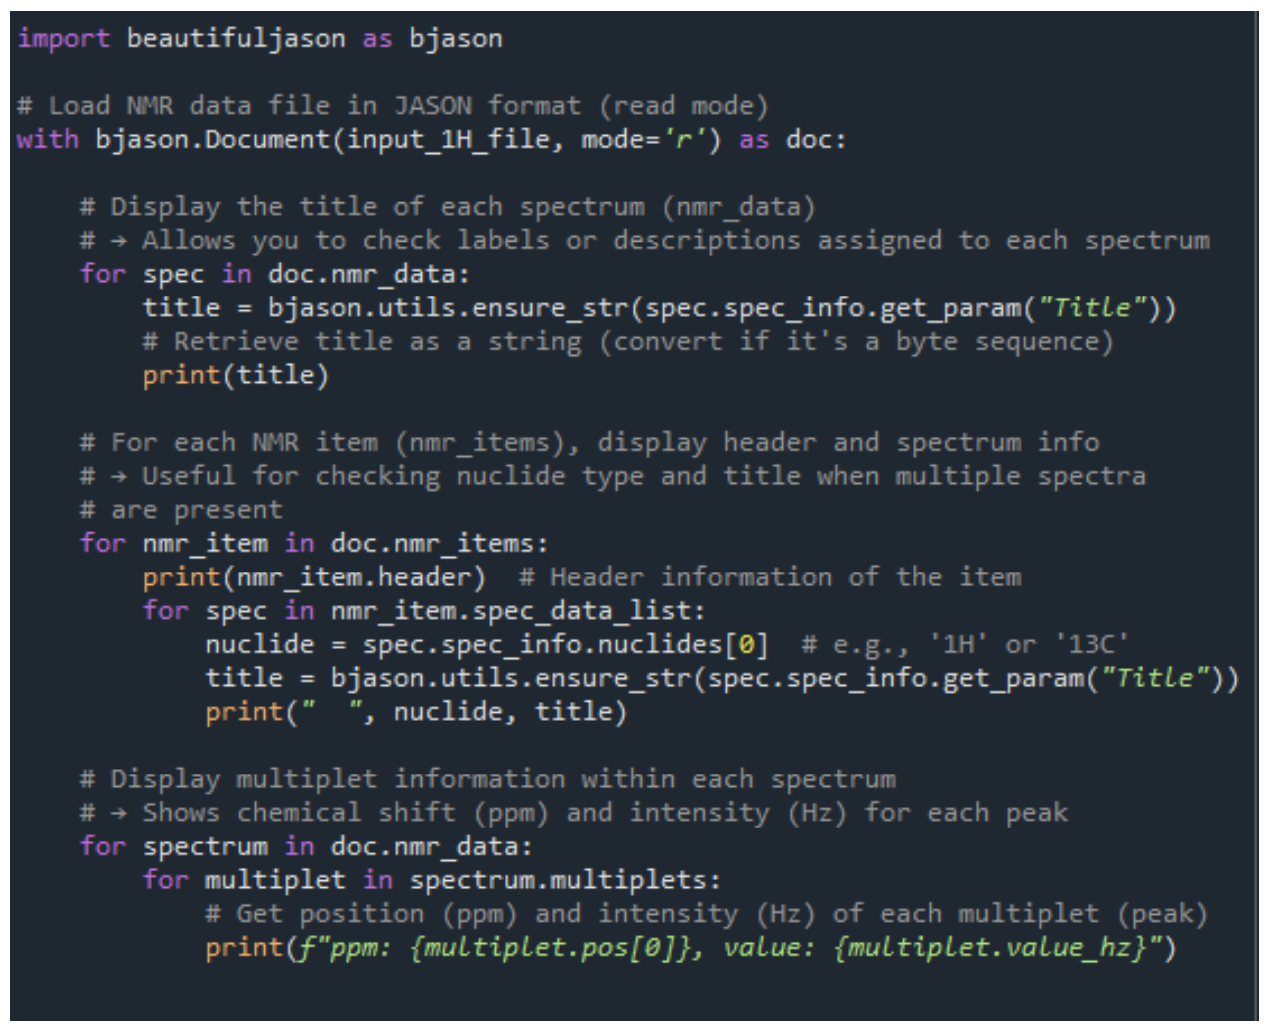
Figure 1. NMR Data Extraction Code Example with BeautifulJASON
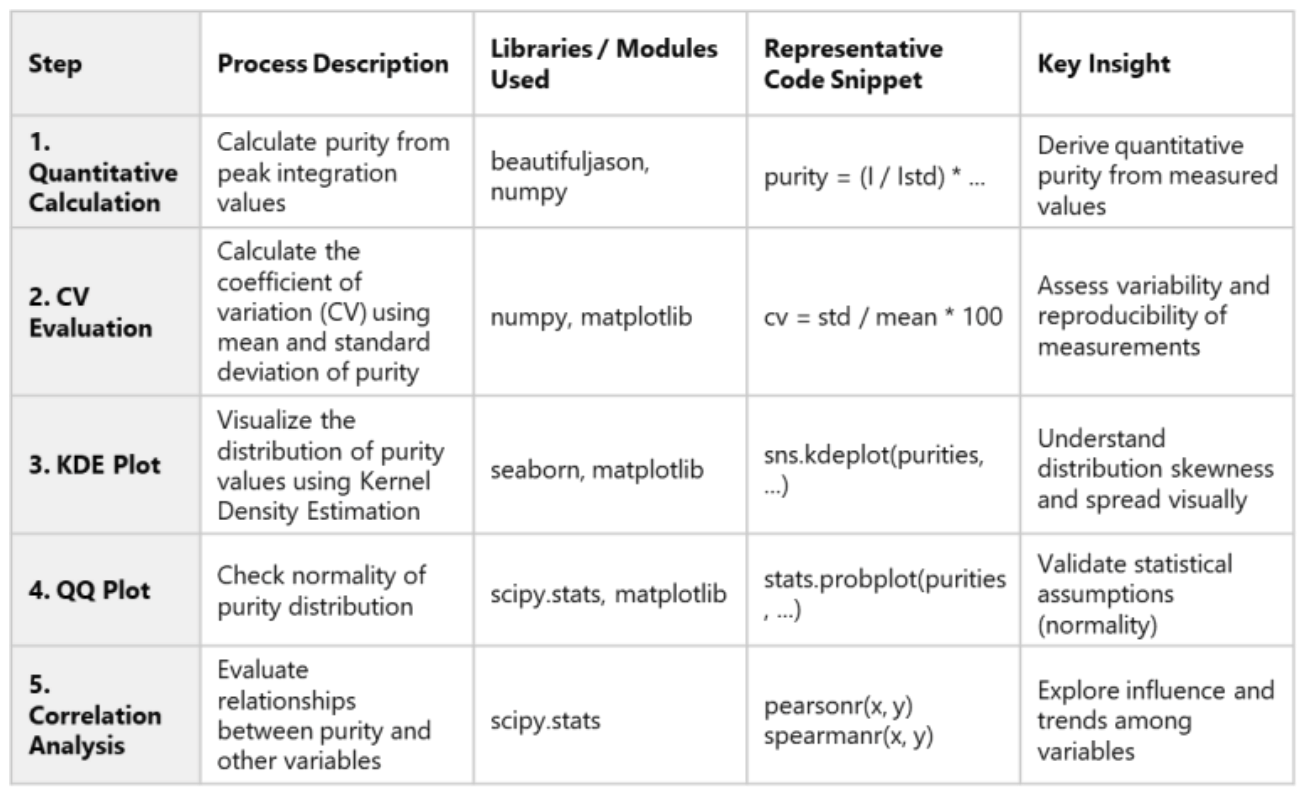
Table 3. Analysis Steps and Considerations for NMR Purity Evaluation
Official Documentation for BeautifulJASON
For detailed information and API references, please refer to the official documentation:
https://www.jeoljason.com/beautifuljason/docs/
Example: Statistical Analysis of Multiple NMR Datasets Using BeautifulJASON
This section presents an example of statistical analysis performed on multiple .jjh5-formatted NMR datasets.
Using BeautifulJASON, peak information was extracted from each file, followed by quantitative calculations.
The analysis included:
Coefficient of Variation (CV) for variability assessment (Figure 2)
Kernel Density Estimation (KDE) plots for visualizing data distribution (Figure 3)
QQ plots for checking normality (Figure 4)
Correlation analysis for identifying influential factors (Figure 5)
These methods enable quantitative evaluation of measurement variability, distribution characteristics, and relationships between variables.
This type of analysis is particularly useful for assessing measurement reproducibility and comparing samples.
The analysis steps and key considerations are summarized in Table 3.
Variability Assessment Using Coefficient of Variation (CV)
For multiple NMR data files, the Coefficient of Variation (CV) was calculated based on the mean and standard deviation of peak purity values.
CV is a metric that expresses the ratio of the standard deviation to the mean, and is commonly used to evaluate the variability and reproducibility of measurements.
As shown in Figure 2, files such as test3 and test2 exhibited relatively high CV values, indicating greater variability.
In contrast, test5 and test8 showed lower CV values, suggesting more consistent measurements.
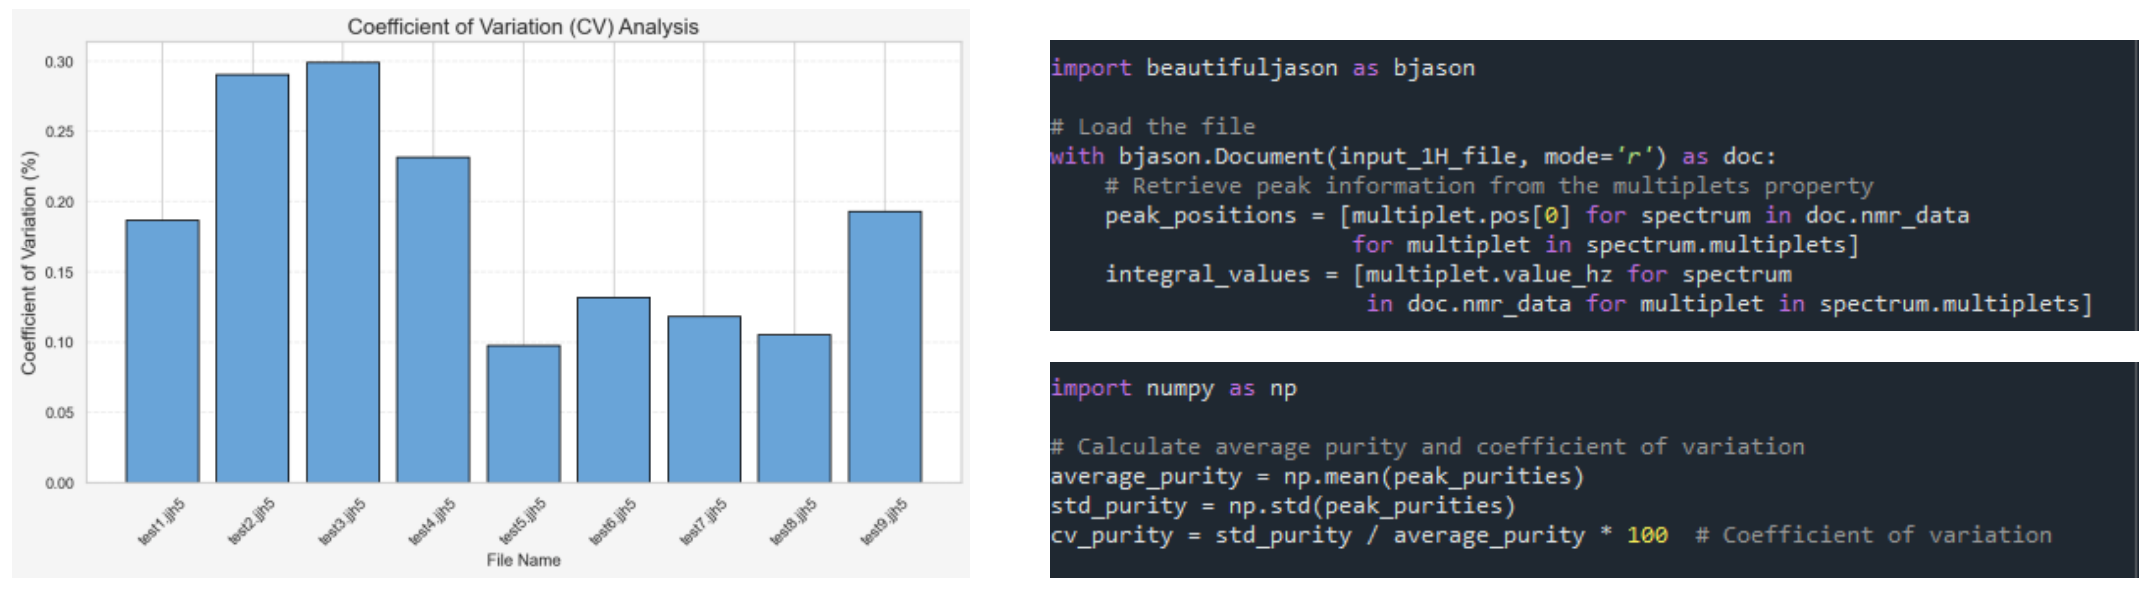
Figure 2. Coefficient of Variation-Based Comparison and Code Snippet for CV Calculation
Visualizing Data Distribution Using KDE Plots
Figure 3 shows the distribution of peak purity values for each NMR file, visualized using Kernel Density Estimation (KDE).
KDE plots provide a smooth curve representation of data distribution, offering more detailed insights than histograms.
They are particularly useful for visually assessing variability and skewness in purity measurements.
For example:
A wider distribution suggests greater variability in purity values. A narrower distribution indicates more stable and consistent measurements.
Overlaying KDE plots for multiple files allows for direct comparison of measurement conditions and differences between samples.
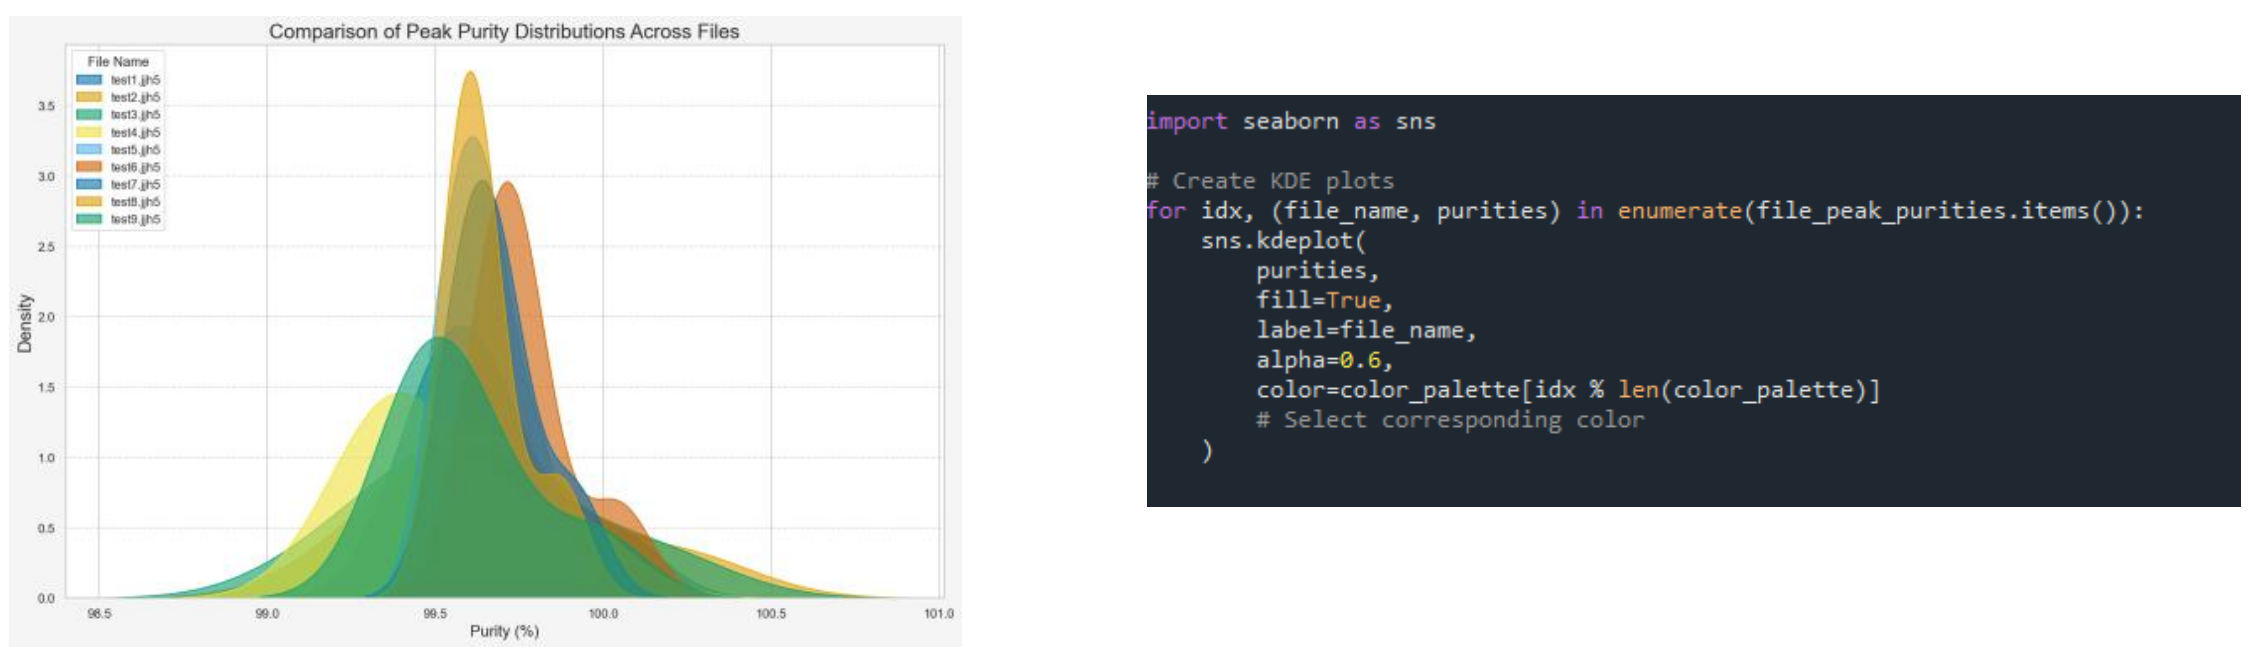
Figure 3. Peak Purity Distribution Comparison via KDE Plot and Code Snippet for Plot Generation
Checking Normality Using QQ Plots
Figure 4 shows the results of evaluating the agreement between peak purity values for each NMR file and a theoretical normal distribution using Quantile-Quantile (QQ) plots.
A QQ plot is a graphical method for assessing whether a dataset follows a theoretical normal distribution by comparing the quantiles of the observed data with those of the theoretical distribution.
The closer the points lie to a straight line, the more closely the data approximates normality.
When outliers are present, the ends of the plot tend to deviate significantly from the line.
In this analysis, all datasets exhibited strong linearity, confirming that the assumption of normality is valid for subsequent statistical analyses.
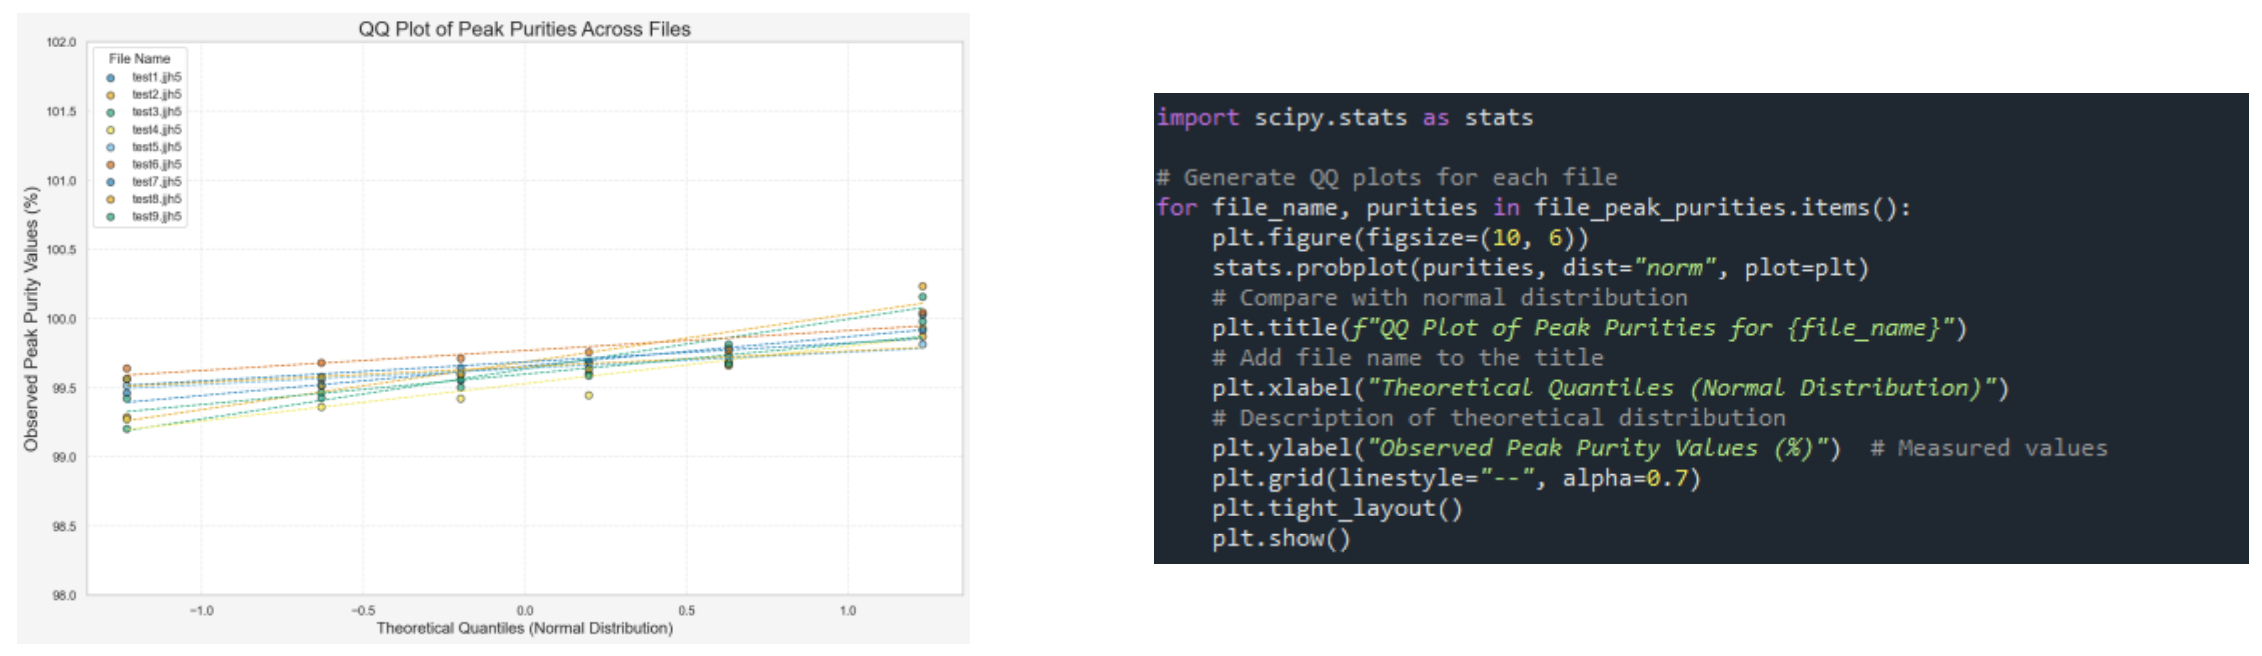
Figure 4. Visualization of Normality Using QQ Plot and Excerpt from QQ Plot Generation Code
Evaluating Relationships Through Correlation Analysis
Figure 5 presents the results of assessing the relationships between multiple variables (chemical shift, integration values, CV) and peak purity using Pearson and Spearman correlation coefficients.
The correlation coefficients (r for Pearson, ρ for Spearman) provide a comprehensive evaluation of both linear and non-linear relationships.
In this case, all correlation coefficients were small in absolute value, and p-values were high, indicating no statistically significant correlations.
This suggests that the quantitative results are stable with respect to these variables and are minimally influenced by measurement conditions.
Although a negative correlation with CV was observed, the correlation coefficient was small and not statistically significant, indicating that further investigation would be required to establish any causal relationship.
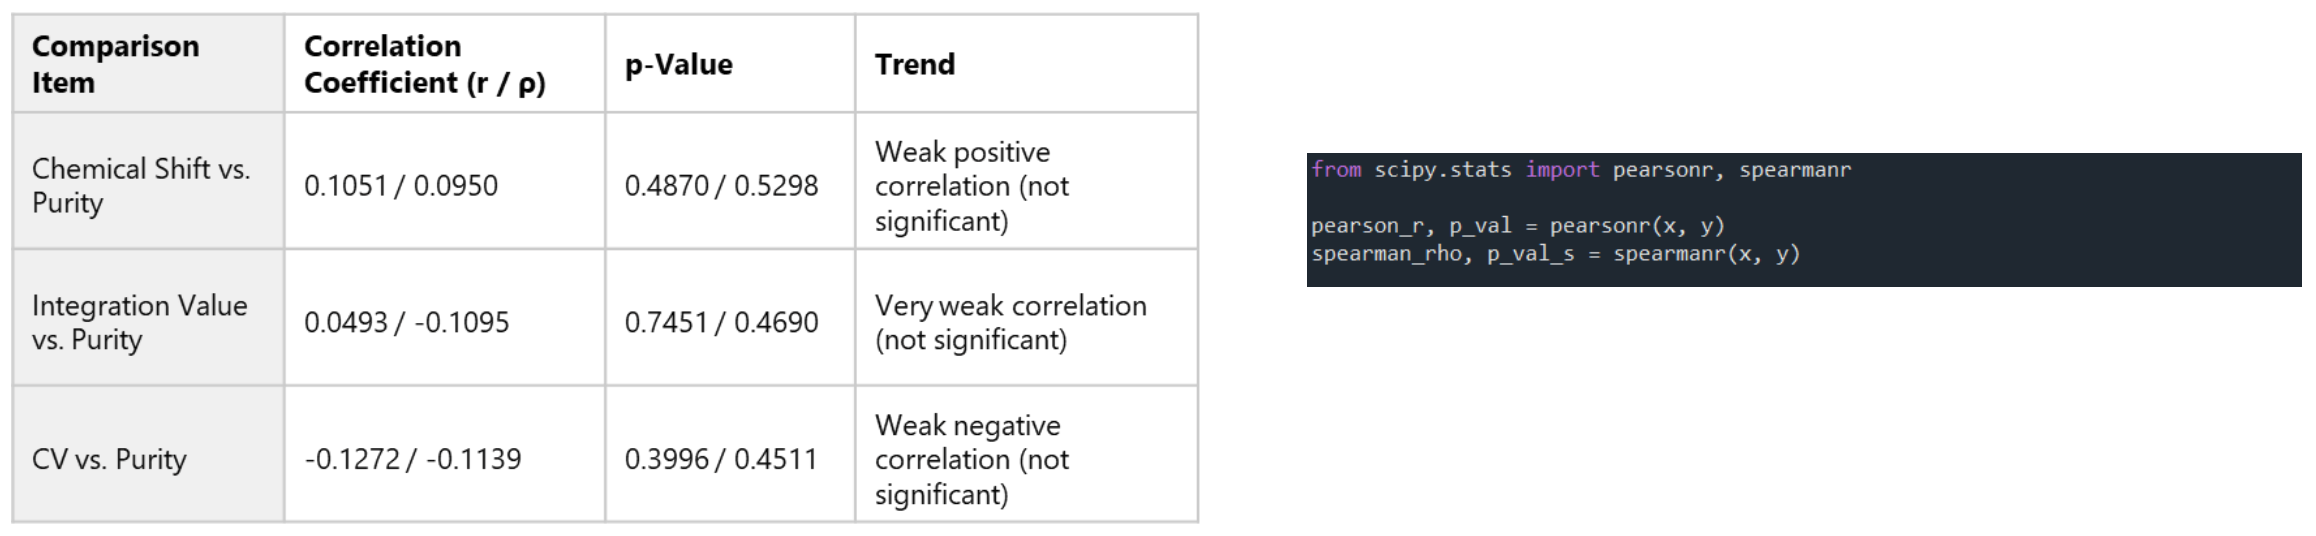
Figure 5. Relationship Evaluation via Correlation Analysis and Excerpt from Correlation Analysis Code
2. Batch Processing Example Using JASON × BeautifulJASON × Python
This section introduces an example of automated NMR data analysis using Python scripts.
By utilizing the script files provided in “Batch Processing with BeautifulJASON”, available from the official JASON website, multiple NMR datasets can be processed automatically by applying JASON’s Rule functionality[5], followed by exporting the results as CSV files.
Table 4. Three-Step Workflow for NMR Batch Processing Using
Batch Processing with BeautifulJASON: Provided Scripts
Two script files are available:
jason_batch_convert.py: Performs batch conversion of data using JASON’s Rule functionality
batch_extract_integrals.py: Extracts integration values from converted data and outputs them in CSV format
Both scripts are included in the BeautifulJASON installation package.
To ensure proper access and usage, users are encouraged to install BeautifulJASON.
Processing Steps
Table 4 summarizes the three main steps for NMR batch processing using JASON.
Conversion Script (jason_batch_convert.py)
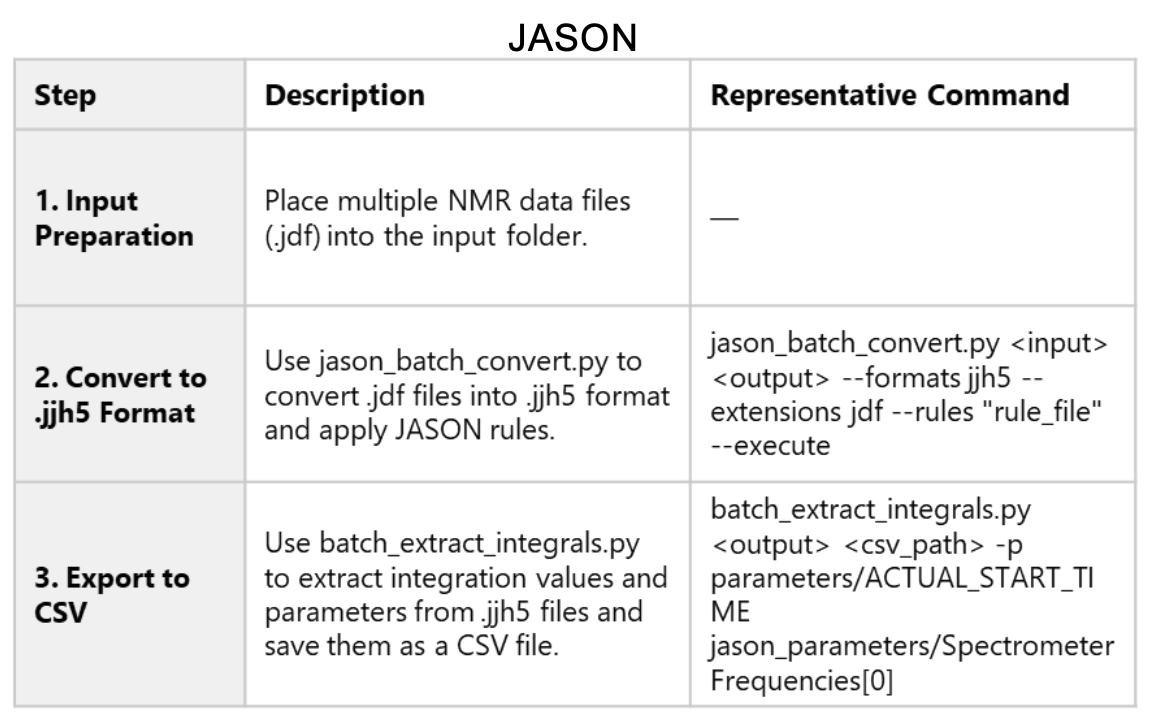
Figure 6 shows a portion of the jason_batch_convert.py code.
This script applies JASON’s Rule functionality to convert data into formats such as .jjh5.
In particular, the argument-handling section within the main() function clearly describes the meaning of each command-line option, which helps users understand how to execute the script.
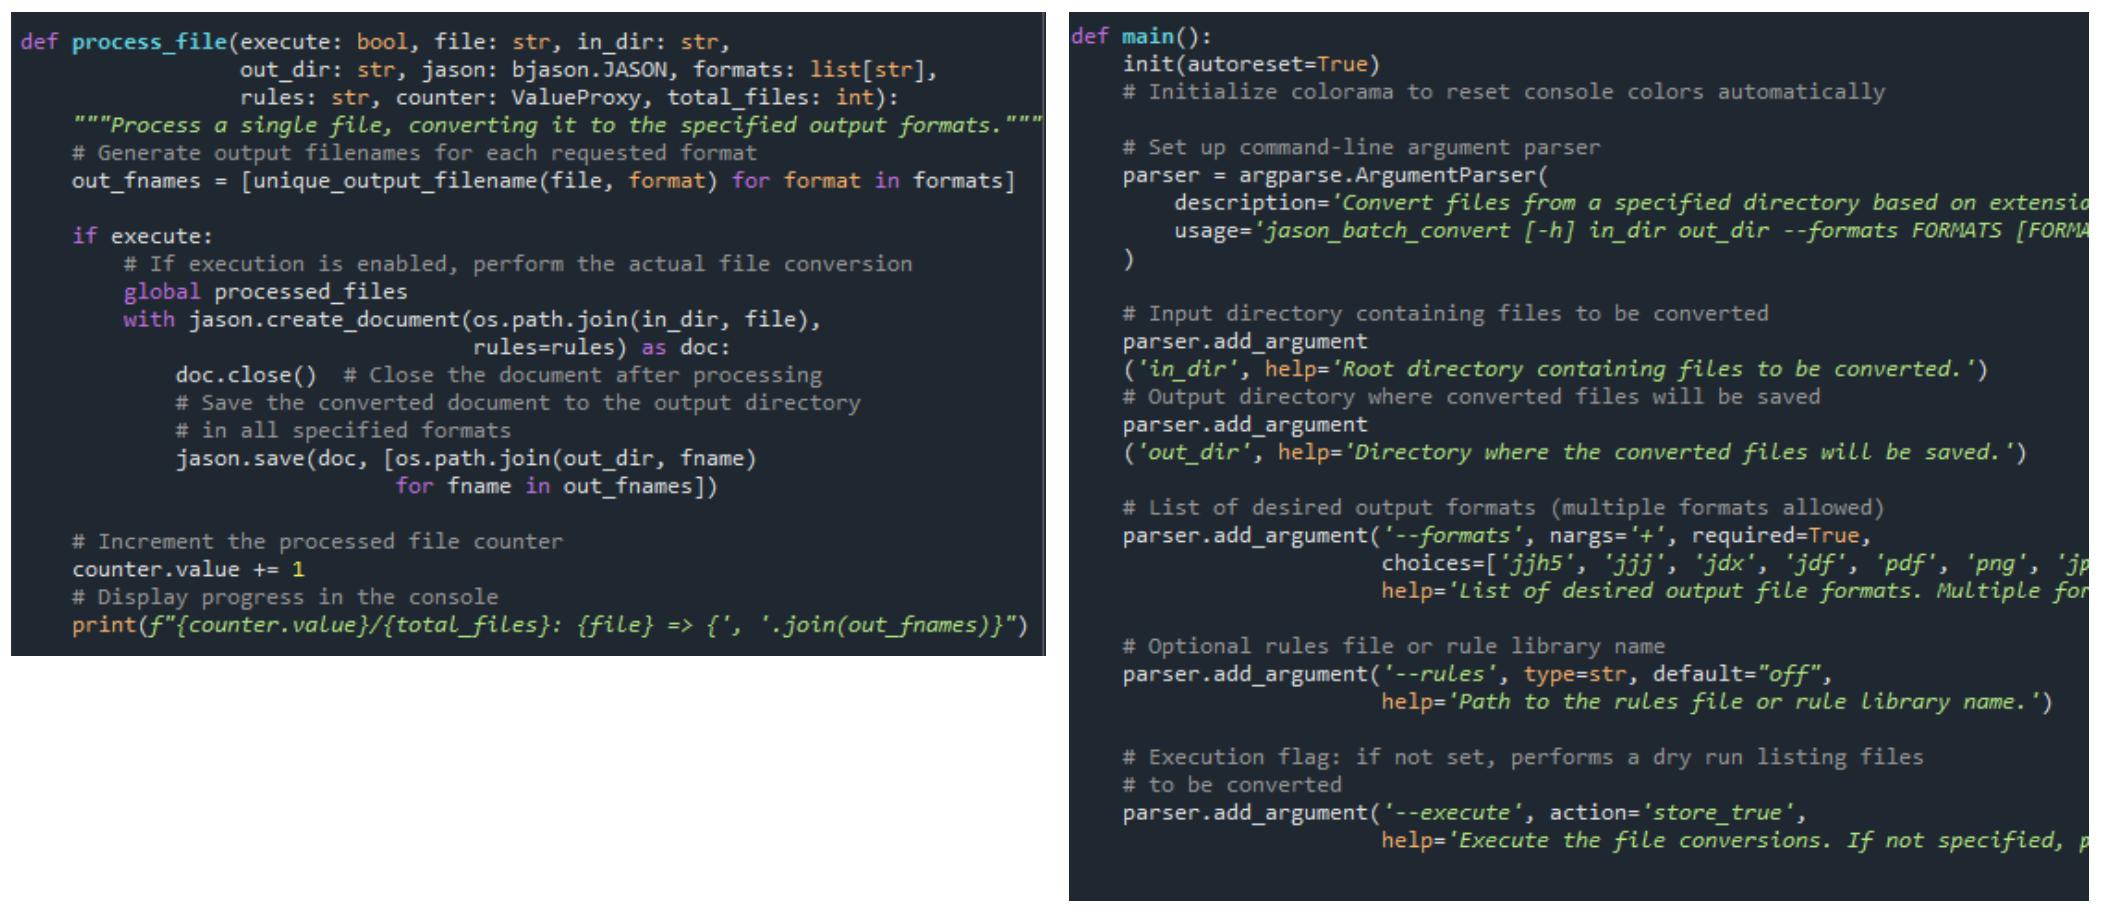
Figure 6. Code snippet demonstrating .jdf file conversion and the use of JASON rule-based processing
Output Script (batch_extract_integrals.py)
Figure 7 shows part of the batch_extract_integrals.py code.
This script extracts integration values and parameters from .jjh5 files and writes them to a CSV file.
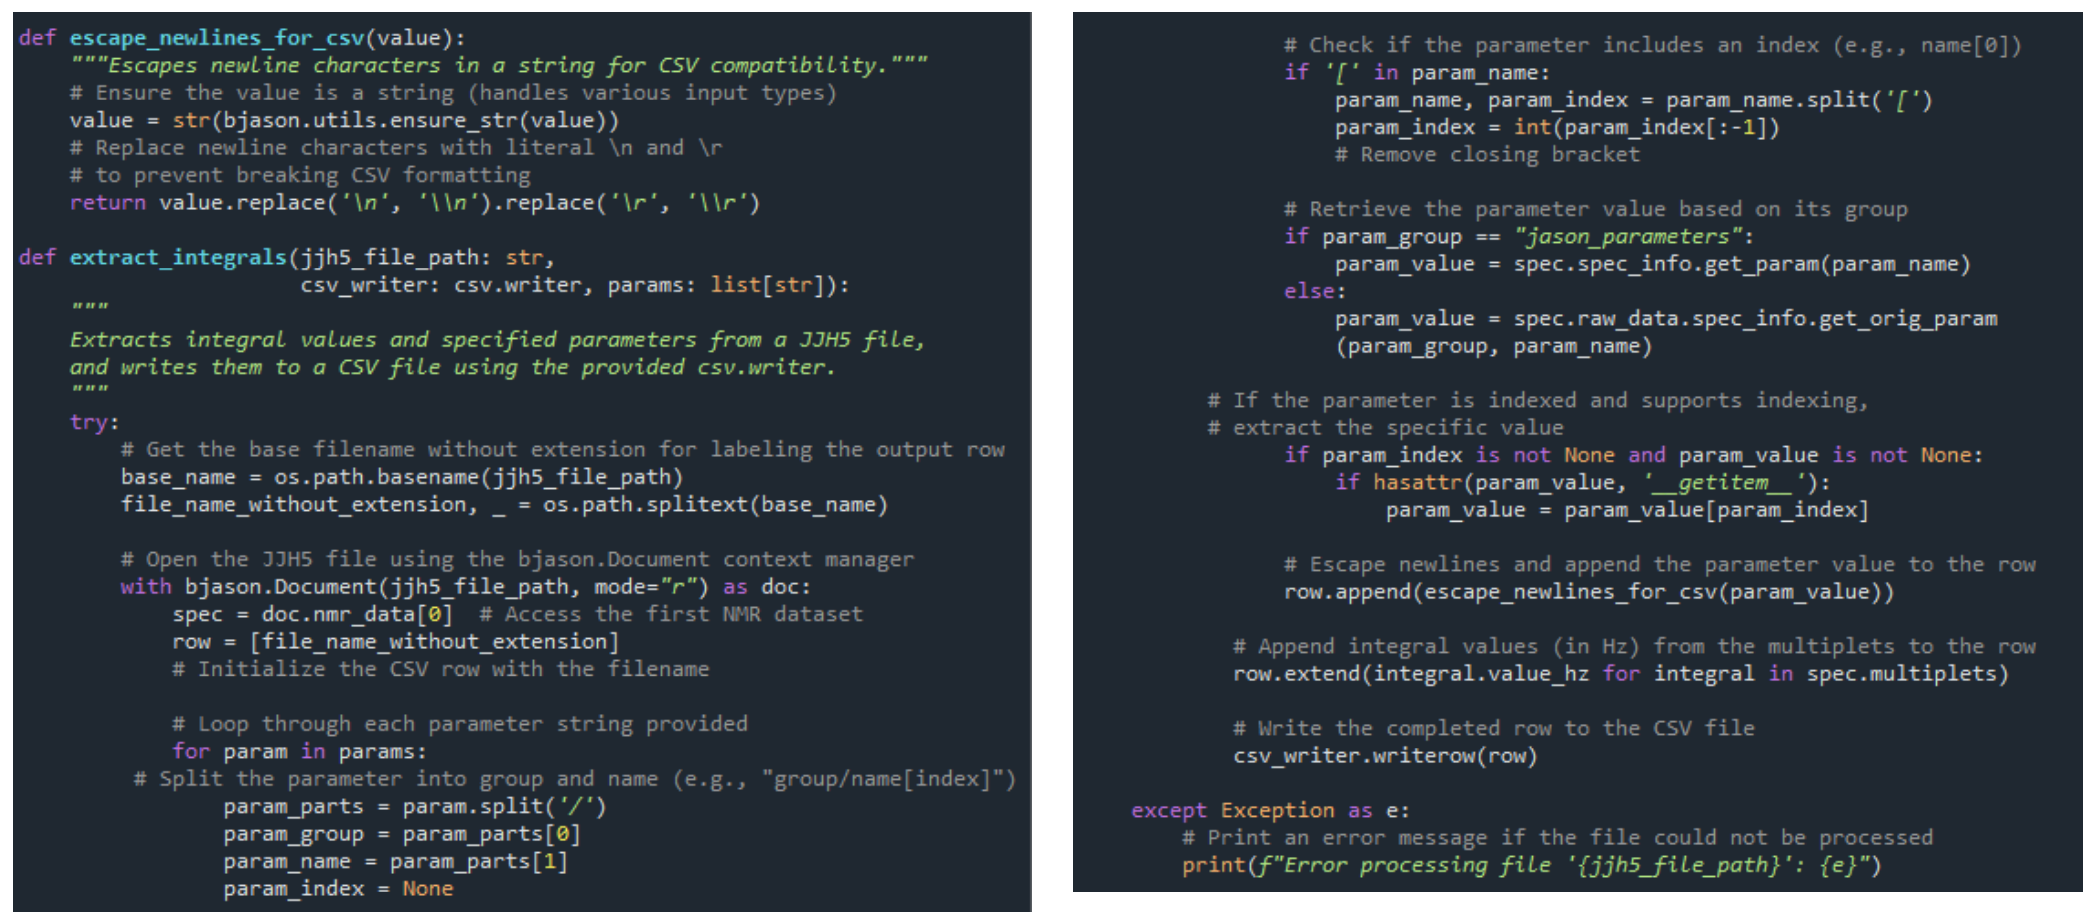
Figure 7. Code snippet demonstrating extraction of integrals and writing to CSV
Output Results
Figure 8 shows an example of the output.
In this example, nine NMR datasets were processed using JASON’s Rule functionality, and the results were compiled into a CSV file.
The contents of the output data and the CSV file are shown in Figure 9.
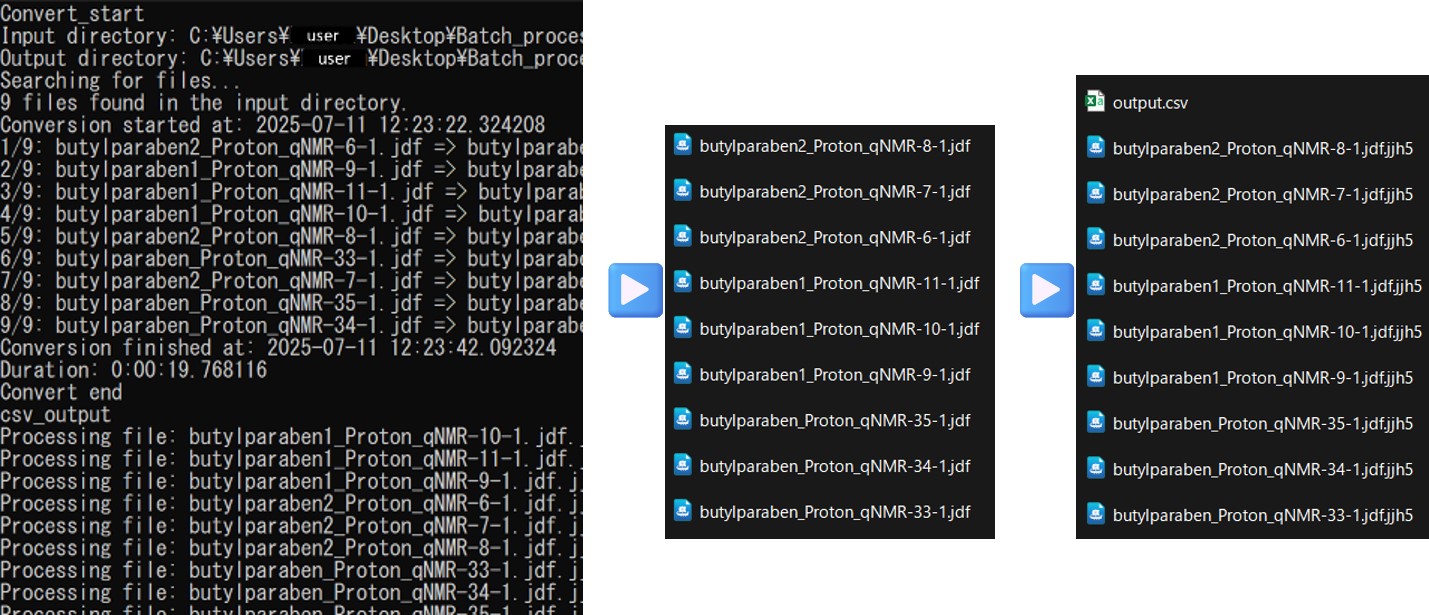
Figure 8. Example of automated analysis using BeautifulJASON batch processing
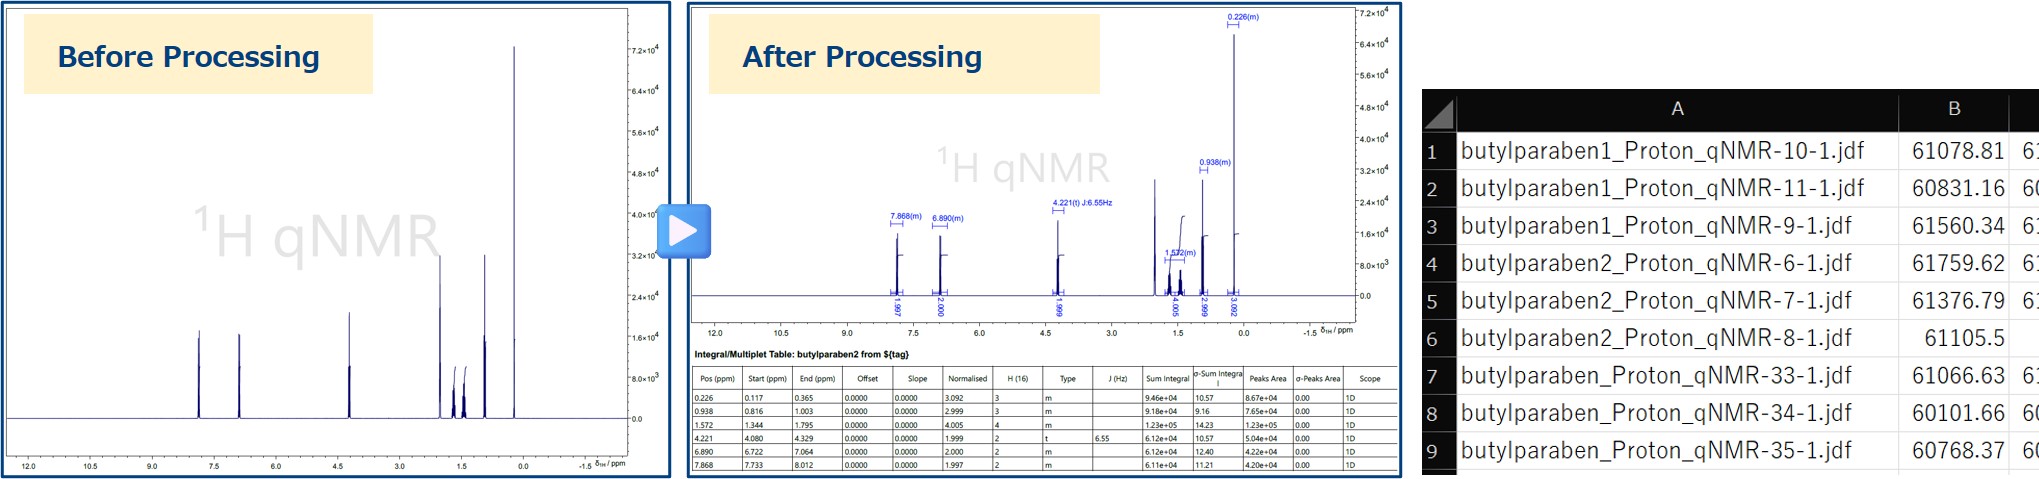
Figure 9. Output results from automated batch processing with BeautifulJASON
Notes and Precautions
Execute the scripts in a Python 3 environment.
JASON Rule files (.jjr) must be created in JASON beforehand.
Use the exact parameter names as displayed in the JASON GUI.
Summary
This document introduced methods for automating NMR spectral analysis using JASON and BeautifulJASON.
By leveraging BeautifulJASON, users can directly access and analyze JASON data from Python, enabling flexible processing and statistical analysis.
In particular, using the official scripts (jason_batch_convert.py and batch_extract_integrals.py) makes it easy to perform batch processing of multiple datasets and export results to CSV format.
References
JASON Official Website: https://www.jeoljason.com/
BeautifulJASON Documentation: https://www.jeoljason.com/beautifuljason/docs/
Batch Processing Script Files: https://www.jeoljason.com/resources-external-nmr-processing-scripts/
Python Official Documentation: https://docs.python.org/3/
[1] JEOL Analytical Software Network
[2] Python is a trademark or registered trademark of the Python Software Foundation.
[3] .jjh5 is the HDF5-based file format used in JASON.
[4] Multiplet refers to a group of peaks in an NMR spectrum resulting from spin-spin coupling.
[5] JASON’s Rule functionality uses configuration files (.jjr) that define spectral processing steps and report layouts, enabling batch processing of multiple datasets.
Solutions by field
Related products


Are you a medical professional or personnel engaged in medical care?
No
Please be reminded that these pages are not intended to provide the general public with information about the products.