Protein-Small Molecule Interaction Analysis Using Saturation Transfer Difference NMR Spectroscopy
NM210013
Spin diffusion and Saturation transfer
When the 1H signals of proteins are selectively irradiated to achieve saturation, the saturation propagates throughout the entire protein molecule via spin diffusion. If a small molecule ligand capable of binding to the protein is present in solution, the 1H magnetization of the ligand becomes saturated through saturation transfer (Fig. 1).
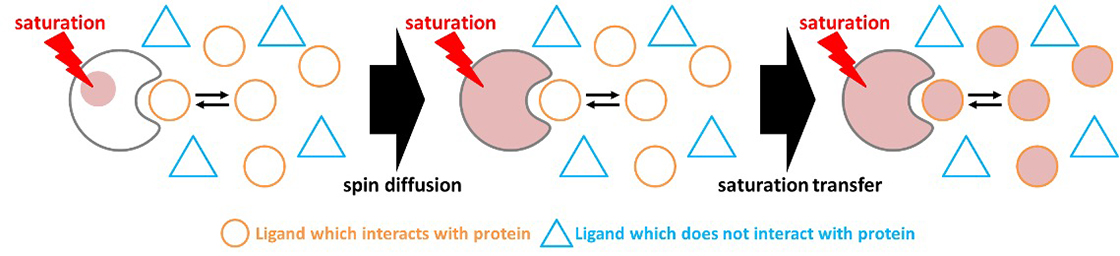
Fig. 1 Schematic diagram of spin diffusion and saturation transfer.
When a signal from the protein is saturated, the saturated state expands to the whole protein molecule, and further, magnetization of low molecule ligand that interact with proteins is saturated. The small molecule that does not interact, does not saturate
STD(Saturation Transfer Difference)
As shown in Fig.1, the protein is saturated by selective irradiation pulse, and then saturation transfer occurs to ligand, the signal intensity of the protein and ligand that interact with the protein decreases. Then, when the difference of the spectrum is taken between when selective irradiation (on resonance) is conducted and when selective excitation is not conducted (off resonance), signal of compounds that do not interact is cancelled and signal from protein and signal from ligand that interact with protein can be acquired. Moreover, before signal acquisition, by adding T1ρfilter, it is possible to eliminate the signal from the protein that is not necessary for analysis. * For actual sequence, spectra of on_resonance and off_resonance are taken alternately. (Fig. 2).
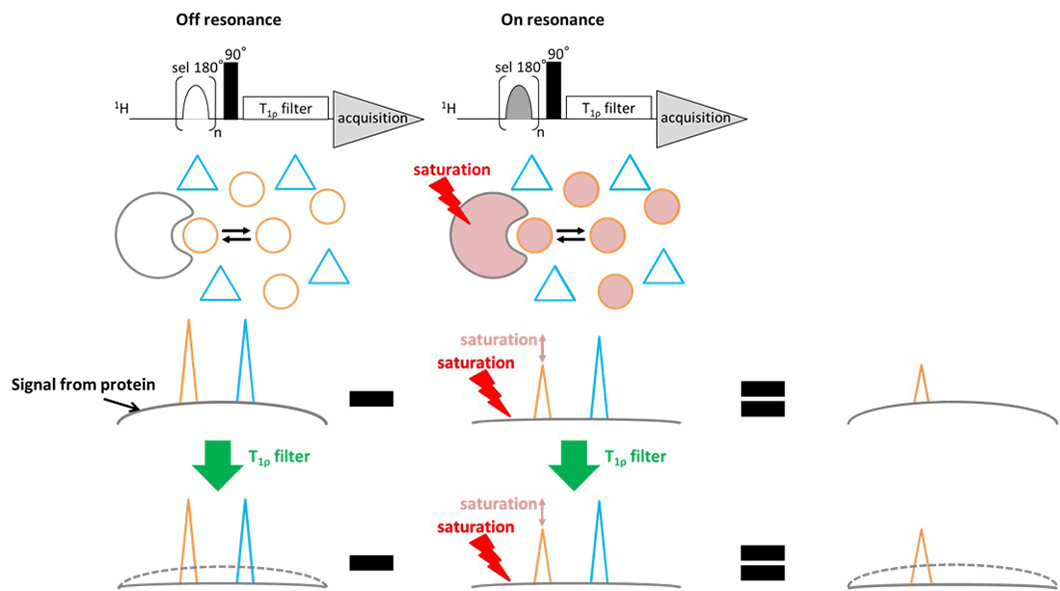
Fig 2. The pulse sequence and conceptual framework of the STD (Saturation Transfer Difference) experiment. The differential spectrum obtained by subtracting the saturated protein spectrum from the reference spectrum enables selective detection of signals originating from both the protein and protein-bound ligand molecules. Furthermore, implementation of a T1ρ filter effectively suppresses the broad resonances characteristic of macromolecular species, thereby facilitating the selective observation of ligand signals that exhibit binding interactions with the target protein only.
Application Example
The followings show the STD analysis results for a ternary mixture comprising 20 µM HSA (Human Serum Albumin), 1.0 mM glucose, and 1.0 mM octanoic acid. The STD spectrum selectively reveals resonances corresponding to octanoic acid, indicating its binding affinity for HSA, whereas glucose signals remain undetected, consistent with its lack of protein interaction. These findings demonstrate the utility of the STD methodology for characterizing molecular interactions between biopolymers such as proteins and low-molecular-weight ligands, establishing its value in pharmaceutical screening applications and related drug discovery endeavors.
Measurement Condition
| Spectrometer | JNM-ECZL400S |
|---|---|
| Probe | Royal HFX probe |
| Software | Delta v.6.1.0 |
| Temperature | 30dC |
| Pulse sequence | proton.jxp sat_transfer_difference.jxp |
| Software | 20 µM HSA +1.0 mM glucose +1.0 mM octanoic acid |
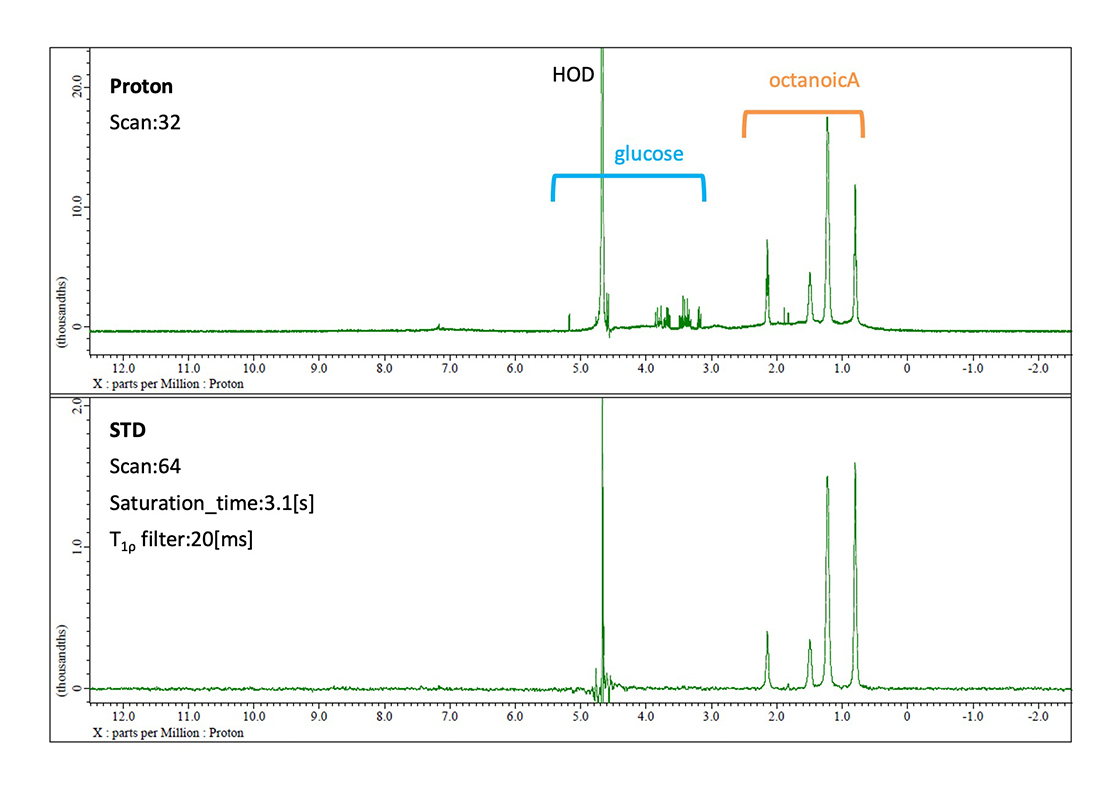
Fig. 3 The proton spectrum and STD spectrum of 20 µM HSA + 1.0 mM glucose + 1.0 mM octanoic acid. In the proton spectrum, both of the signals coming from glucose and octanoic acid are observed. However, in the STD spectrum, only octanoic acid which exhibits binding activity with HSA is observed.
Parameter Setting
The following section outlines critical parameter considerations for optimal STD spectrum acquisition.
Selective excitation frequency (std_sel_onreso) and non-irradiation frequency (std_sel_offreso)
For selective protein excitation frequency (std_sel_onreso), it is essential to identify spectral regions devoid of proton signals from low-molecular-weight compounds, including potential ligands. Typically, the broad methyl proton region between 0.5-0.6 ppm is employed for selective saturation. However, when ligand signals overlap within this region, alternative excitation may be applied to the amide proton region (6-9 ppm) if it remains free of ligand resonances (Figure 4).
The reference frequency (std_sel_offreso) should be positioned sufficiently distant from protein signal regions (e.g., -10 ppm) to ensure adequate spectral separation. Nevertheless, excessive frequency separation from the selective excitation frequency (std_sel_onreso) may introduce spectral artifacts during difference spectrum calculation. Therefore, optimal positioning at the lowest possible frequency within protein-free regions (approximately -2 ppm) may be preferable in certain experimental conditions (Figure 4).
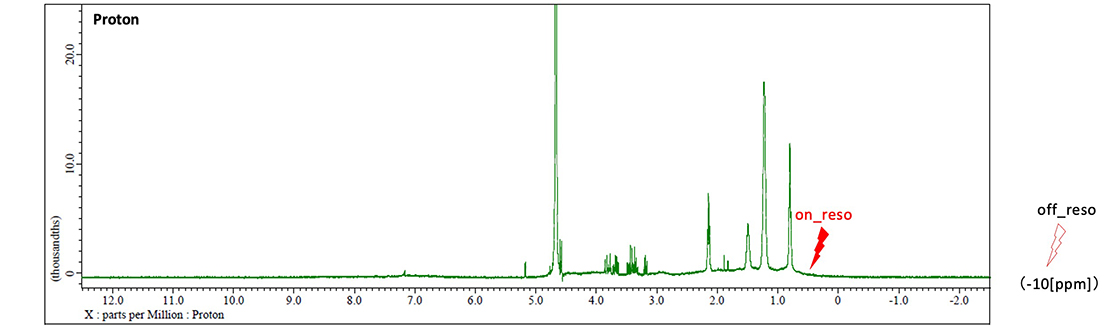
Fig. 4 Chemical shifts of std_sel_onreso and std_sel_offreso in the STD experiment. std_sel_onreso is set to the methyl group region of the protein, and std_sel_offreso is set to the region away from the region where the protein-derived signal is present.
Saturation Time (saturation_time)
For protein saturation, selective excitation pulses are applied continuously. The total saturation time is calculated as the product of std_sel_180 (selective excitation pulse width) and std_loop (number of pulse repetitions). Optimal STD signal sensitivity requires establishing a saturation time sufficient to achieve complete protein proton saturation equilibrium. Consequently, systematic optimization of the std_loop parameter is essential for measurement protocols. Fig. 5 demonstrates the signal intensity profile within the octanoic acid spectral region (0.5-2.6 ppm) as a function of varying std_loop values, utilizing the HSA + glucose + octanoic acid sample. Under these experimental conditions, signal intensity reaches maximum amplitude at approximately std_loop = 120 (corresponding to saturation_time ≈ 2.5 s) and plateaus thereafter, indicating saturation equilibrium. These results suggest that std_loop values of 120 or greater are recommended for optimal experimental performance.
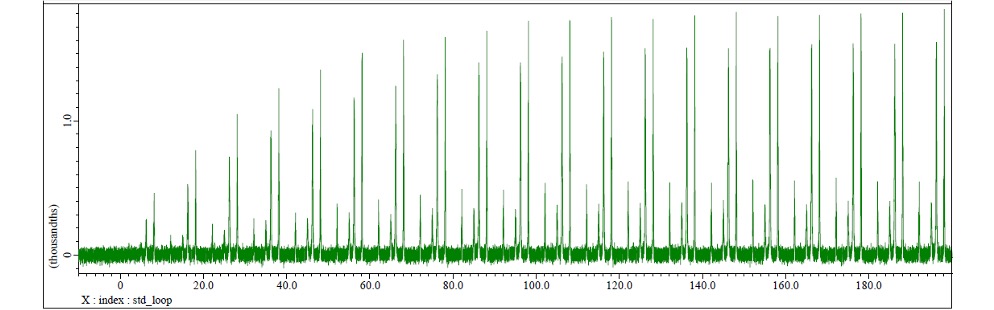
Fig.5 The arrayed spectrum where signal coming from octanoic acid exists when STD is measured by changing std_loop. The signal intensity reached at the maximum at around std_loop=120 (saturation time=2.5[s] ).
T1ρ filter
T1ρ filter is implemented immediately prior to signal acquisition to suppress broad protein resonances. The T1ρ filter methodology selectively attenuates the magnetization components of proteins, which exhibit short transverse relaxation times (T2), through the application of spin-lock pulses (note: T2 and T1ρ may be considered equivalent for practical purposes). Fig. 6 presents an arrayed spectra of the octanoic acid signal region (0.5-2.6 ppm) for each spectrum acquired with varying T1ρ filter durations.
The broadening signals are effectively suppressed by T1ρ filtration. In this experimental system, protein signals are predominantly eliminated at approximately 20 ms filter duration. However, extended filter times beyond this threshold result in progressive attenuation of ligand signal sensitivity. Therefore, optimization of T1ρ filter duration is critical for achieving maximal protein signal suppression while preserving STD signal sensitivity.
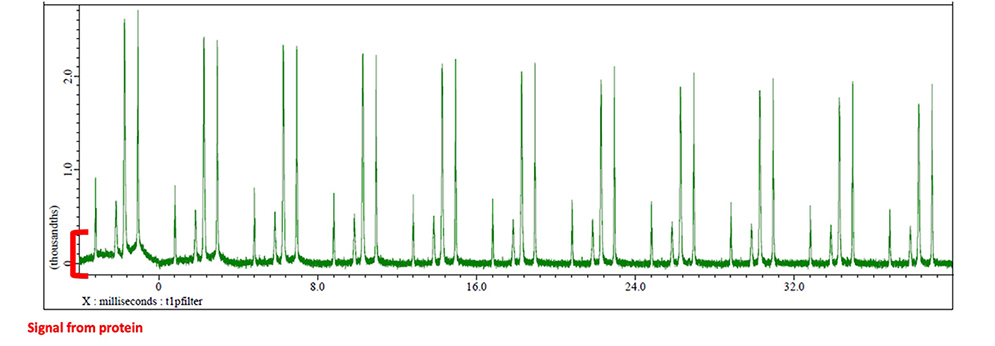
Fig. 6 The arrayed spectra where octanoic acid-derived signals are present when STD is measured while varying the time of T1ρ filter.
The longer T1ρ filter is applied, the protein-derived signal disappears, and at approximately 20[ms], it is almost disappeared. The STD signal intensity exhibits gradual attenuation with extended T1ρ filter durations.
Reference
J. Klein, R.Meinecke, M.Mayer, and B.Meyer, J. Am. Chem. Soc. 1999, 121, 5336-5337.
M. Mayer and B.Meyer, J.Am.Chem Soc. 2001, 123, 6108-6117.
J. Yan, A. D. Kline, H. Mo, M. J. Shapiro, and E. R. Zartler, J. of Magnetic Resonance 163, 2003, 270-276.
Solutions by field
Related products
Are you a medical professional or personnel engaged in medical care?
No
Please be reminded that these pages are not intended to provide the general public with information about the products.