Phase analysis of mass spectrometry imaging data using high-resolution MALDI-TOFMS “NewSpiralTOF™” and vertex component analysis
MSTips No. 528
Matrix-assisted laser desorption/ionization mass spectrometry imaging (MALDI-MSI) is used to visualize the localization of proteins, peptides, metabolites, and drugs on sample surfaces. In MALDI-MSI, the mass spectrum is often influenced by various compounds on the sample section in addition to the peak of the target compounds, making mass separation using a high-resolution mass spectrometer crucial. On the other hand, when numerous peaks, including isobars, are observed in the mass spectrum, creating and analyzing extracted mass images of each peak is extremely time-consuming. Therefore, for efficient data analysis, the extraction of characteristic mass spectral patterns and phase analysis based on them are essential. This report introduces a phase analysis method using vertex component analysis (VCA). Furthermore, a machine learning-based noise reduction method (FINE-AI Filter) was applied as a preprocessing step.
Experiment
VCA extracts endmembers (mass spectra of pixels representing each phase) from the MALDI-MSI hyperspectral dataset for a specified number of phases. Pixels containing endmembers are called pure pixels. In VCA, the mass spectra of pixels other than pure pixels are represented as a linear combination of the extracted endmembers. This concept is illustrated in Figure 1. The blue squares in Figure 1 represent the areas of the mass image data. From there, the most characteristic endmembers are extracted from the pure pixels equal to the number of phases (4 blue dots). The remaining pixels are represented as a linear combination of these four endmembers. For example, the red-dot pixel is represented as a sum of the four pure-pixel endmembers multiplied by 0.70, 0.20, 0.04, and 0.06, respectively. Here, we can see that the coefficients applied to the end members of each phase for each pixel can be mapped. That is, it shows the contribution of each end member to each pixel and enables phase analysis. Figure 2 shows the maps for each phase and the superimposed images.
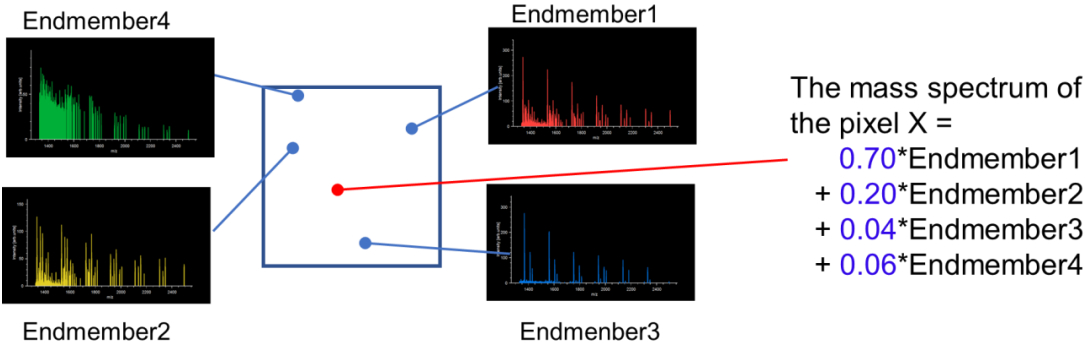
Figure 1 Endmember extraction in VCA
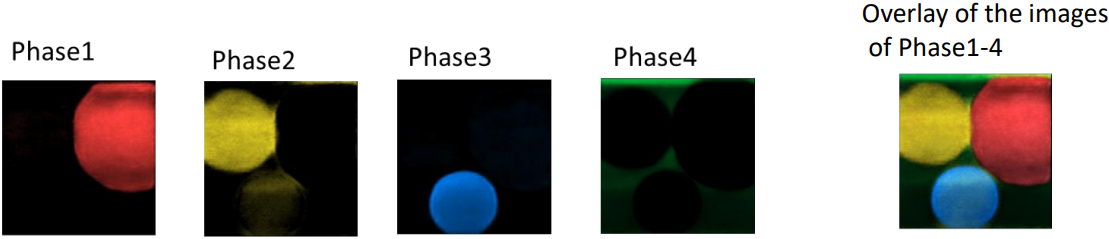
Figure 2 Creating a phase map in VCA
Result
The VCA method described on the previous page was applied to MSI data of lipids in mouse brain tissue sections. First, an average mass spectrum was created from the MSI data. Various lipid peaks were observed in the m/z 700 – 1000 range. The peak list obtained from this average mass spectrum was deisotoped, and 200 extracted mass images were created in descending order of ion intensity. Figure 3 (left) shows 75 of these extracted mass images. Next, image quality improvement was performed on the 200 extracted mass images using the FINE-AI filter. The results for 75 of these images, corresponding to those in Figure 3 (left), are shown in Figure 3 (right). Figure 4 shows the results of applying VCA (with 4 phases) to the 200 extracted mass images after FINE-AI filtering. By improving the image quality of the extracted mass images with the FINE-AI filter, pure pixel detection became easier with VCA. VCA allows for separation into each phase and comparison of the mass spectra of pure pixels in each phase. In addition, for MSI data, it is also possible to generate mass spectra weighted and summed according to the intensity distribution of the VCA phase maps for each pixel, allowing more detailed comparison of mass spectra between phases (Figure 5).
Conclusion
High-resolution MALDI-MSI data was analyzed using VCA to extract characteristic spectral patterns and perform phase analysis based on them. It was also found that applying image quality enhancement using a FINE-AI filter as a preprocessing step made VCA more effective.
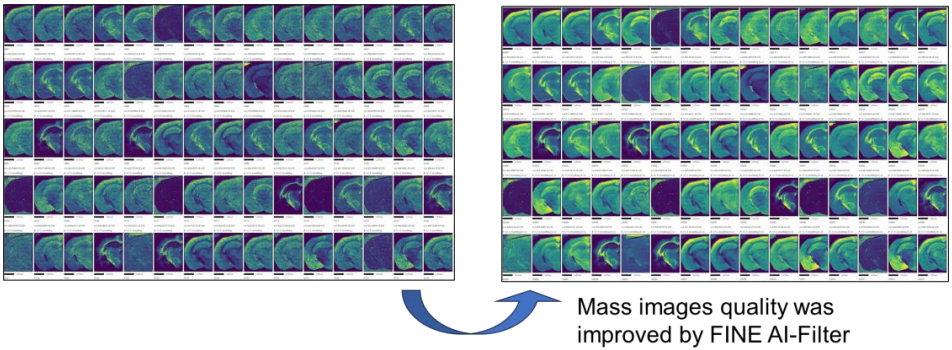
Figure 3 Image quality improvement using FINE-AI Filter as a pre-processing step for VCA.
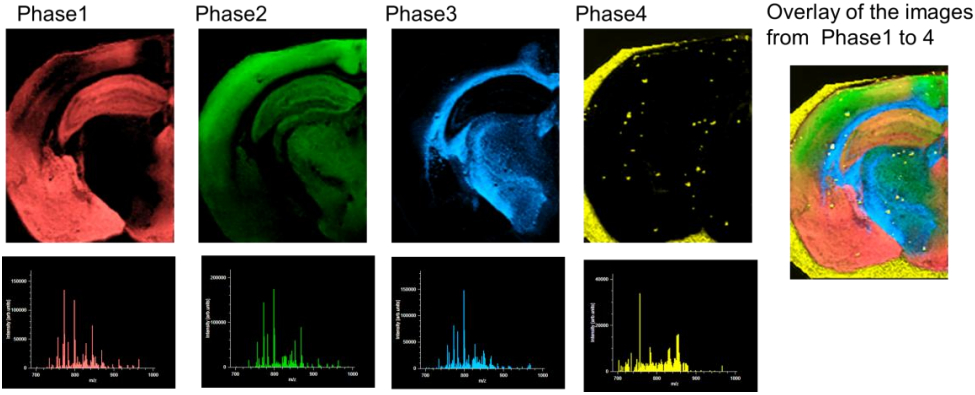
Figure 4 Result of VCA
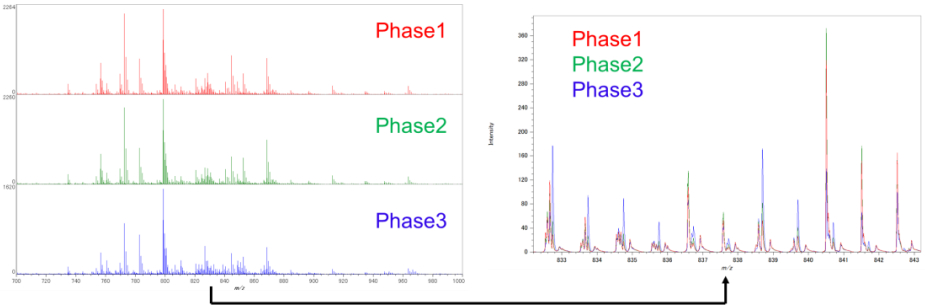
Figure 5 Generation and comparison of mass spectra for each phase.
Solutions by field
Electrical / Electronic Component
Related products
Are you a medical professional or personnel engaged in medical care?
No
Please be reminded that these pages are not intended to provide the general public with information about the products.