Combining JMS-S3000 "SpiralTOF™-plus3.0" and size exclusion chromatography to analyze the end groups of high dispersity synthetic polymers and visualizing changes in the end groups
MSTips No. 495
Matrix-assisted laser desorption ionization time-of-flight mass spectrometry (MALDI-TOFMS) can detect singly charged ions over a wide mass range, making it a powerful tool for structural analysis of polymers, such as confirmation of molecular weight distribution and estimation of end group compositions. However, in the analysis of polymers with high polydispersity, "mass discrimination" is an issue, in which the ion intensity in the high molecular weight range decreases due to various factors. On the other hand, size exclusion chromatography (SEC) can separate polymers by molecular weight, but it is challenging to identify end groups. Therefore, it is known that fractionating polymers with high polydispersity according to their molecular weight distribution by SEC, reducing the polydispersity, and then characterizing each fraction by MALDI-TOFMS are effective. In this report, we performed an end-group analysis of polymer samples with a high polydispersity and molecular weight of less than 50,000 by combining SEC and high-performance MALDI-TOFMS. In particular, we report on (i) improvement of the efficiency of fractionation by SEC and pretreatment for MALDI-TOFMS measurement, (ii) improvement of visualization of end group changes in mass spectra of SEC fractionated samples with reduced polydispersity, (iii) End group analysis in the high molecular weight region (molecular weight 10,000 to 20,000).
Sample preparation
A mixture of two types of polycaprolactone (PCL) with different end groups was prepared to contain 1.0 mg/mL each. Fractionation by SEC was performed by injecting 100 µL of the sample solution under the conditions shown in Table 1. The eluate from SEC was fractionated into glass eco-cups (Frontier Laboratories) using LC-CollectIR (ST Japan). In this system, the eluate was sprayed with nitrogen gas from a nozzle at 100 °C, and the solvent was evaporated while fractionating. For MALDI-TOFMS, the amount of sample solution that can be used in one measurement is about 10 µL or less. By evaporating the solvent during fractionation, it is no longer necessary to concentrate the eluate, making it possible to shorten the preparation time. In addition, since the solvent is evaporated during fractionation, it is possible to increase the amount of sample by fractionating multiple times. In this case, fractionation was performed three times. For the sample preparation for MALDI-TOFMS measurements, 10 µL of THF was added to the eco-cup as a fraction solution. 1 µL of the fraction solution and 10 µL of the matrix solution (DCTB was used) were mixed, and 1 µL of the mixture was dropped onto a target plate and dried. The cationization agent (NaTFA) solution was dropped onto the plate and dried beforehand. After that, measurements were performed using the JMS-S3000 in Spiral positive-ion mode. The remainder of Kendrich Mass (RKM) analysis of the mass spectra was performed using msRepeatFinder.
Table 1 Condition of SEC measurement
| Eluent | THF |
|---|---|
| Detector | Differential Refractive Index Detector |
| Column | TSKgel GMHHR-N (30 cm) × 2 (TOSOH) |
| Flow rate | 1 mL/min |
Results
Figure 1 and Table 2 show the results of fractionating a PCL mixture into six fractions by SEC. The black line in Figure 1 is the SEC chromatogram before fractionation. The six fractions fractionated by SEC were then subjected to SEC measurement again to obtain the polymer weight (μg), number average molecular weight, and weight average molecular weight for each fraction. The polydispersity(D) of each fraction was found to be small, at around 1.1 or less.
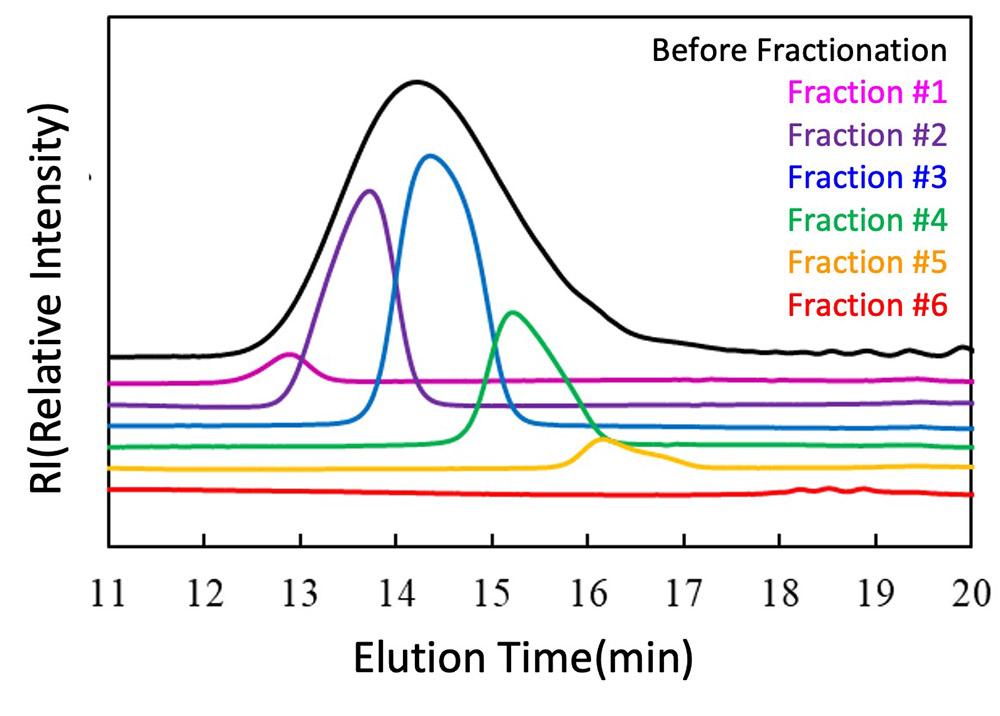
Figure 1 SEC chromatograms before and after fractionation
Table 2 Information of SEC fraction #1-6
| Fraction Number |
Amount (µg) |
Mn | Mw | D |
|---|---|---|---|---|
| 1 | 6.4 | 48,233 | 50,457 | 1.05 |
| 2 | 74.4 | 24,438 | 26,100 | 1.07 |
| 3 | 107.4 | 12,722 | 13,477 | 1.06 |
| 4 | 46.3 | 6,691 | 7,019 | 1.05 |
| 5 | 8.9 | 3,439 | 3,612 | 1.05 |
| 6 | 1.5 | 559 | 624 | 1.12 |
| Total | 245 |
Figure 2 shows the mass spectrum of the PCL mixture before SEC fractionation and the mass spectra of six SEC fractions. From the mass spectra of Fraction #1 to #6, it was confirmed that PCL eluted in the order of high to low molecular weight. In Fraction #1, components above m/z 30,000 were observed, which were not observed before fractionation, and it was found that the mass discrimination effect was reduced. In addition, a comparison was made between the enlarged mass spectrum of Fraction #2 at about m/z 15,000 and the simulation of the isotope pattern, and they were found to match well. Separation of the isotope pattern was confirmed up to about m/z 20,000. On the other hand, although the change in molecular weight distribution can be easily seen by arranging the mass spectra, it is difficult to understand the change in the terminal group due to molecular weight. Therefore, the mass spectra of Fraction #1 to #6 were converted to RKM plots (base unit 114.143u) (Figure 3). In this case, the ion intensities were normalized using the polymer weight information for each fraction obtained from the SEC fractionation results (Table 1). As a result, it became easier to understand that in the low molecular weight region, cyclic oligomers (series A) are the main components, while as the mass increases, two components with the total elemental composition of both end groups being C4H10O (series B) and C4H10O3 (series C) become the main components. Here, the totals of both end groups of series B and series C were obtained from accurate mass analysis in the m/z 2000 region.
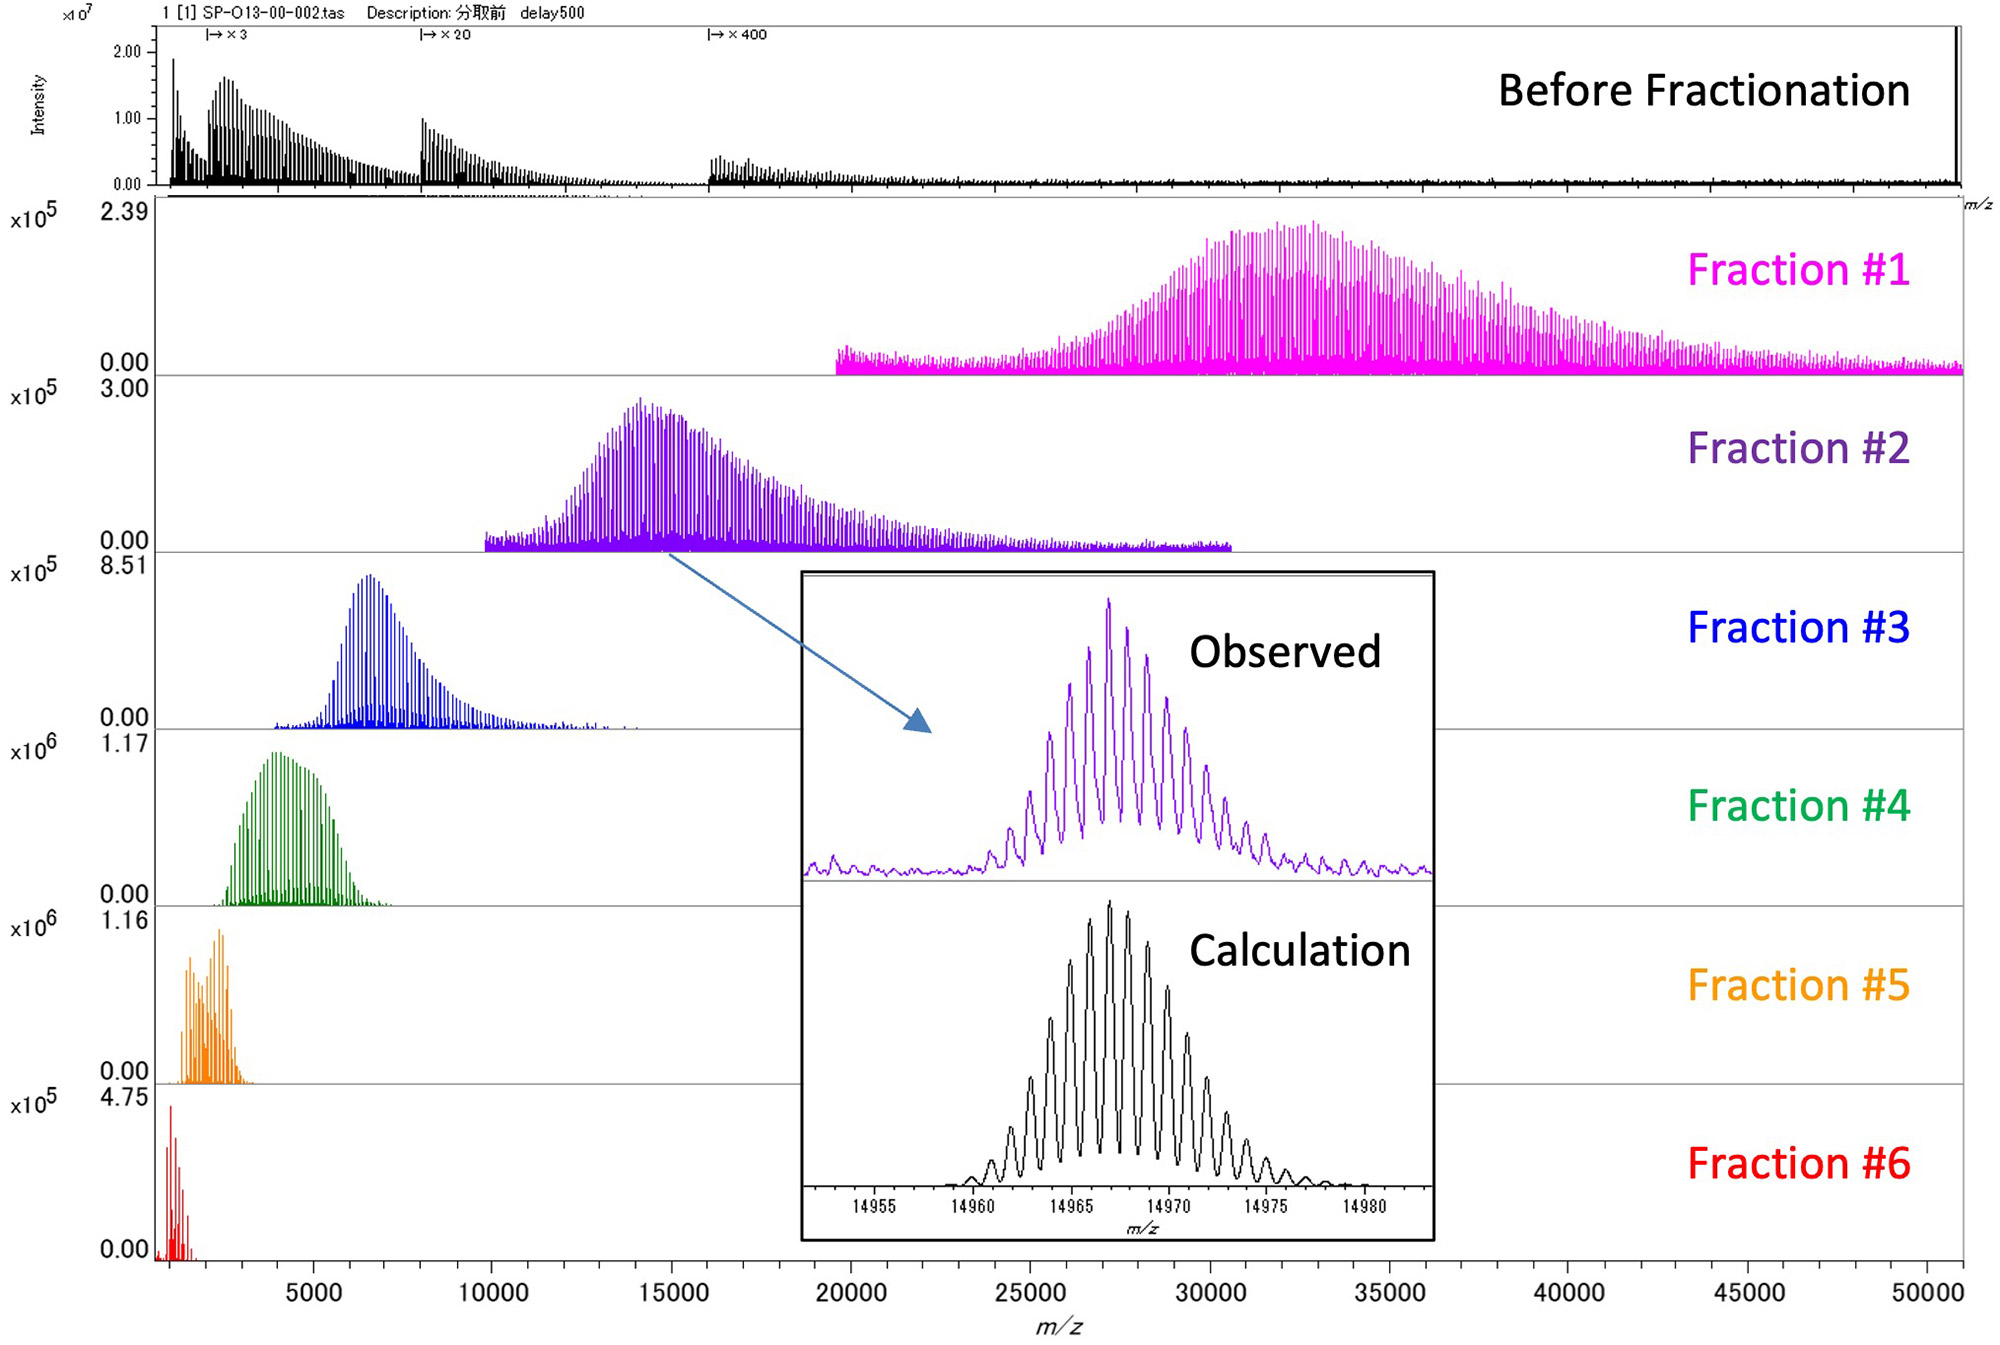
Figure 2 Mass spectra of PCL before and after SEC fractionation.
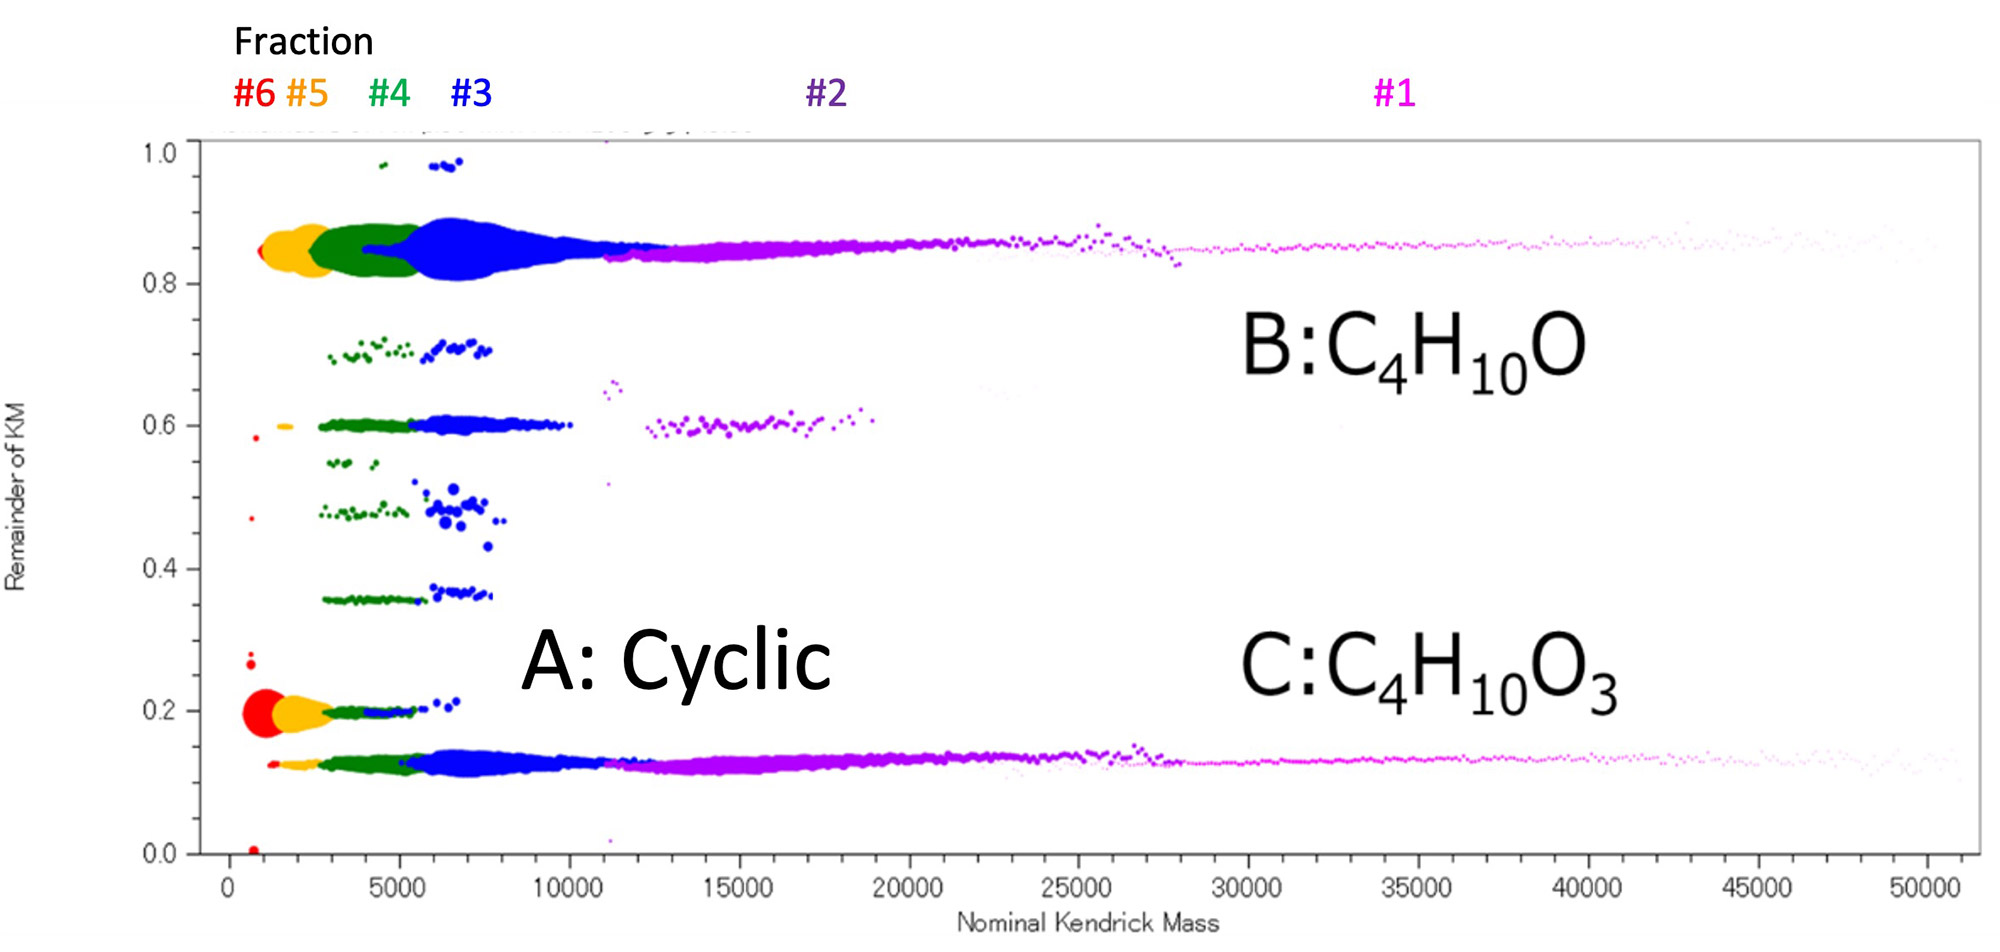
Figure 3 RKM plot of SEC fraction #1-6.
Finally, we examined whether end group analysis using accurate mass is possible in the molecular weight range of over 10,000. Figure 4 shows the variation in mass error (ppm) when self-calibration was performed using series B obtained in fraction #2. The most abundant peaks were used for the calibration, because monoisotopic peaks cannot be observed in this mass region. The mass errors in molecular weight from 12,000 to 24,000 were generally within two ppm, which corresponds to a mass error of about 10 to 20 mDa. This result is considered reasonable because the mass error of a time-of-flight mass spectrometer is independent of the mass range when expressed in ppm units. Next, an enlarged view of the area around m/z 15,000 is shown in Figure 5. Series B and C were mainly observed in the mass spectrum, and their mass differences correspond to O2. The errors of the most abundant peaks of the two series were 32.003 u, 31.990 u, and 31.991 u. A comparison with the accurate mass of O2 (31.990 u) shows the validity of the results in Figure 4. As described above, it is difficult to detect monoisotopic peaks in the mass range exceeding 10,000 molecular weight, so the accurate mass of the most abundant peaks and isotope patterns are used. It is suggested that it is possible to estimate the terminal group structure.
Conclusion
The SEC-MALDI sample preparation was made more efficient by using an apparatus that repeatedly fractionates the fractions from SEC while evaporating the solvent. Combining SEC with MALDI-TOFMS could reduce the effect of mass discrimination in the high molecular weight region. Furthermore, the mass spectrum of each fraction was displayed in an RKM plot, which visualized the change in end groups according to molecular weight. Using the most abundant peak of the isotope pattern obtained by the high-resolution MALDI-TOFMS "SpiralTOF™-plus 3.0", the possibility of end group analysis in the molecular weight range of 10,000 to 20,000 was also demonstrated.
Acknowledgement
This experiment is the result of a joint experiment with TOSOH Analysis and Research Center Co.,Ltd. and ST Japan Inc.
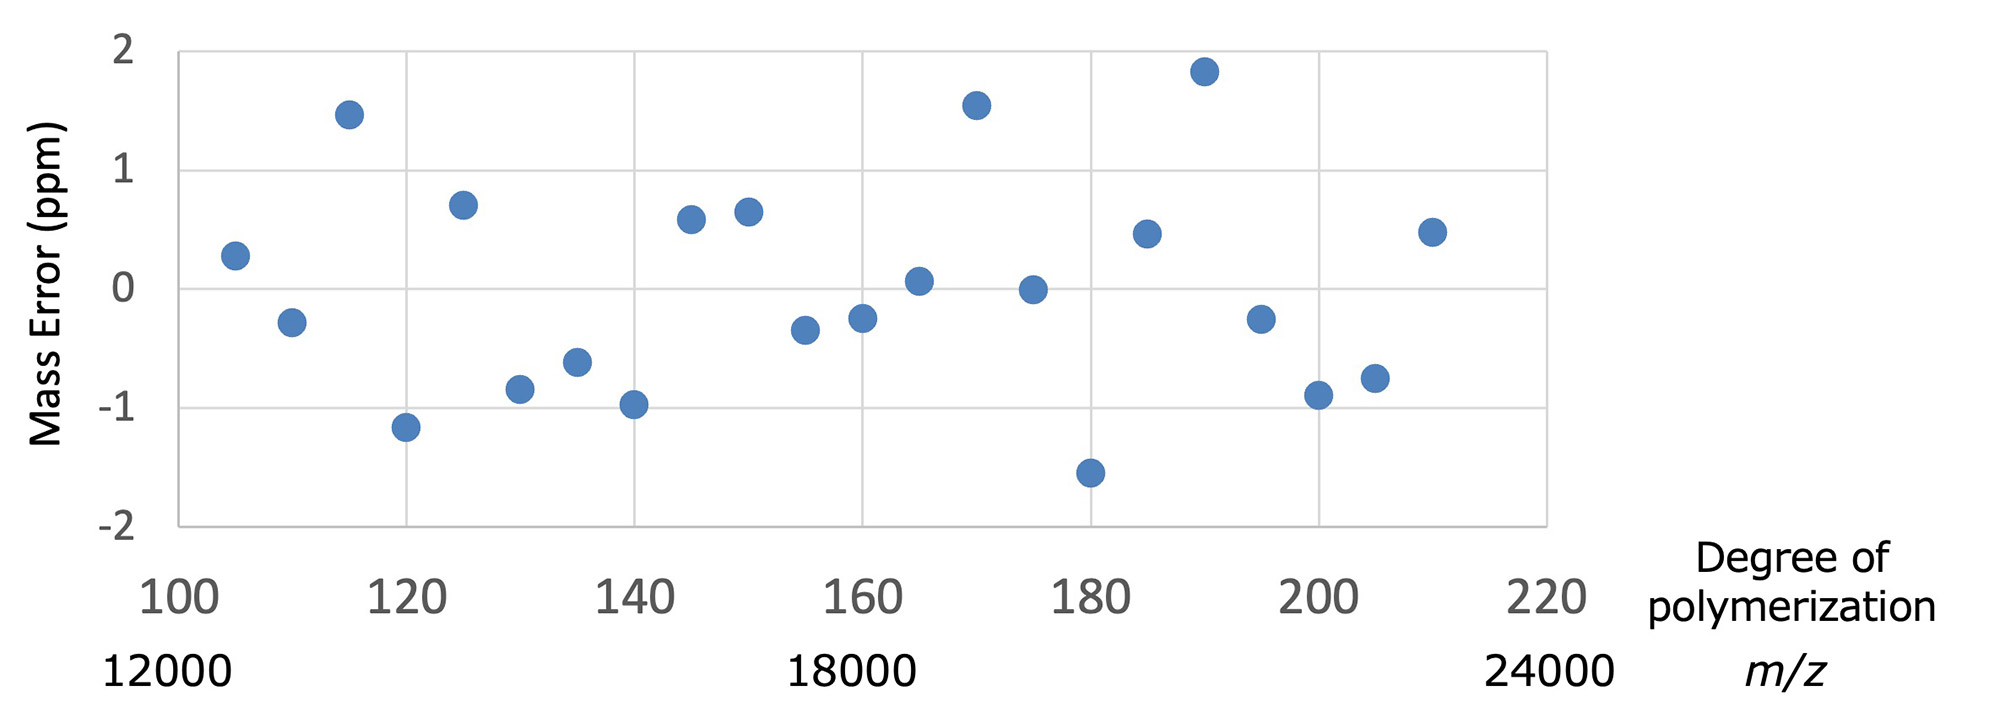
Figure 4 Mass error of the most abundant peaks in series B
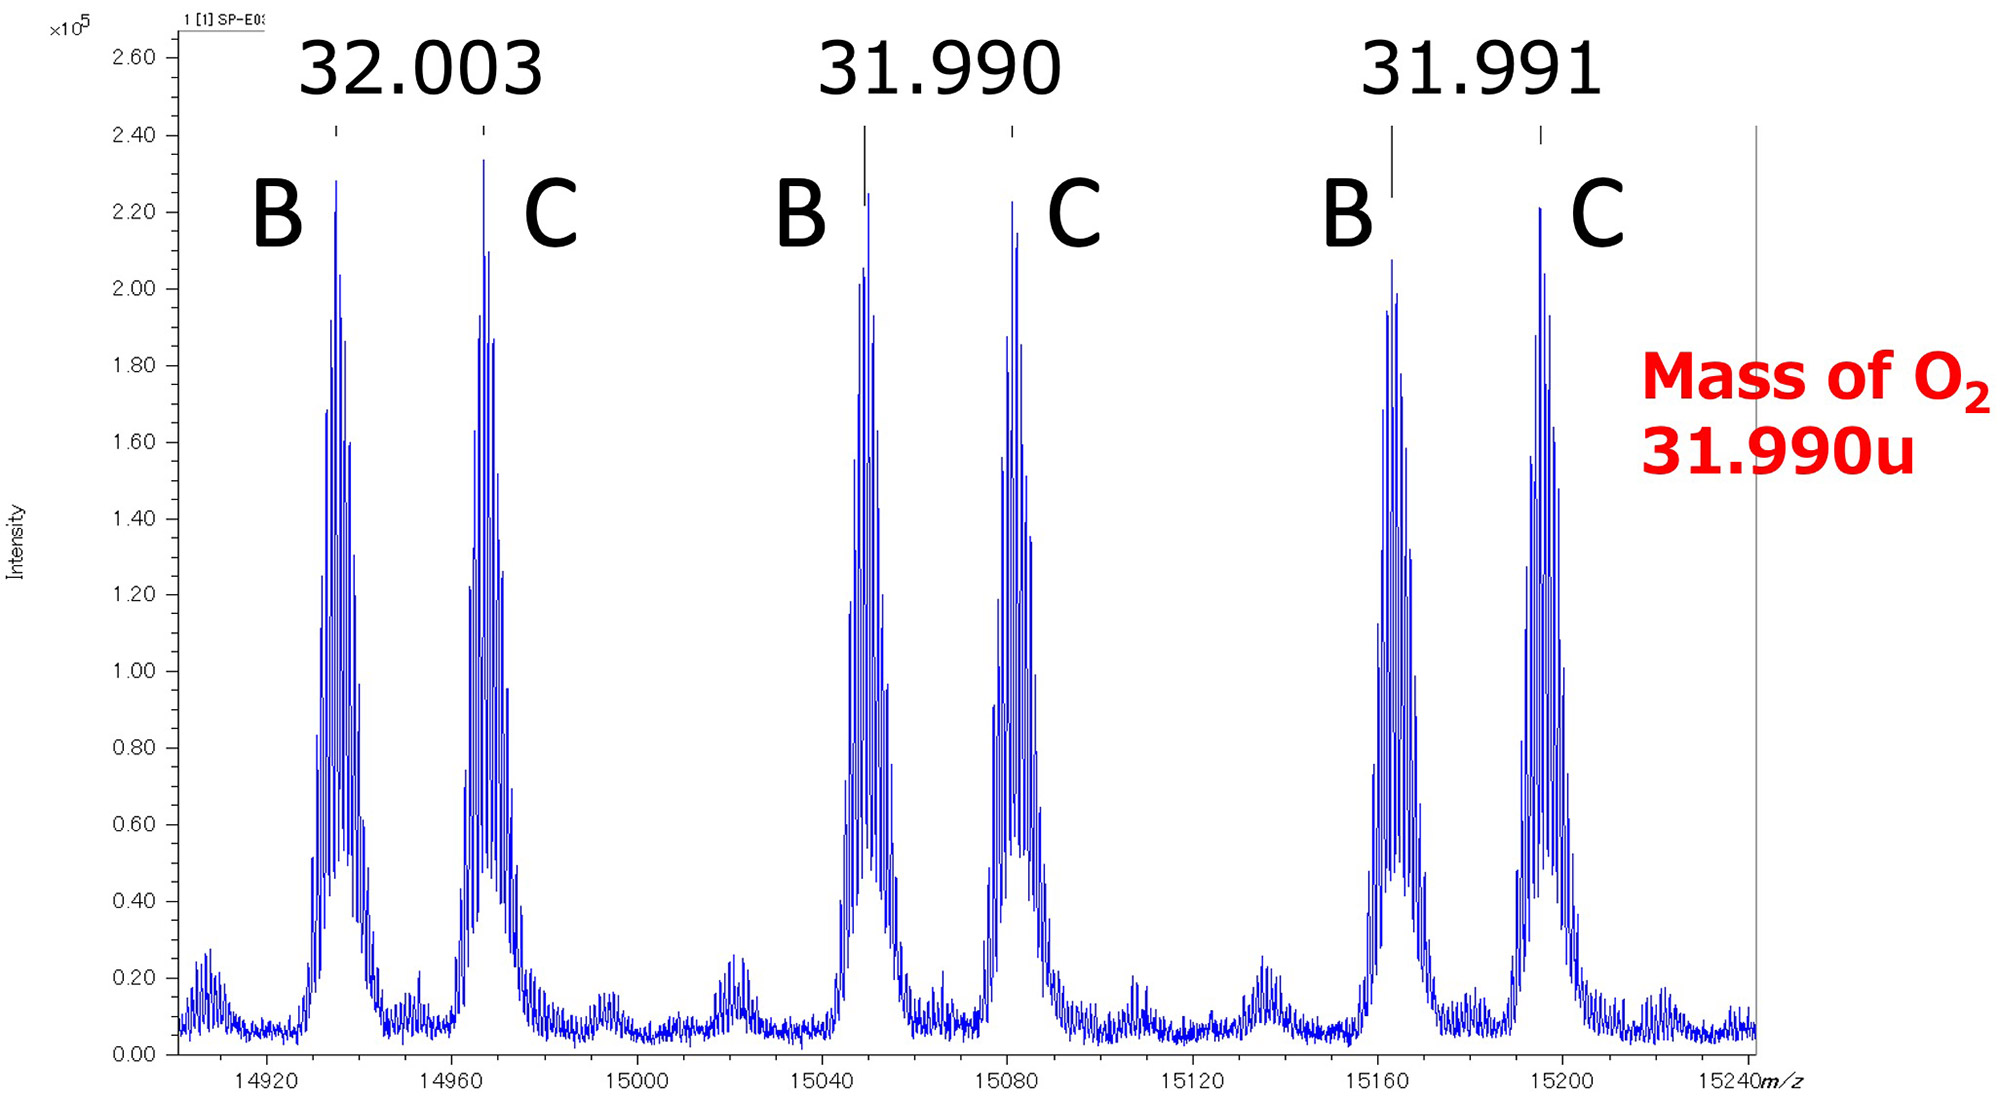
Figure 5 Mass differences between series B and C at m/z 15000.
Solutions by field
Related products
Product category
Are you a medical professional or personnel engaged in medical care?
No
Please be reminded that these pages are not intended to provide the general public with information about the products.