Analysis of Pesticides Using Low-Pressure GC-MS with Nitrogen Carrier Gas
MSTips No. 490
1.Introduction
1.1. low-pressure GC-MS (LPGC-MS)
Vam Deemter equation shows that the separation performance of chromatography depends on the diffusion coefficient of the substance in the mobile phase. It is also established that the diffusion coefficient of a substance in a gas is inversely proportional to the pressure. The low-pressure GC-MS (LPGC-MS) method is a technique that applies this principle and improves the analysis speed by maintaining the column pressure at a vacuum using the vacuum system of the MS. LPGC-MS uses a short analytical column with an inner diameter of 0.53mm to 0.32mm, with a restrictor connected to the GC inlet side (→Figure 1). Reducing the length of the column would normally reduce the separation performance, but in LPGC-MS, we can minimise this effect by improving the separation performance through reducing the internal pressure.
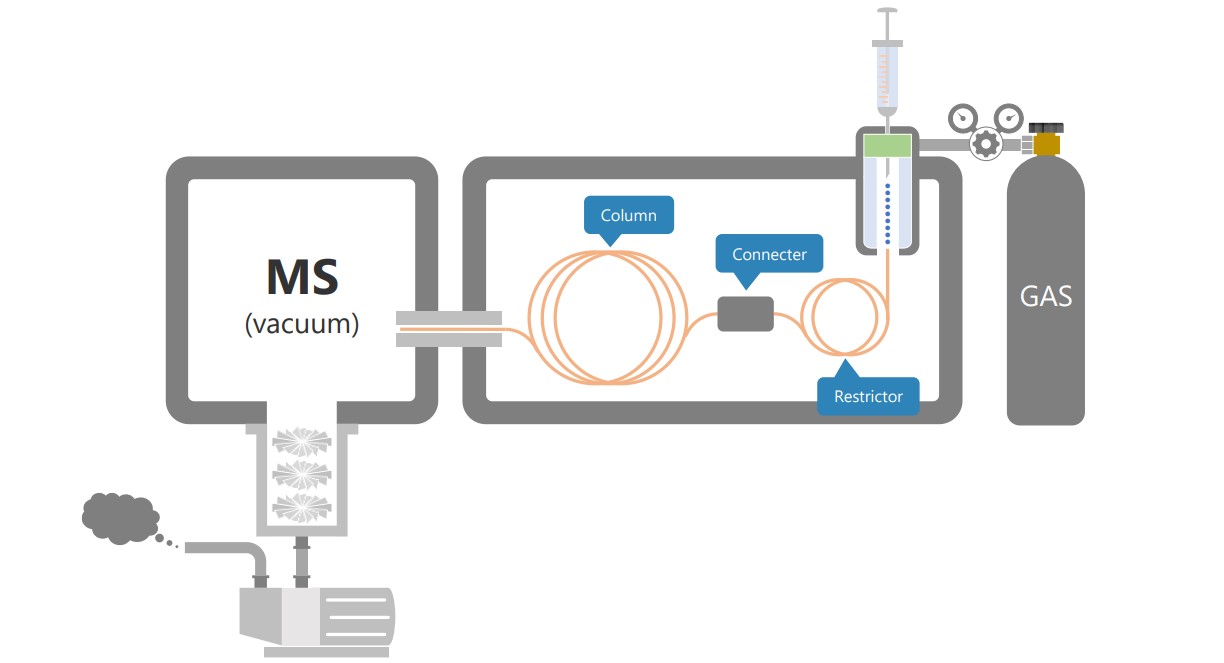
Figure 1. LPGC-MS configuration
1.2. LPGC-MS using nitrogen carrier gas
JMS-Q1600GC UltraQuad™ SQ-Zeta
In this report, we examined a case study of pesticide analysis using the LPGC-MS method with nitrogen carrier gas in the JMS-Q1600GC. As mentioned above, LPGC-MS is a method of increasing the separation performance of a column by improving the diffusion coefficient in response to a decrease in the internal pressure of the column. In general, GC-MS analysis using nitrogen carrier gas improves sensitivity by reducing the flow rate of the carrier gas, so it is thought that LPGC-MS, which improves separation performance by reducing the internal pressure of the column, is highly compatible with this. In addition, LPGC-MS uses columns with a large inner diameter of 0.53mm to 0.32mm, so it is also superior in terms of column loading volume and increasing the injection volume. The purpose of the study was to apply this method to the analysis of pesticides in tap water. The effectiveness of this method for the analysis of pesticides in tap water was evaluated based on performance indicators such as detection sensitivity, calibration curve linearity, and reproducibility.
2.Experiments
A gas chromatograph mass spectrometer, JMS-Q1600GC UltraQuad™ SQ-Zeta, and LPGC Rtx-5ms column kit, 0.32 mm ID (catalog number: 11802, Restek Corporation.) for LPGC-MS were used for the measurement. Table 1 shows the measurement conditions for the samples. The acquisition mode for the MS was set to SIM, and the monitor ions were set to the 134 components listed in Methods 5, 5-2, and 25 of the attached list of target pesticides in the list of target pesticides (Water Quality Management Target Setting Item 15) for agricultural chemicals.
Table 1. Measurement condition
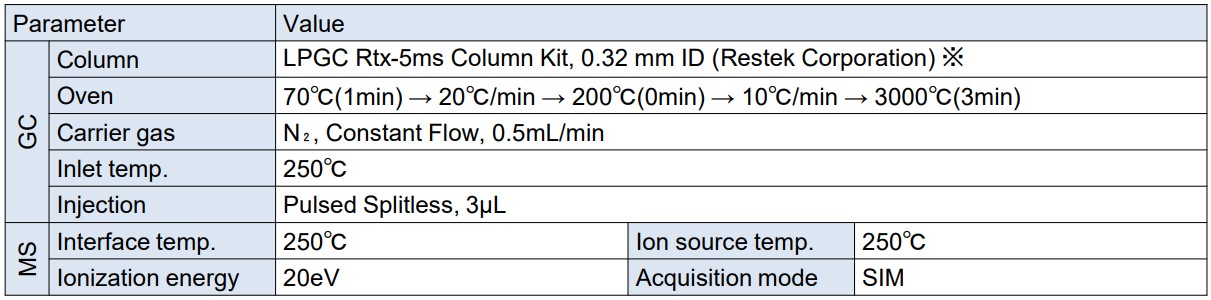
… 10 m x 0.32 mm ID x 1.00 µm Rtx-5ms column and 5 m x 0.15 mm ID restrictor
The retention time checking sample were prepared by mixing the following standard solutions of pesticides: WQ1, WQ2, WQ5, and WQ10 (20 μg/mL each in Acetone solution, FUJIFILM Wako Pure Chemical Corporation), Endosulfan α and β, Prothiofos, Prothiofos oxon, and CNP-amino. To prepare calibration curves and check reproducibility, we diluted a 13-type pesticide mixture standard solution (10 µg/mL each in acetone, FUJIFILM Wako Chemical Corporation) to 1~100μg/L and added the internal standard substances Anthracene-10, 9-Bromoanthracene, and Chrysene-d12 at a concentration of 100 μg/L.
3.Results
3.1. Comparison of TICC and EIC for measuring 134-pesticides.
Figure 2 shows the TICC and EIC of etofenprox when the retention time checking sample was measured using GC-MS under normal conditions. Figure 3 shows the TICC and EIC of etofenprox when the sample was measured using LPGC-MS.
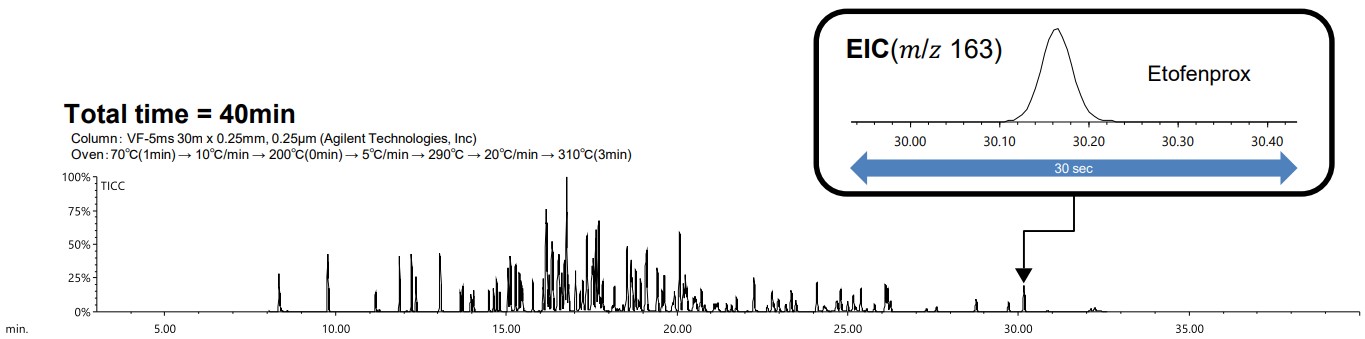
Figure 2. TICC of 134 pesticides measured using the conventional GC-MS with He method and EIC of Etofenprox
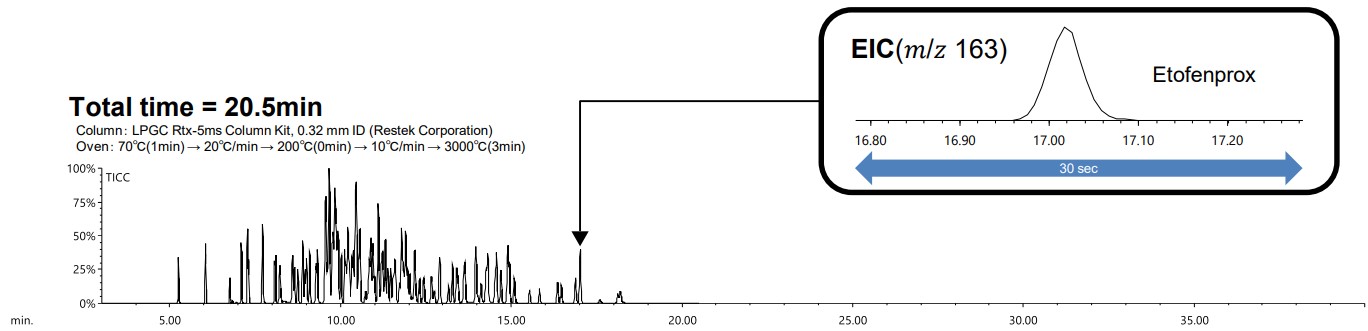
Figure 3. TICC of 134 pesticides measured using the LPGC-MS with N₂ method and EIC of Etofenprox
A comparison of analysis times revealed that a measurement that would normally require over 40 minutes using GC-MS could be completed in approximately 20 minutes using LPGC-MS. Similarly, a comparison of peak widths using EIC for etofenprox demonstrated that the results were comparable between GC-MS and LPGC-MS. It is difficult to separate the eluted peaks using TICC, but it is possible to separate them using the EIC for each pesticide. The results of checking the separation behavior of each pesticide using the EIC around the 10 minute, when the peaks elute the most, are shown in the Figure 4.
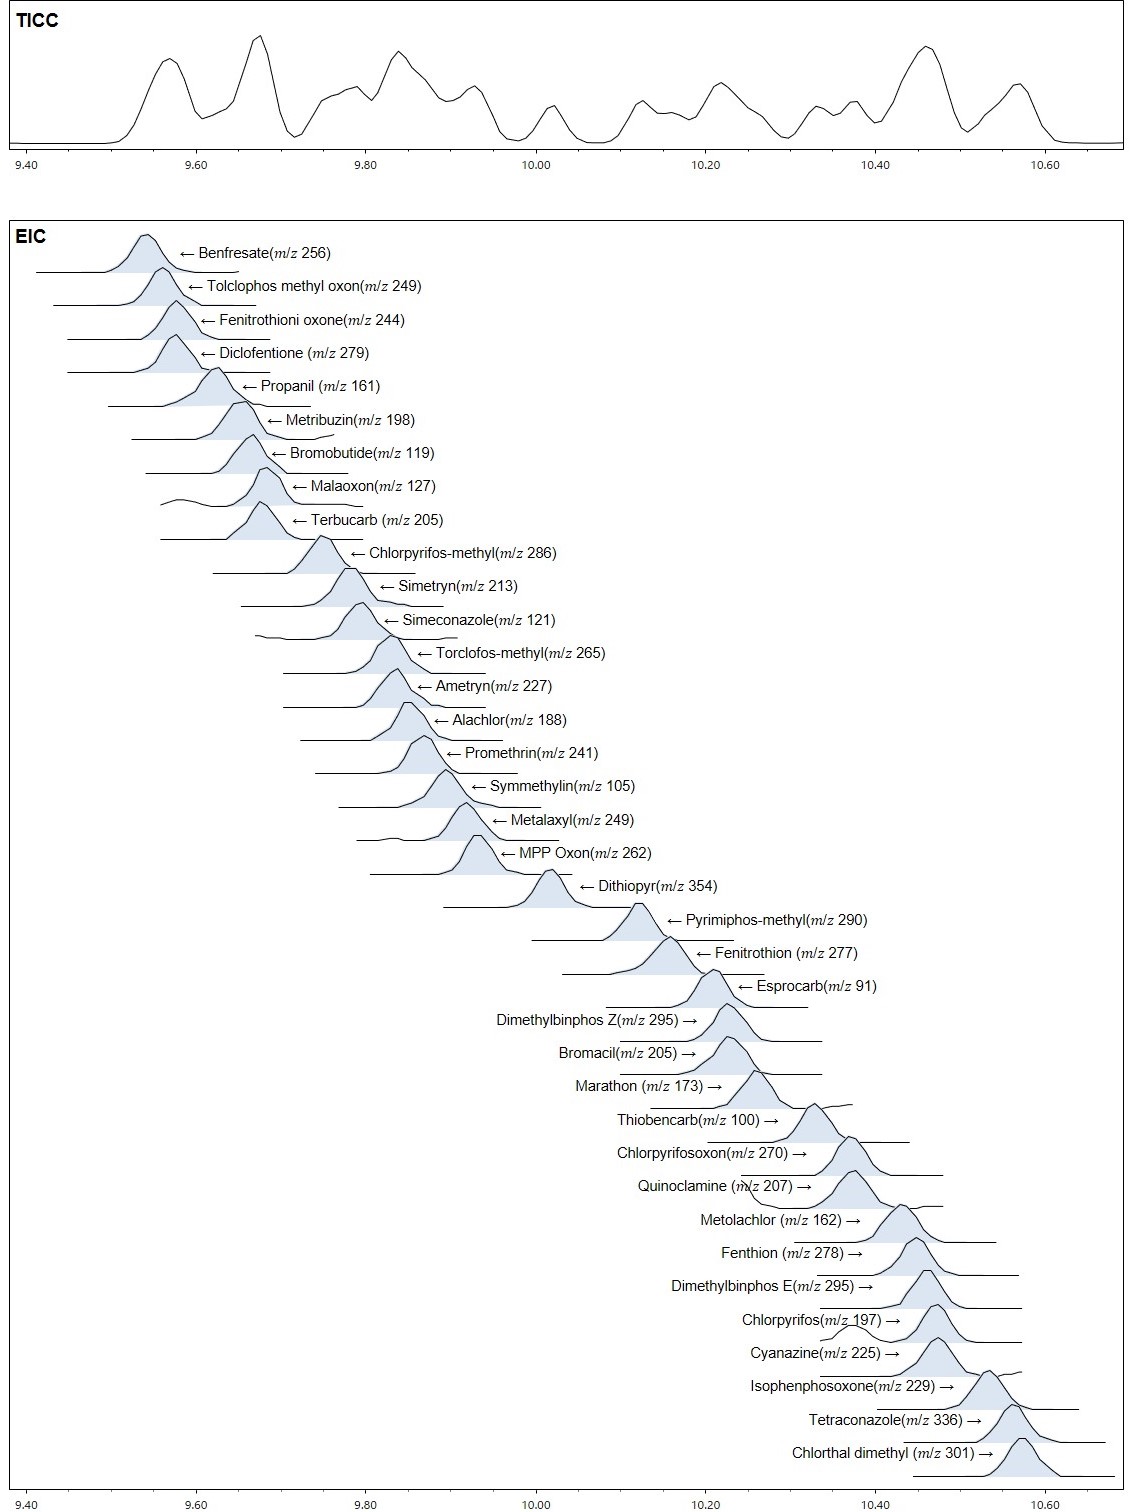
Figure 4. EIC of pesticides that dissolve around 10 minutes
3.2 Calibration curves and reproducibility checks for 13-pesticides
Samples for a calibration curve and checking reproducibility were measured using the LPGC-MS method, and the resulting calibration curve is presented in Figure 5. The correlation coefficient (r) of the calibration curve is 0.99 or higher for all components, indicating good linearity.
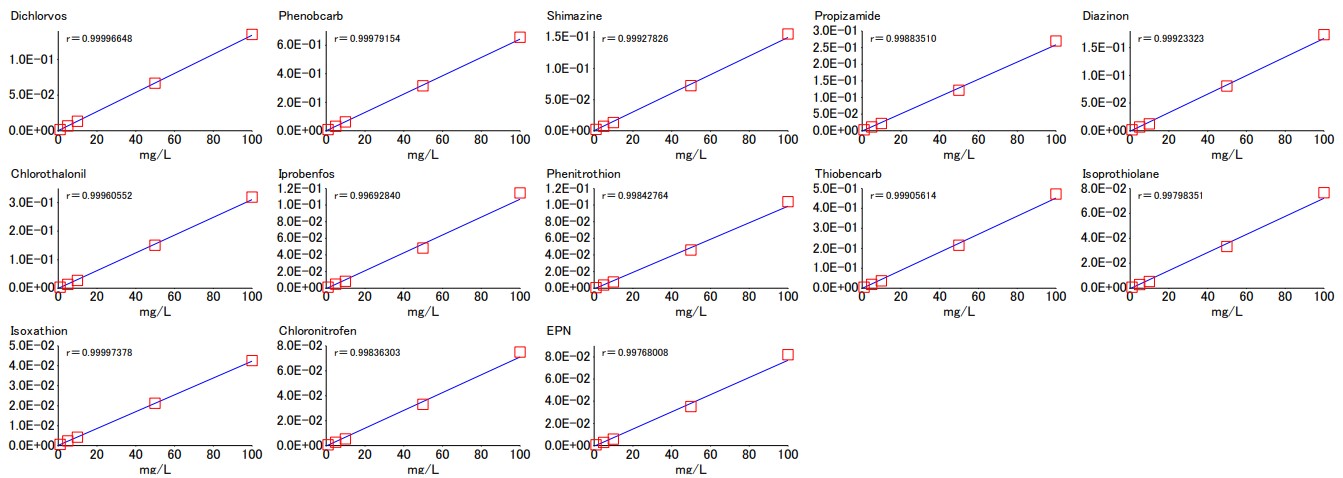
Figure 5. Calibration curves for each of the 13 pesticide components
Table 2 illustrates the coefficient of variation (C.V.) of the quantitative values when the concentration of 10 μg/L was measured continuously with n = 5 trials, among the samples utilized for the calibration curve creation and reproducibility confirmation. Figure 6 depicts the SIM chromatograms of each pesticide for the initial repetition.
Table 2. coefficient of variation for each of the 13 pesticide components
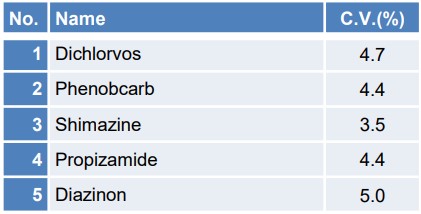
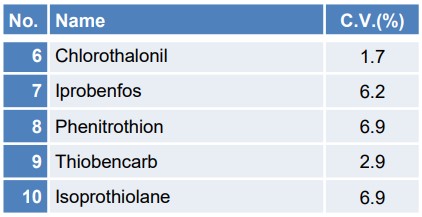
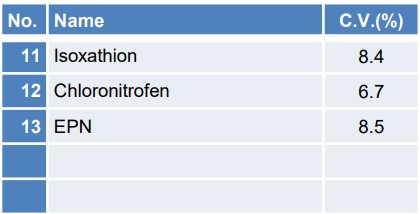
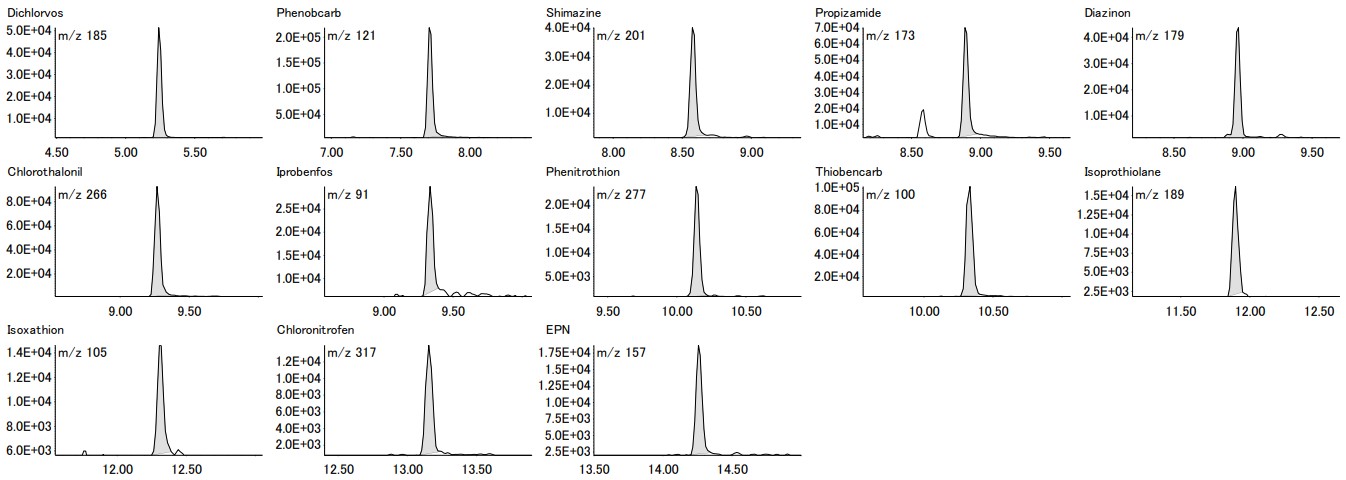
Figure 6. EIC for each of the 13 pesticide components
The coefficient of variation for 10µg/L is 10% or less for all components, indicating good reproducibility. Furthermore, the chromatograms for each pesticide can be detected with sufficient intensity, thereby confirming the reliability of the results.
3.3. Comparison of sensitivity between GC-MS and LPGC-MS under normal conditions
Figure 7 shows the results of comparing the EIC of Chloronitrofen at a concentration of 0.5 µg/L using normal GC-MS and LPGC-MS. Chloronitrofen has the lowest target value of all the pesticides in tap water. Even after pretreatment with a 500-fold concentration in accordance with the notification method, the final concentration of the test solution is extremely low at 0.5 µg/L. Figure 7 clearly shows that the LPGC-MS method with a nitrogen carrier gas can detect a peak for 0.5 μg/L Chloronitrofen, with a signal-to-noise ratio that is comparable to that of the normal GC-MS method with helium.
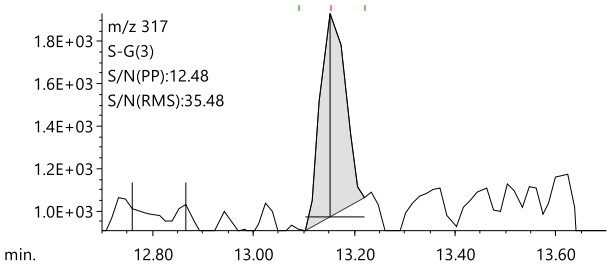
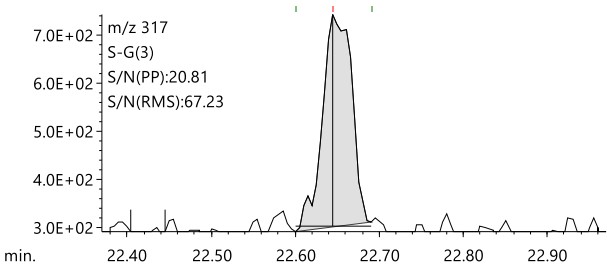
Figure 7. Comparison of EIC for 0.5 μg/L Chloronitrofen measured using the LPGC-MS with N₂(Left) and conventional GC-MS with He(Right)
4.Conclusion
The examination of the analysis of pesticides using the LPGC-MS method with a nitrogen carrier gas for the purpose of application to tap water revealed that the measurement time could be reduced to approximately half that of the normal GC-MS method. A more detailed investigation of the quantitative performance for 13-pesticide components revealed a calibration curve with good linearity, as indicated by a correlation coefficient of 0.99 or higher, within the concentration range of 1 to 100 μg/L. The reproducibility was found to be less than 10% C.V. at a concentration of 10 μg/L. Furthermore, in the case of chlornitrofen, which has the lowest target value of all the pesticides in tap water, a peak was identified at 0.5 μg/L, which is equivalent to the target value based on the concentration factor assumption of the notification method. The sensitivity achieved was approximately equivalent to that of conventional GC-MS with helium. Based on these findings, it can be posited that the LPGC-MS method utilizing a nitrogen carrier gas is adequately equipped to analyze pesticides in tap water.
Solutions by field
Related products
Product category
Are you a medical professional or personnel engaged in medical care?
No
Please be reminded that these pages are not intended to provide the general public with information about the products.