Analysis of multicomponent polyesters using JMS-S3000 “SpiralTOF™-plus3.0” and Kendrick Mass Defect (KMD) analysis
MSTips No. 484
Copolymers are polymers formed by linking multiple types of monomers. Combining different monomers can produce polymers with more diverse physical and chemical properties than homopolymers made of a single monomer. Most polyesters used in industrial materials such as adhesives, paints, and coatings are "multicomponent copolymers." The types of monomers and their mixing ratios affect various performances. In this application note, we introduce the advantages of high-resolution matrix-assisted laser desorption/ionization time-of-flight mass spectrometry (MALDI-TOFMS) in analyzing multicomponent copolymers. MALDI is one of the most common soft ionization methods. Since polymers are mainly ionized as singly charged ions, the m/z in the mass spectrum is the mass of the polymer ion. By using high mass-resolution MALDI-TOFMS, it is easy to distinguish polymer series based on differences in the composition of repeating units and end groups, and it is also possible to calculate the molecular weight distribution of each. Therefore, compared to pyrolysis GC-MS and NMR, which are often used for polymeric material analysis, MALDI-TOFMS is a method that allows copolymers to be directly identified from mass spectra. The Kendrick Mass Defect (KMD) method has made it possible to easily visualize polymer series contained in complex high mass-resolution mass spectra. Here, we introduce examples of analyzing a mixture of two types of binary polyesters and a quaternary polyester.
Sample preparation
The samples used were a mixture of two types of binary copolymer polyesters (A and B) and a quaternary copolymer polyester C. The monomers that make up A, B, and C are shown in Table 1. 2,5-DHB was used as the matrix, and sodium trifluoroacetate (NaTFA) was used as the cationizing agent. Mass spectra were obtained using the SpiralTOF positive ion mode of the JMS-S3000 “SpiralTOF™-plus3.0”. Each mass spectrum was deisotoped and subjected to KMD analysis using msRepeatFinder V8.
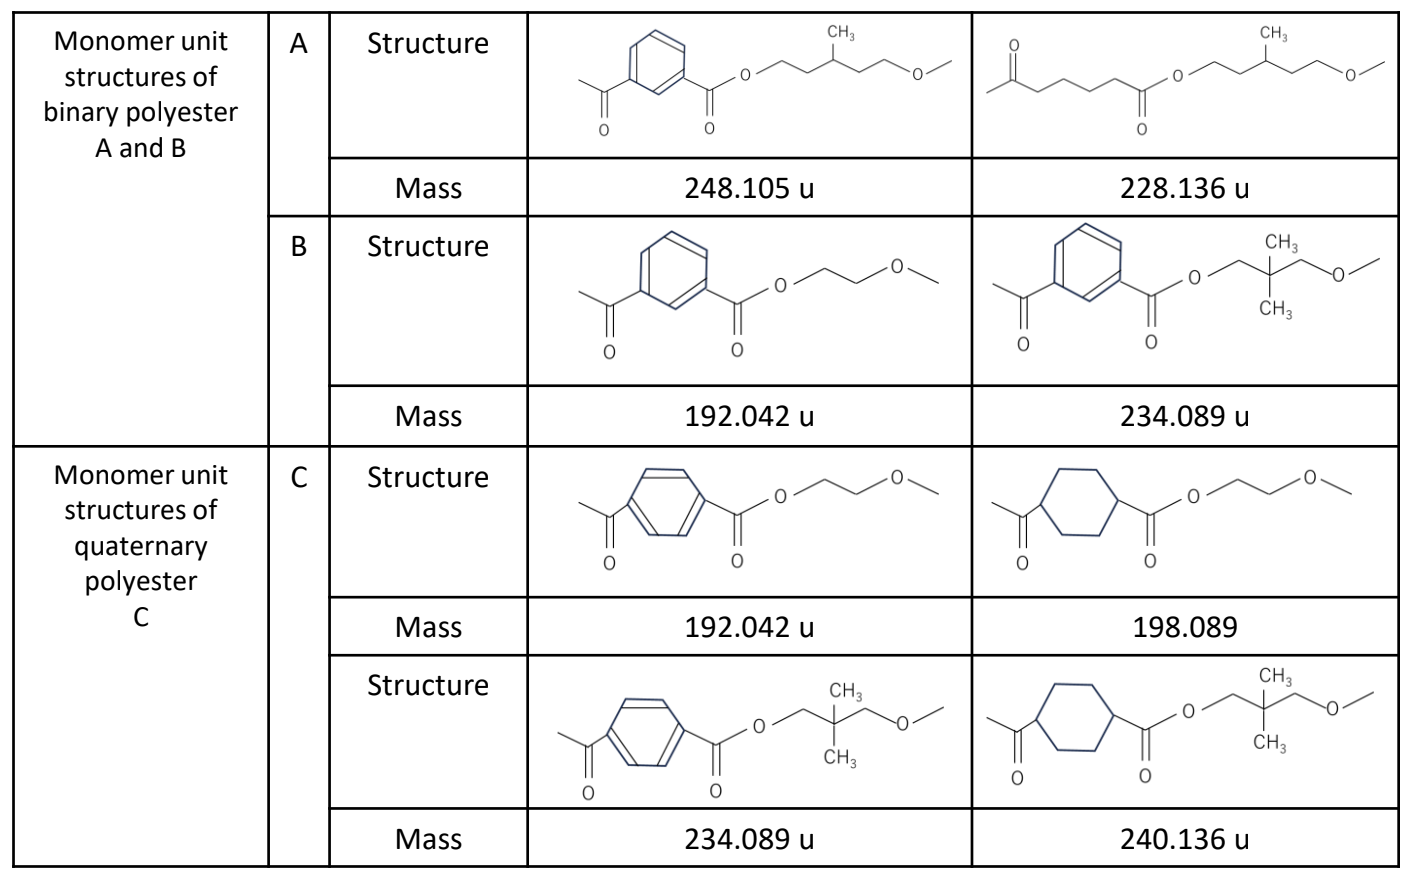
Table 1 Monomer unit structures of binary polyesters A and B, and quaternary polyester C
Analysis of the mixture of two binary polyesters
The mass spectrum of the binary copolymer mixture is shown in Figure 1. The binary polyester A (monomer mass 248u, 228u) was mainly confirmed from the peak intervals. Next, the deisotoped peak list was made from the mass spectrum and subjected to KMD analysis. It is known that binary copolymers can be confirmed as a lattice pattern on the KMD plot. The peak list and KMD plot (base unit: 248.105 u) are shown in Figure 2. The blue circles indicate the polymer series observed as the main component in the mass spectrum. Next, the binary copolymer series of green and red were confirmed as minor components. The green series is parallel to the blue series of the main component and is presumed to have the same main chain structure as binary polyester A but with different end groups. On the other hand, the red series is a binary copolymer composed of different monomers from the blue series. By examining the peak intervals, it was confirmed to be binary polyester B. The advantage of KMD analysis is that it can easily distinguish the patterns of minor copolymer components that are difficult to distinguish from mass spectra.
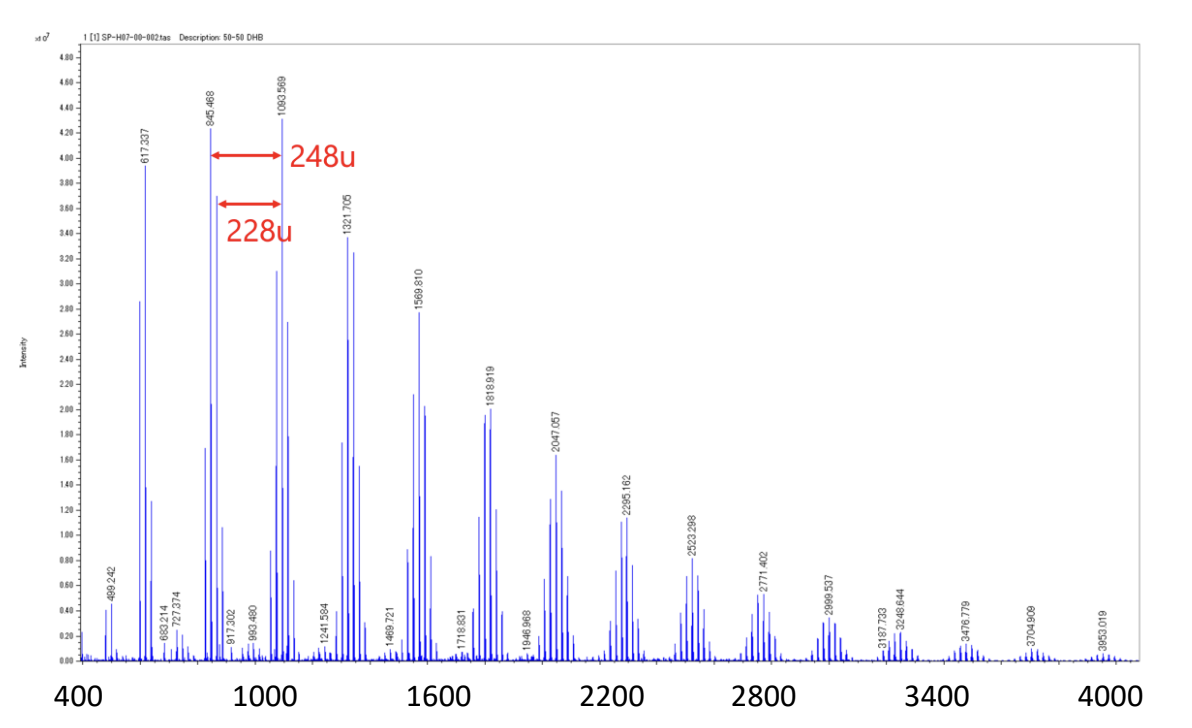
Figure 1 Mass spectrum of the mixture of binary polyesters A and B.
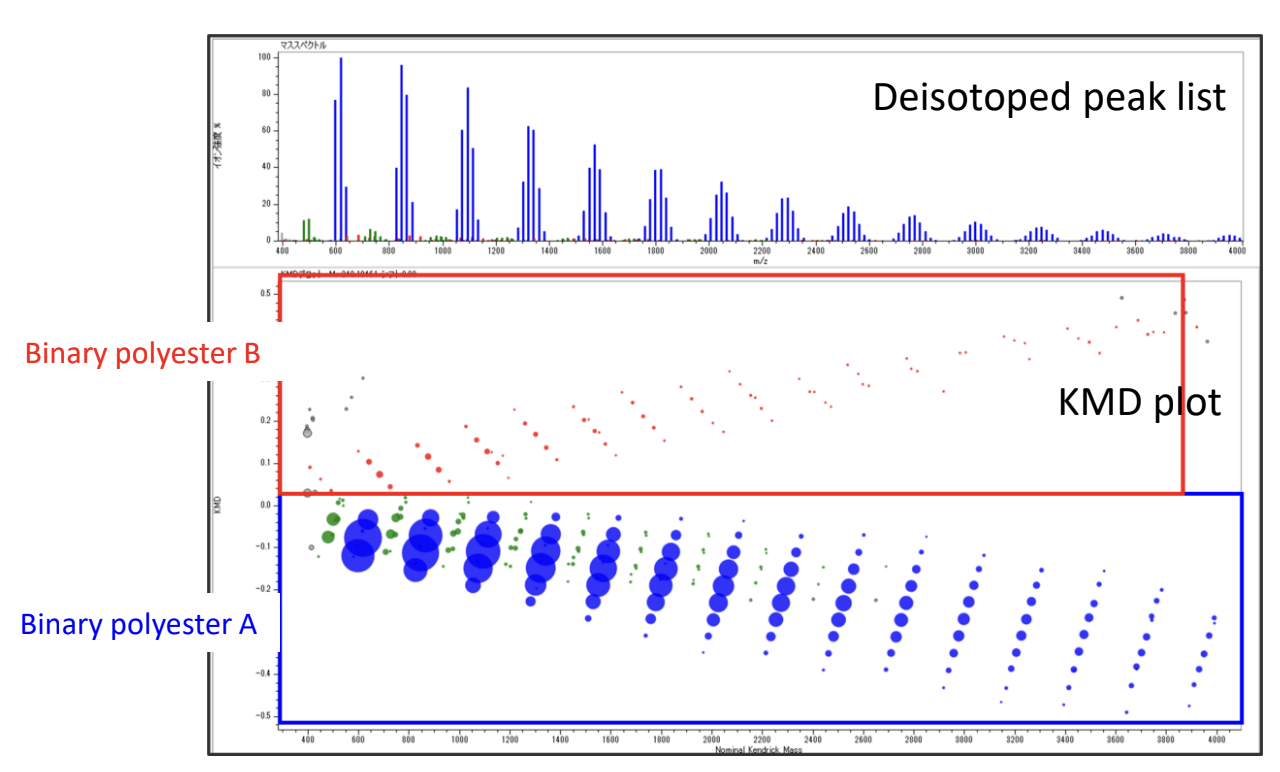
Figure 2 Deisotoped peak list and KMD plot (base unit 248.105 u) of the mixture of binary polyesters A and B.
Analysis of quaternary polyesters
The mass spectrum of quaternary copolymer polyester C is shown in Figure 3. The mass spectrum obtained was more complex than that of the binary copolymer polyesters mixture. Next, the deisotoped peak list was made from the mass spectrum and subjected to KMD analysis. (Figure 4). A complex pattern consisting of several overlapping lattice patterns was observed in the area enclosed by the red rectangle. The area in the green rectangle was enlarged. Each of the four arrows shown on the right side of Figure 4 indicates the direction and distance that a point on the KMD plot move when one of the four monomer units shown in Table 1 is added. When a certain point was taken as the starting point of the arrows, there were points at the ends of all four arrows, confirming that polyester C was a quaternary polyester. Another advantage of KMD analysis is that it can confirm whether specific monomers are included in such a complex copolymer.
Conclusion
As described above, combining high-resolution MALDI-TOFMS and KMD analysis is useful for analyzing copolymers. In the analysis of binary copolymers, the KMD plots are relatively simple, and analysis is possible even with little information on the monomer units. On the other hand, in analyzing quaternary copolymers, the combinations of peak intervals become complicated, so prior information on the monomer units is considered necessary.
Acknowledgement
For the analysis of multicomponent copolymers, artience Co., Ltd. kindly provided us with samples and collaborated to develop analytical methods.
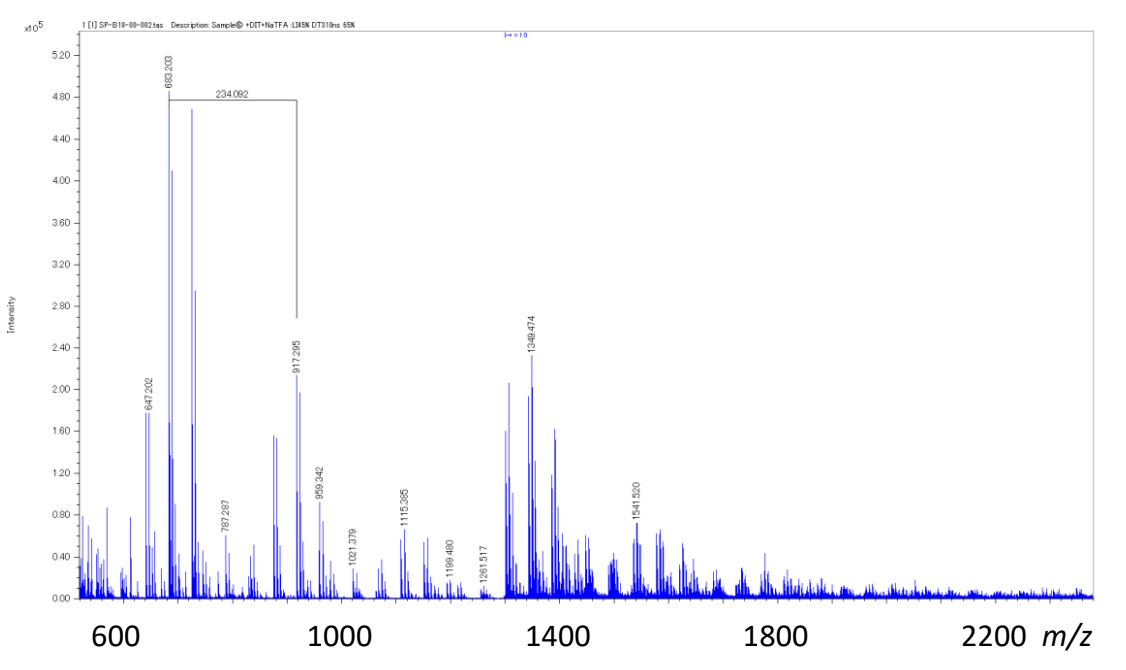
Figure 3 Mass spectrum of the quaternary polyester C.
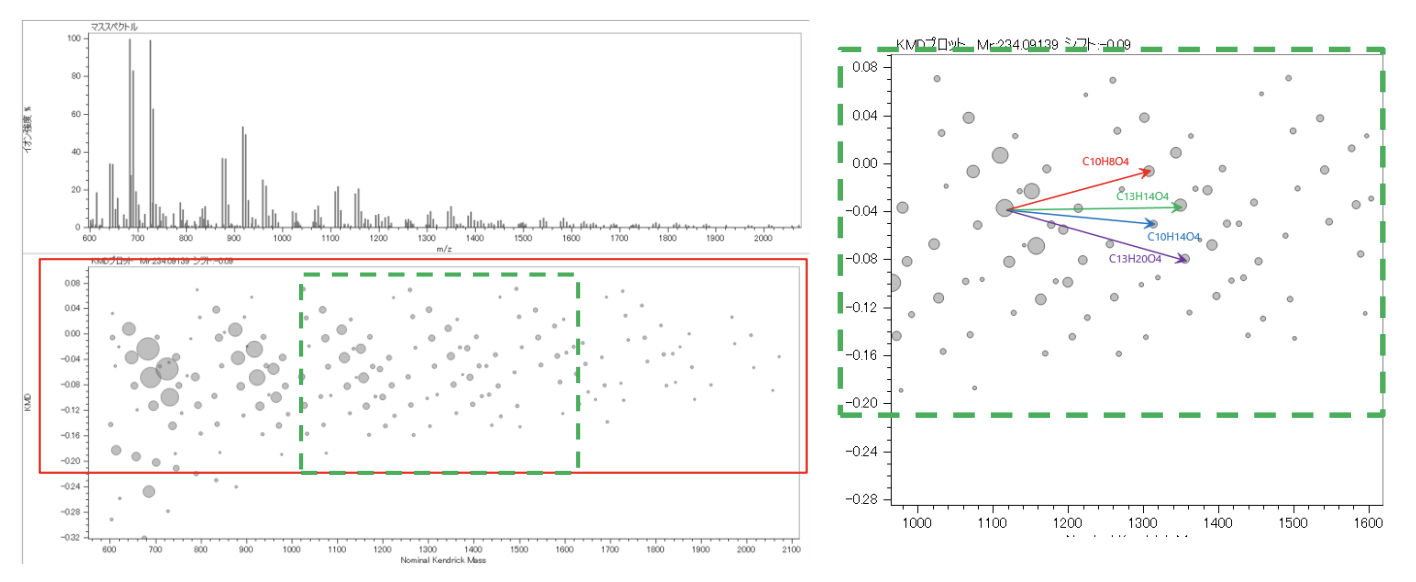
Figure 4 Deisotoped peak list and KMD plot (base unit 248.105 u) of the quaternary polyester C.
Solutions by field
Related products
Product category
Are you a medical professional or personnel engaged in medical care?
No
Please be reminded that these pages are not intended to provide the general public with information about the products.