Analysis of volatile organic compounds inside a vehicle using thermal desorption-GC-MS
MSTips No. 435
Introduction
Thermal desorption (TD) is a GC pretreatment device for introducing gas samples such as atmospheric air and indoor air. It can also be used for gases generated from solid or liquid samples. Figure 1 shows an overview of TD operation. ① Sampling: Using a pump, etc., the gas sample is passed through and collected in a sample tube containing an adsorbent. ②Tube desorption: The sample tube is heated in the TD device, and the desorbed gas is collected in a cooled focusing trap. ③ Trap desorption: The focusing trap is heated at high speed and the desorbed gas is introduced into the GC in a narrow band width. These two steps of thermal desorption make it possible to obtain high sensitivity and sharp chromatogram peaks.
In this MSTips, we introduce the analysis of volatile organic compounds (VOCs) inside a vehicle, which is one of the main applications of TD-GC-MS. TD-100xr (Markes International Ltd) and JMS-Q1600GC (JEOL) were used in the experiment. The analysis conditions were based on the international standards ISO 12219-1 and JASO Z125.
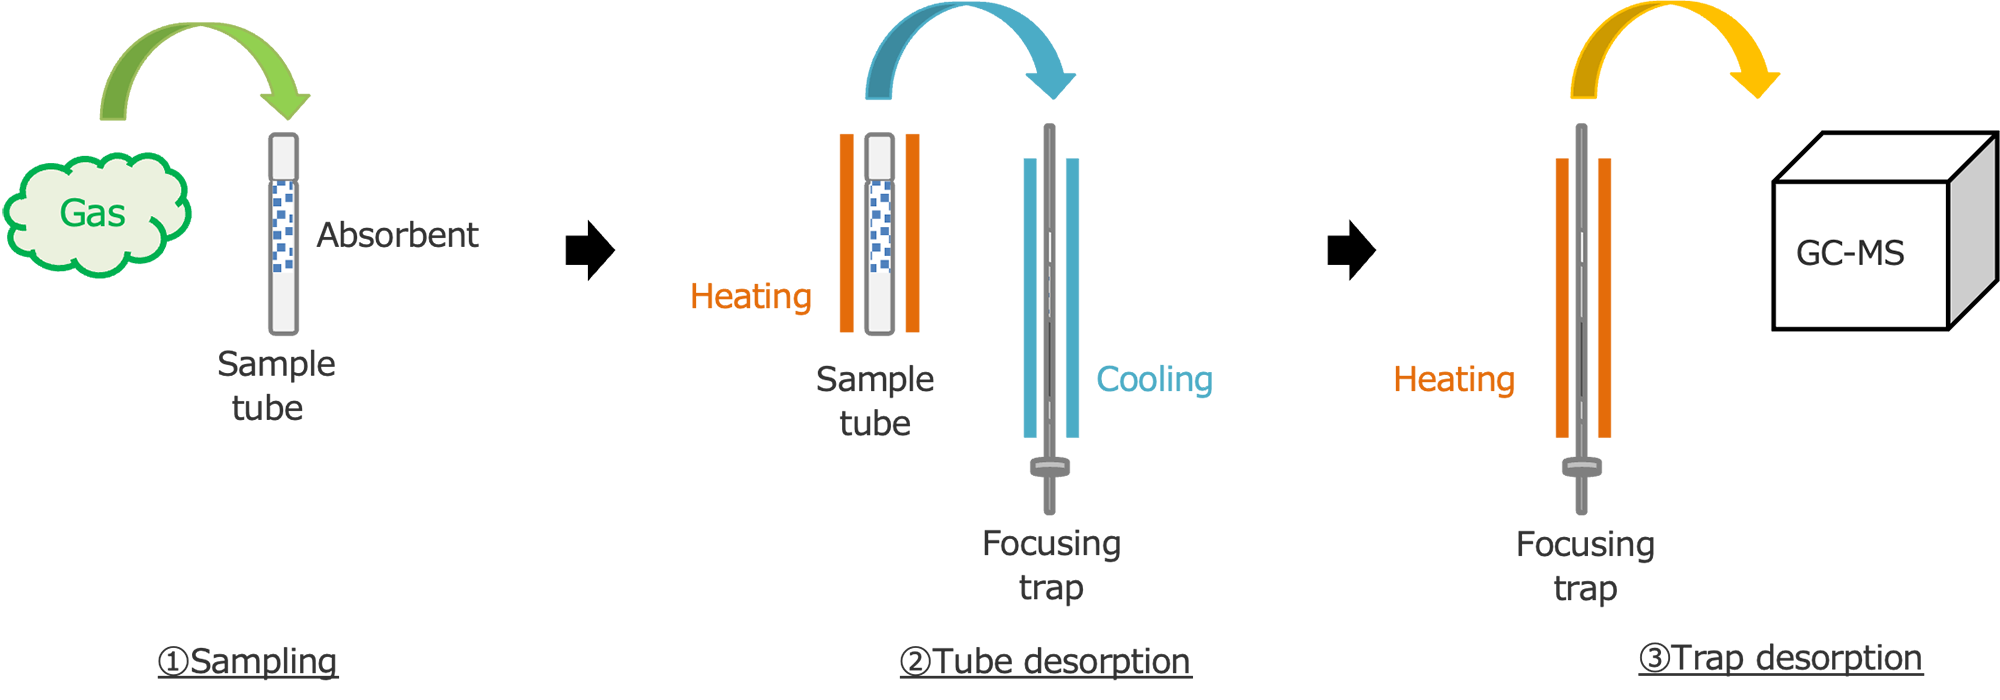
Figure 1 Overview of TD operation
Features of TD-100xr
DiffLok cap: No need to remove from sample tube during measurement
Electronically cooled focusing trap: Cools down to -30 °C without refrigerant
Sample recollection: Collect the split flow during trap desorption and reuse the sample
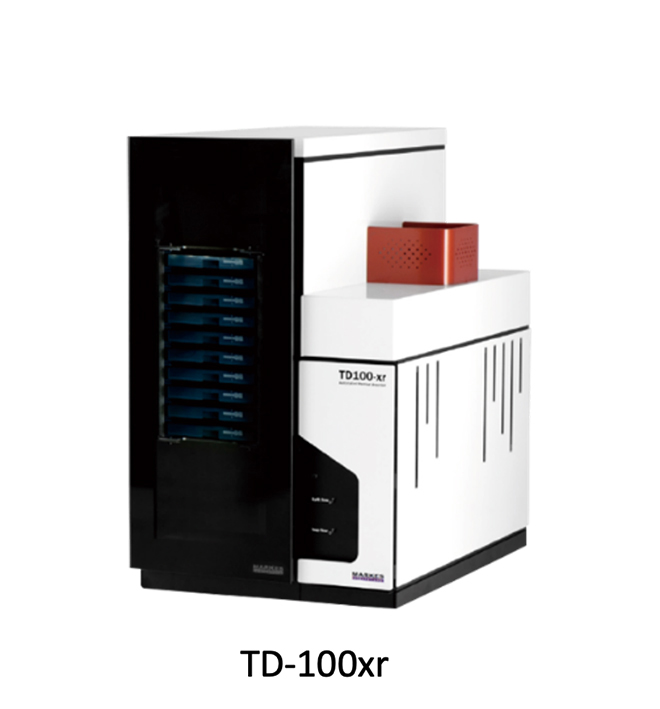
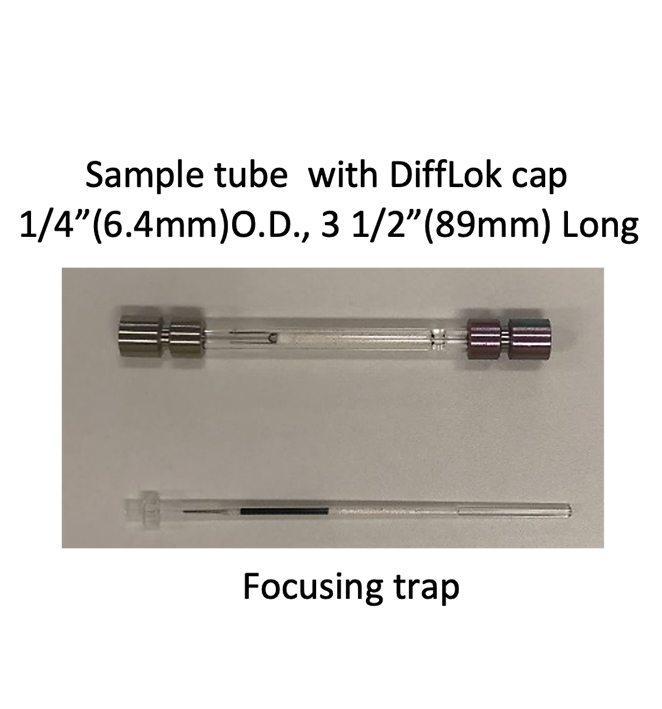
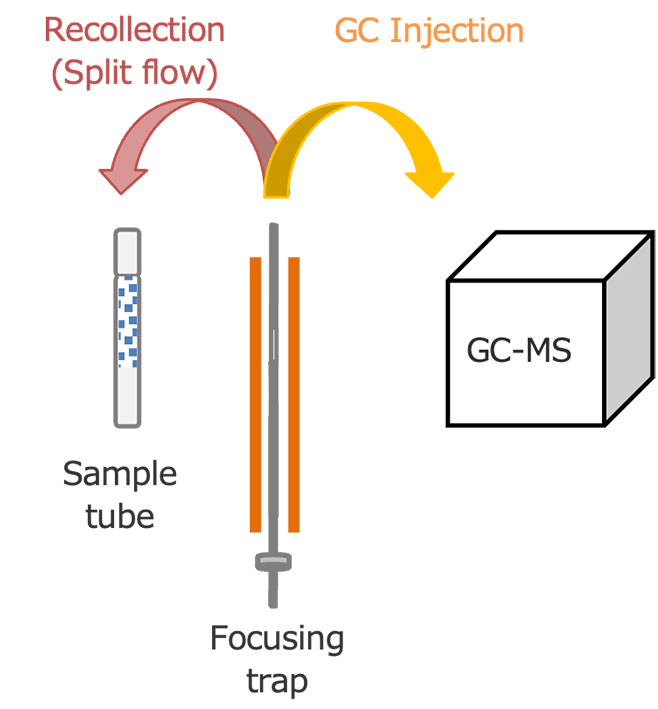
Figure 2 Features of TD-100xr
Target component
We measured 7 components of VOCs which have guideline values of concentration inside a vehicle and are specified TD-GC-MS as the measurement method. We also measured three components which are under additional consideration. Table 1 shows the guideline values of concentration established by the Ministry of Health, Labor and Welfare.
Table 1 Guideline values of concentration ( Left : current 7 components, Right : additional 3 components)
| Name | Concentration (μg/m3) |
|---|---|
| Toluene | 260 |
| Xylene | 200 |
| Ethylbenzene | 3800 |
| Styrene | 220 |
| Tetradecane | 330 |
| Dibutyl phthalate : DBP | 17 |
| Bis (2-ethylhexyl) phthalate) : DEHP | 100 |
| Name | Concentration (μg/m3) |
|---|---|
| 2-Ethyl-1-hexanol | 130 |
| Texanol | 240 |
| 2,2,4-Trimethyl-1,3-pentanediol diisobutyrate : TXIB |
100 |
Experiment
For the current 7 components, 1, 10, and 100 ng of mixed standard solutions were added to sample tubes. For the additional 3 components, 50 ng of the mixed standard solution was added to the sample tube. The sampling volume of 3L described in ISO12219-1 corresponds to concentrations of 0.3, 3, 30 μg/m3 and 15 μg/m3. Additionally, 47 ng of Toluene-d8 was added to the sample tube as an internal standard. By using a special tool when adding these standard solutions, it is possible to easily collect the entire amount (Figure 3). Table 2 shows the measurement conditions of TD-GC-MS. In this measurement, we measured the current 7 components and additional 3 components separately, but these can also be measured simultaneously.
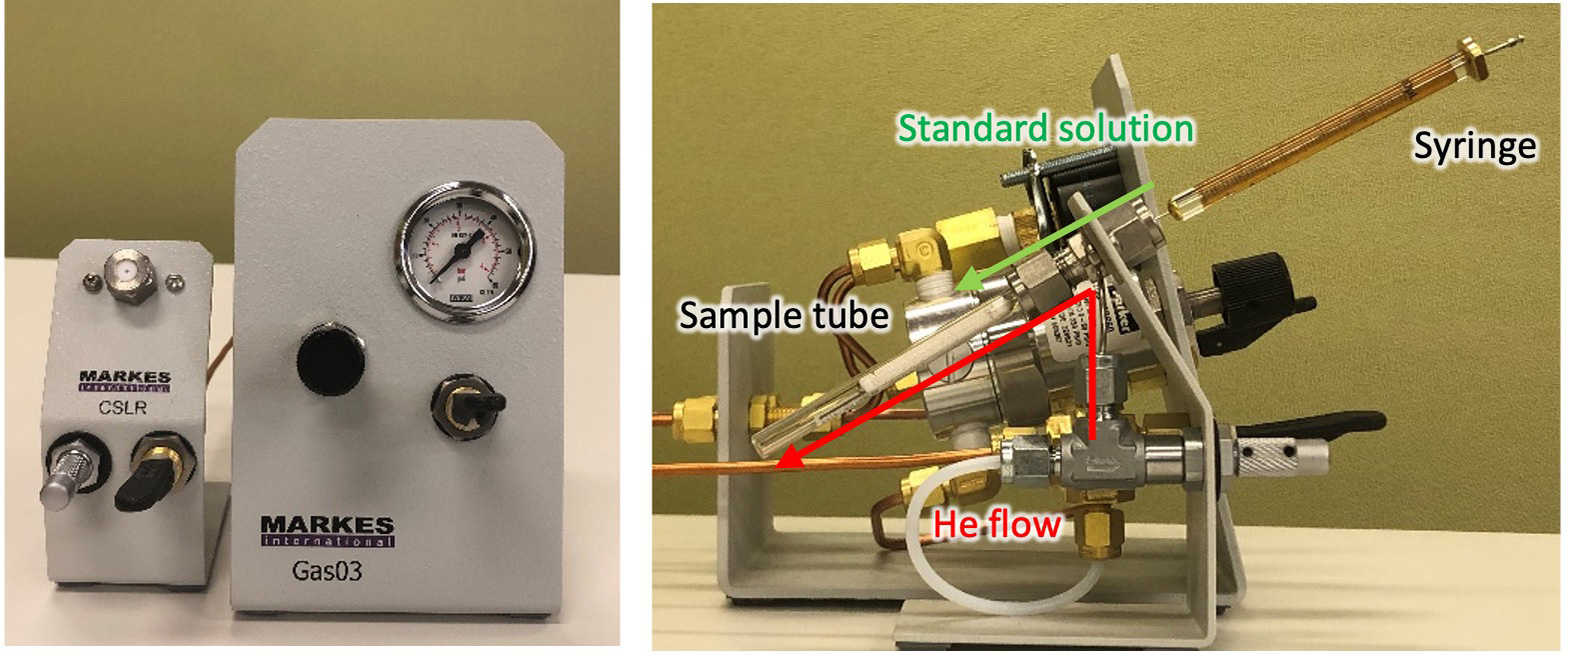
Figure 3 Solution loading tool
Table 2 Measurement conditions
| TD conditions | |
|---|---|
| Thermal Desorption | TD-100xr (Markes International Ltd) |
| Sample tube type | Tenax TA |
| Tube desorption | 280°C (10 min), 30 mL/min, Splitless |
| Focusing trap type | General purpose Hydrophobic (T2) |
| Trap cooling | 0°C |
| Trap desorption | 280°C (3 min), 2 0mL/min, Split 20:1 |
| Flow path temperature | 200°C |
| GC conditions | |
|---|---|
| Gas Chromatograph | 8890A GC (Agilent Technologies) |
| Column | ZB-5MSi (Phenomenex) 30 m x 0.25 mm, 0.25 μm |
| Oven Temperature | 40°C (2 min)-15°C/min -320°C (10 min) |
| Carrier flow | He, 1.0 mL/min |
| MS conditions | |
|---|---|
| Spectrometer | JMS-Q1600GC (JEOL Ltd.) |
| Ionization | EI+:70 eV, 50 μA |
| Ion source temperature | 250°C |
| Mass range | Scan, m/z 45-500 |
Measurement results of current 7 components
Figure 4 shows the TIC chromatogram at 100 ng/tube. Since xylene has 3 isomers as 2 peaks, the total number of peaks is 8.
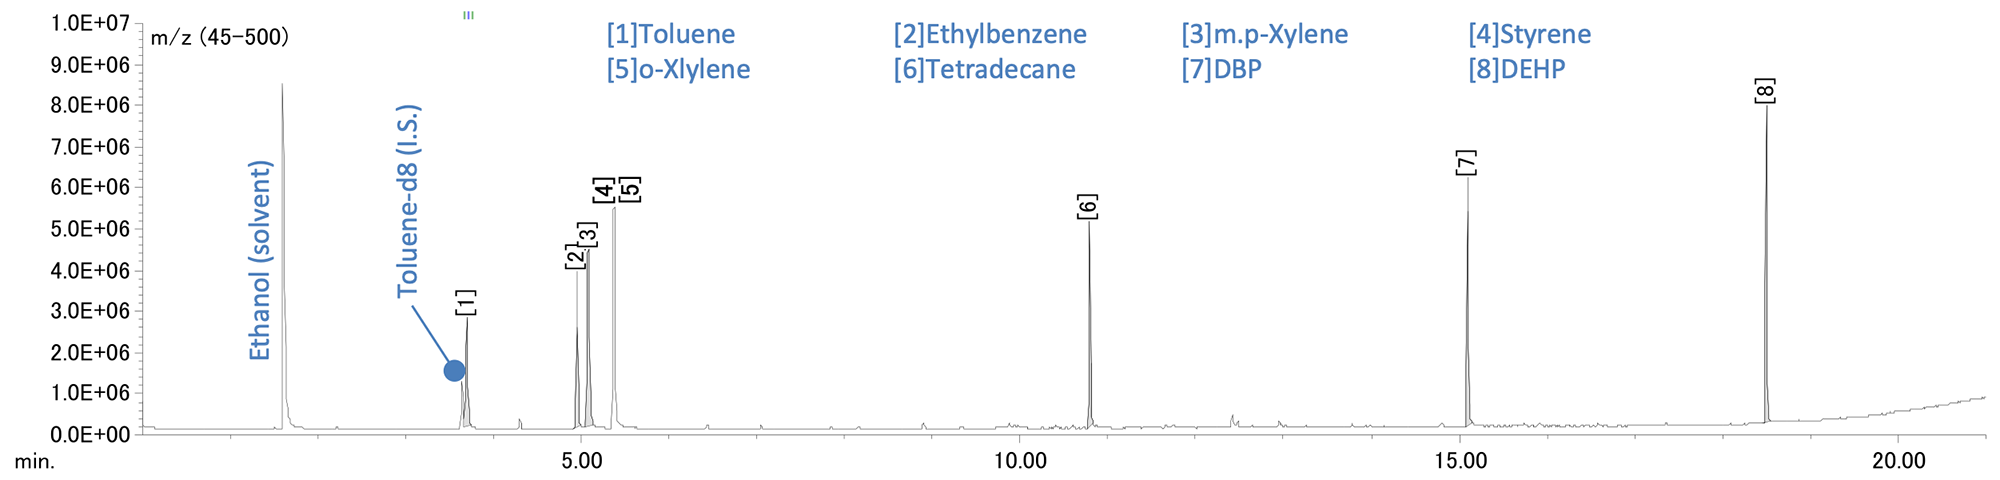
Figure 4 TIC chromatogram of 100 ng/tube
Figure 5 shows the extracted ion chromatograms (EICs) and calibration curves of DBP (m/z 149) and DEHP (m/z 149). Good peak shapes and S/N sensitivity were obtained for all components at the lowest concentration. The determination coefficients of the calibration curve were 0.999 or higher, indicating good linearity.
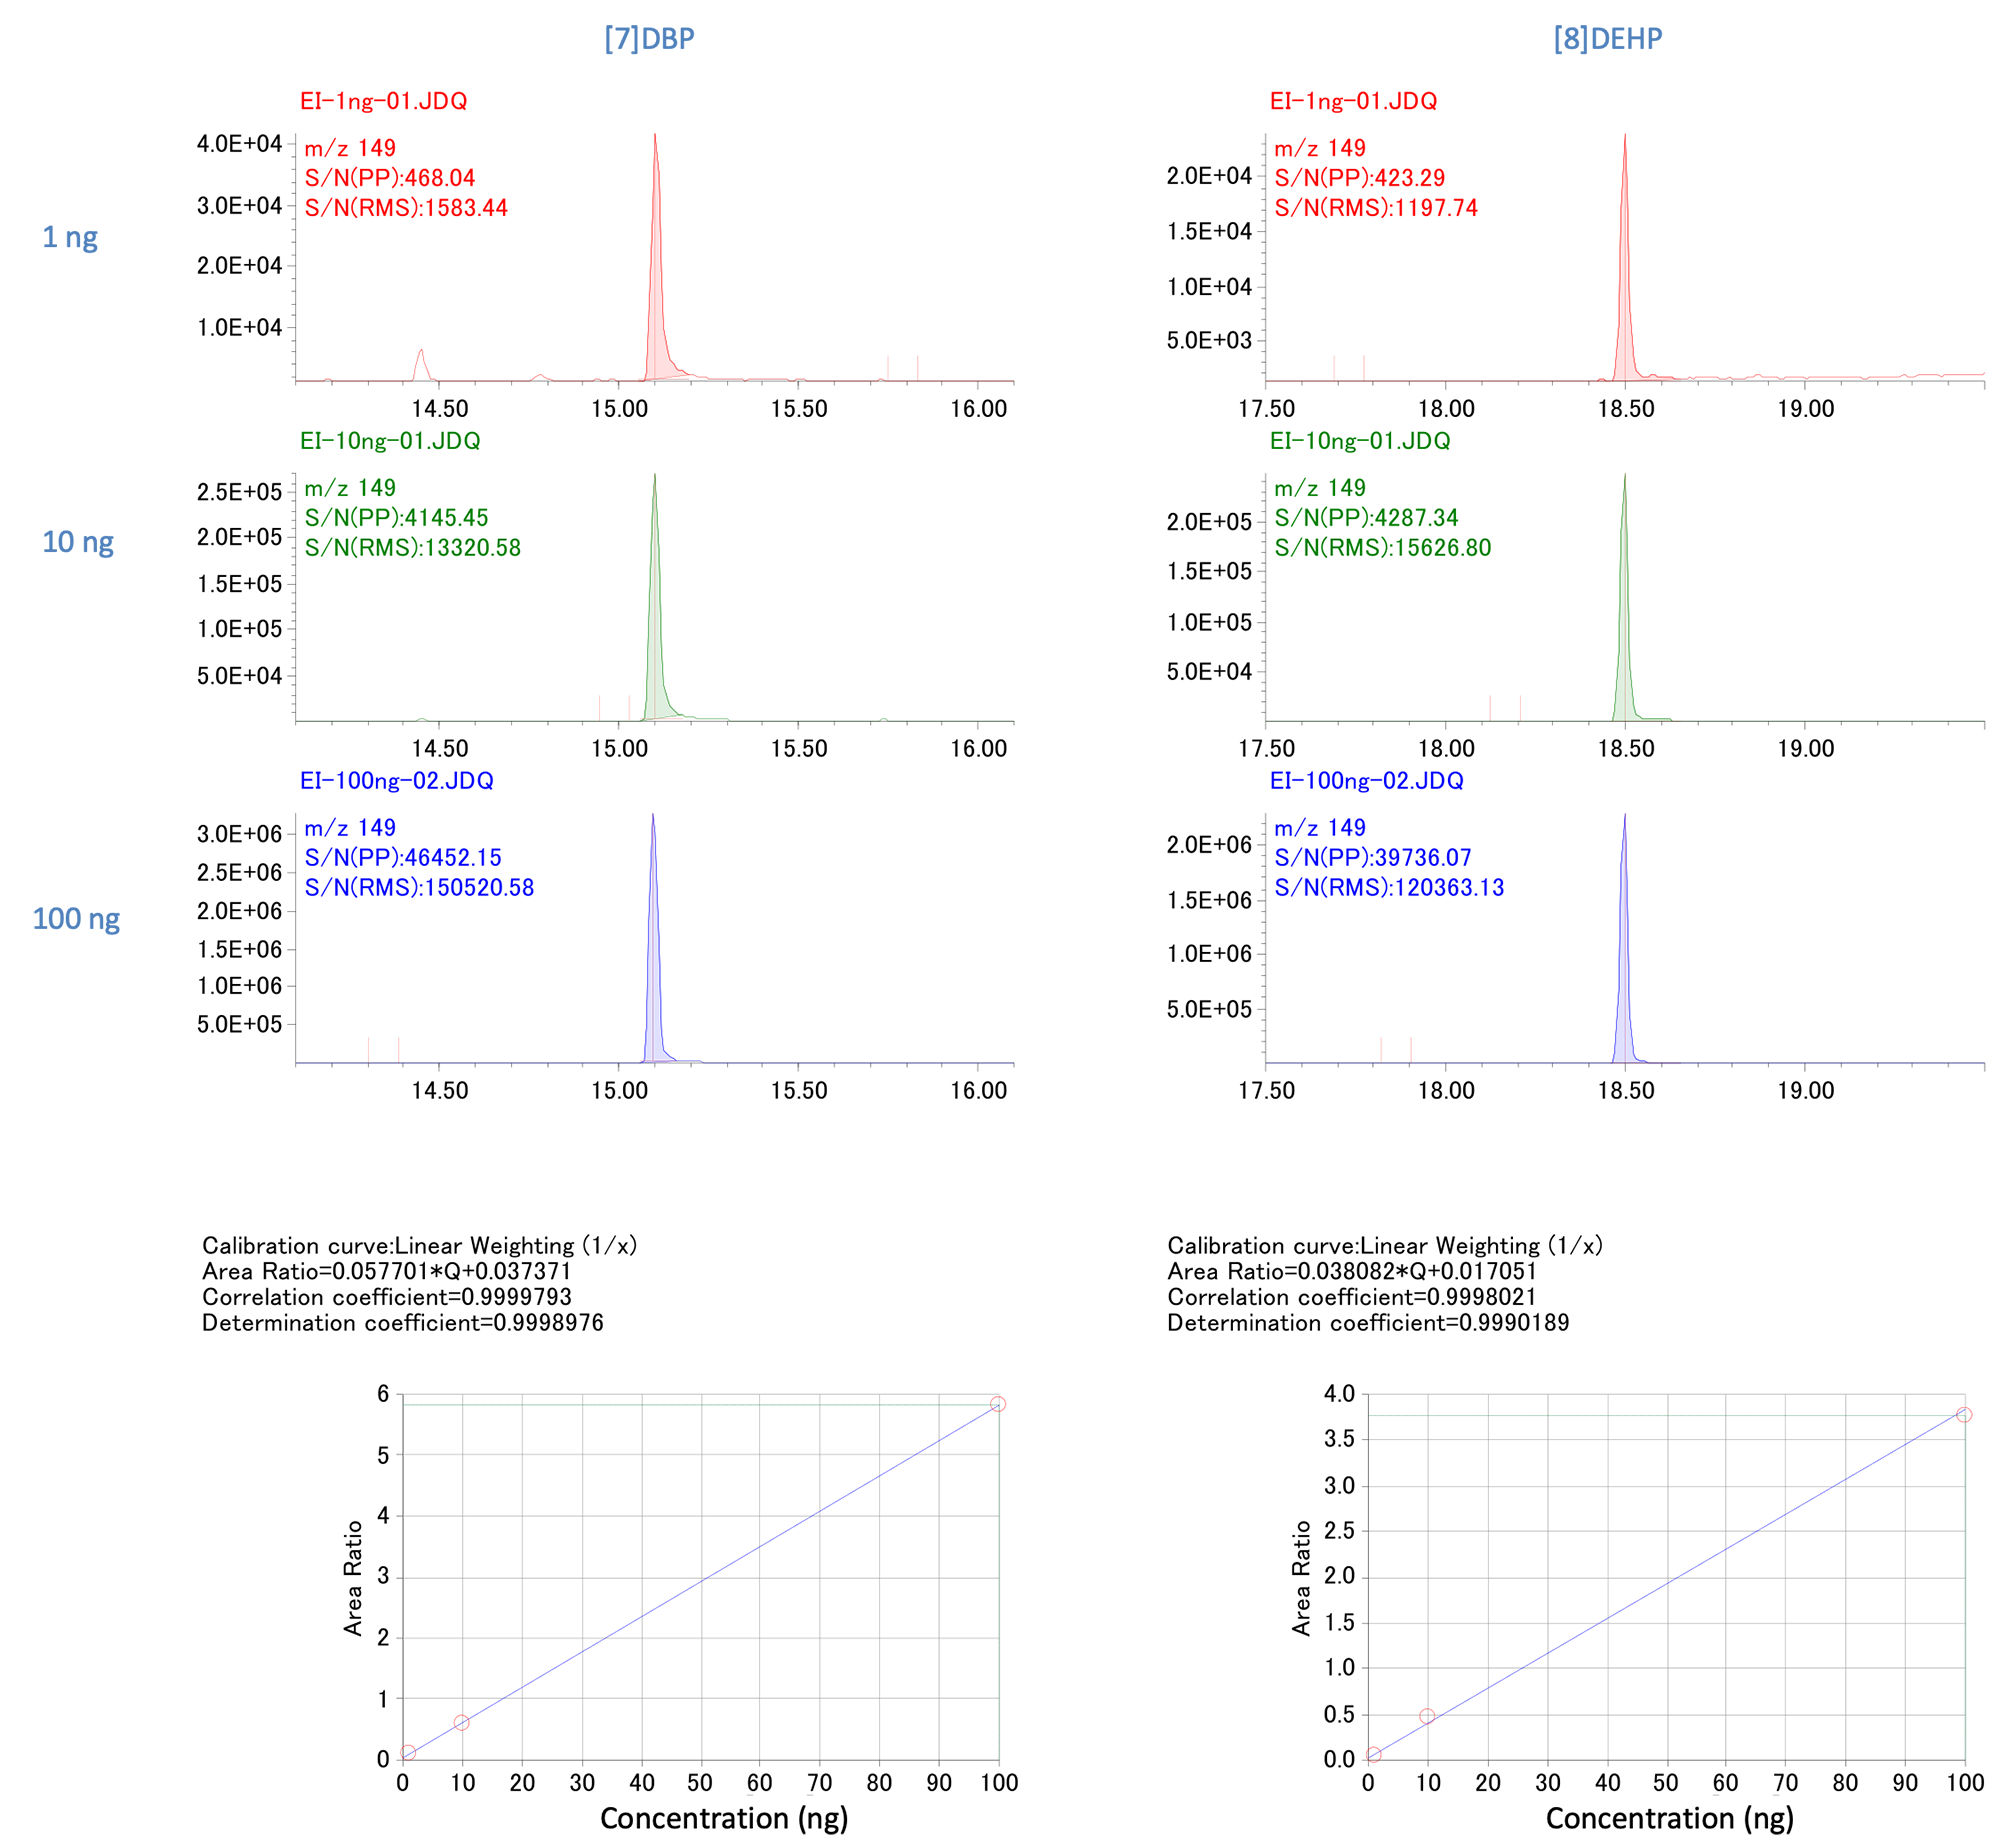
Figure 5 EICs chromatograms and calibration curves (Left : DBP, Right : DEHP)
Measurement results of additional 3 components
Figure 6 shows the TIC chromatogram of 50 ng/tube. Texanol has two isomers as two peaks, the total number of peaks is four.
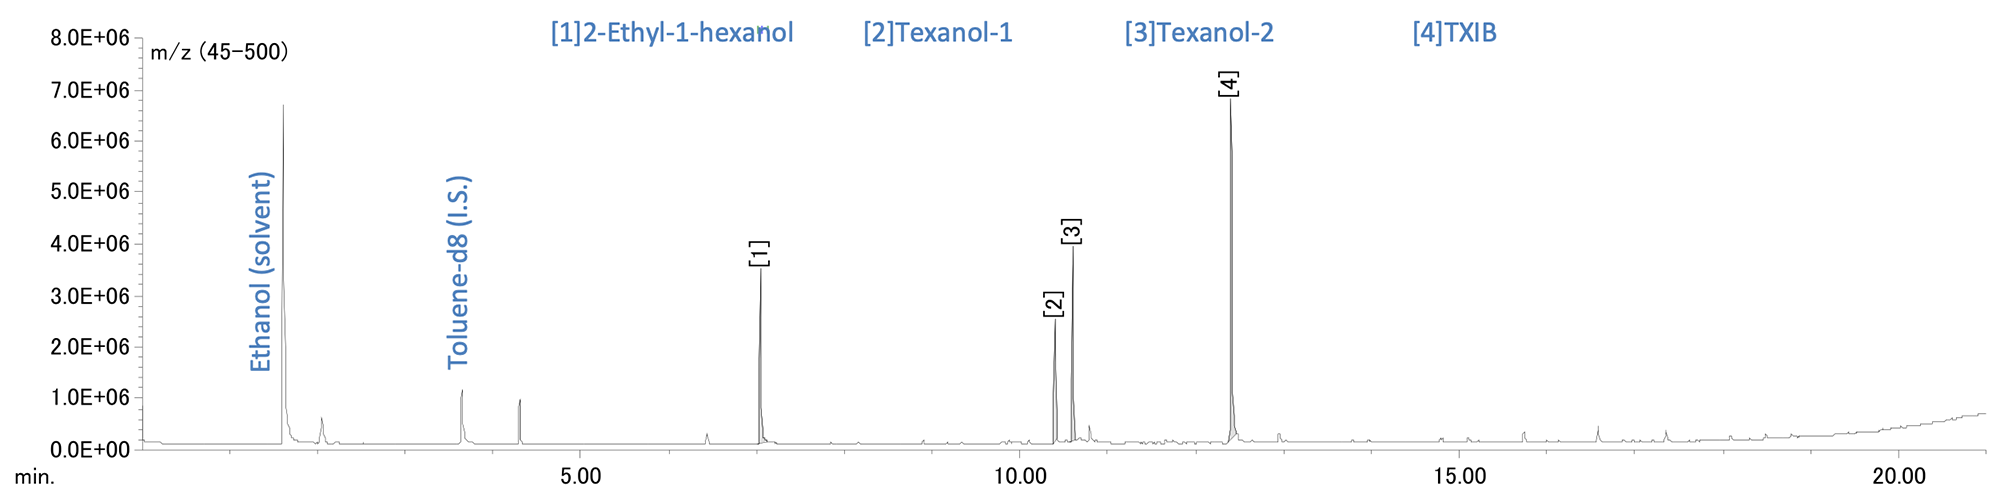
Figure 6 TIC chromatogram of 50 ng/tube
Figure 7 shows the extracted ion chromatograms (EICs) and mass spectra of each component. Good peak shapes and S/N sensitivity were obtained for all components. *Actually, Texanol-1 and Texanol-2 have different structures, but only one structure was registered in the library database, and both peaks matched that structure.
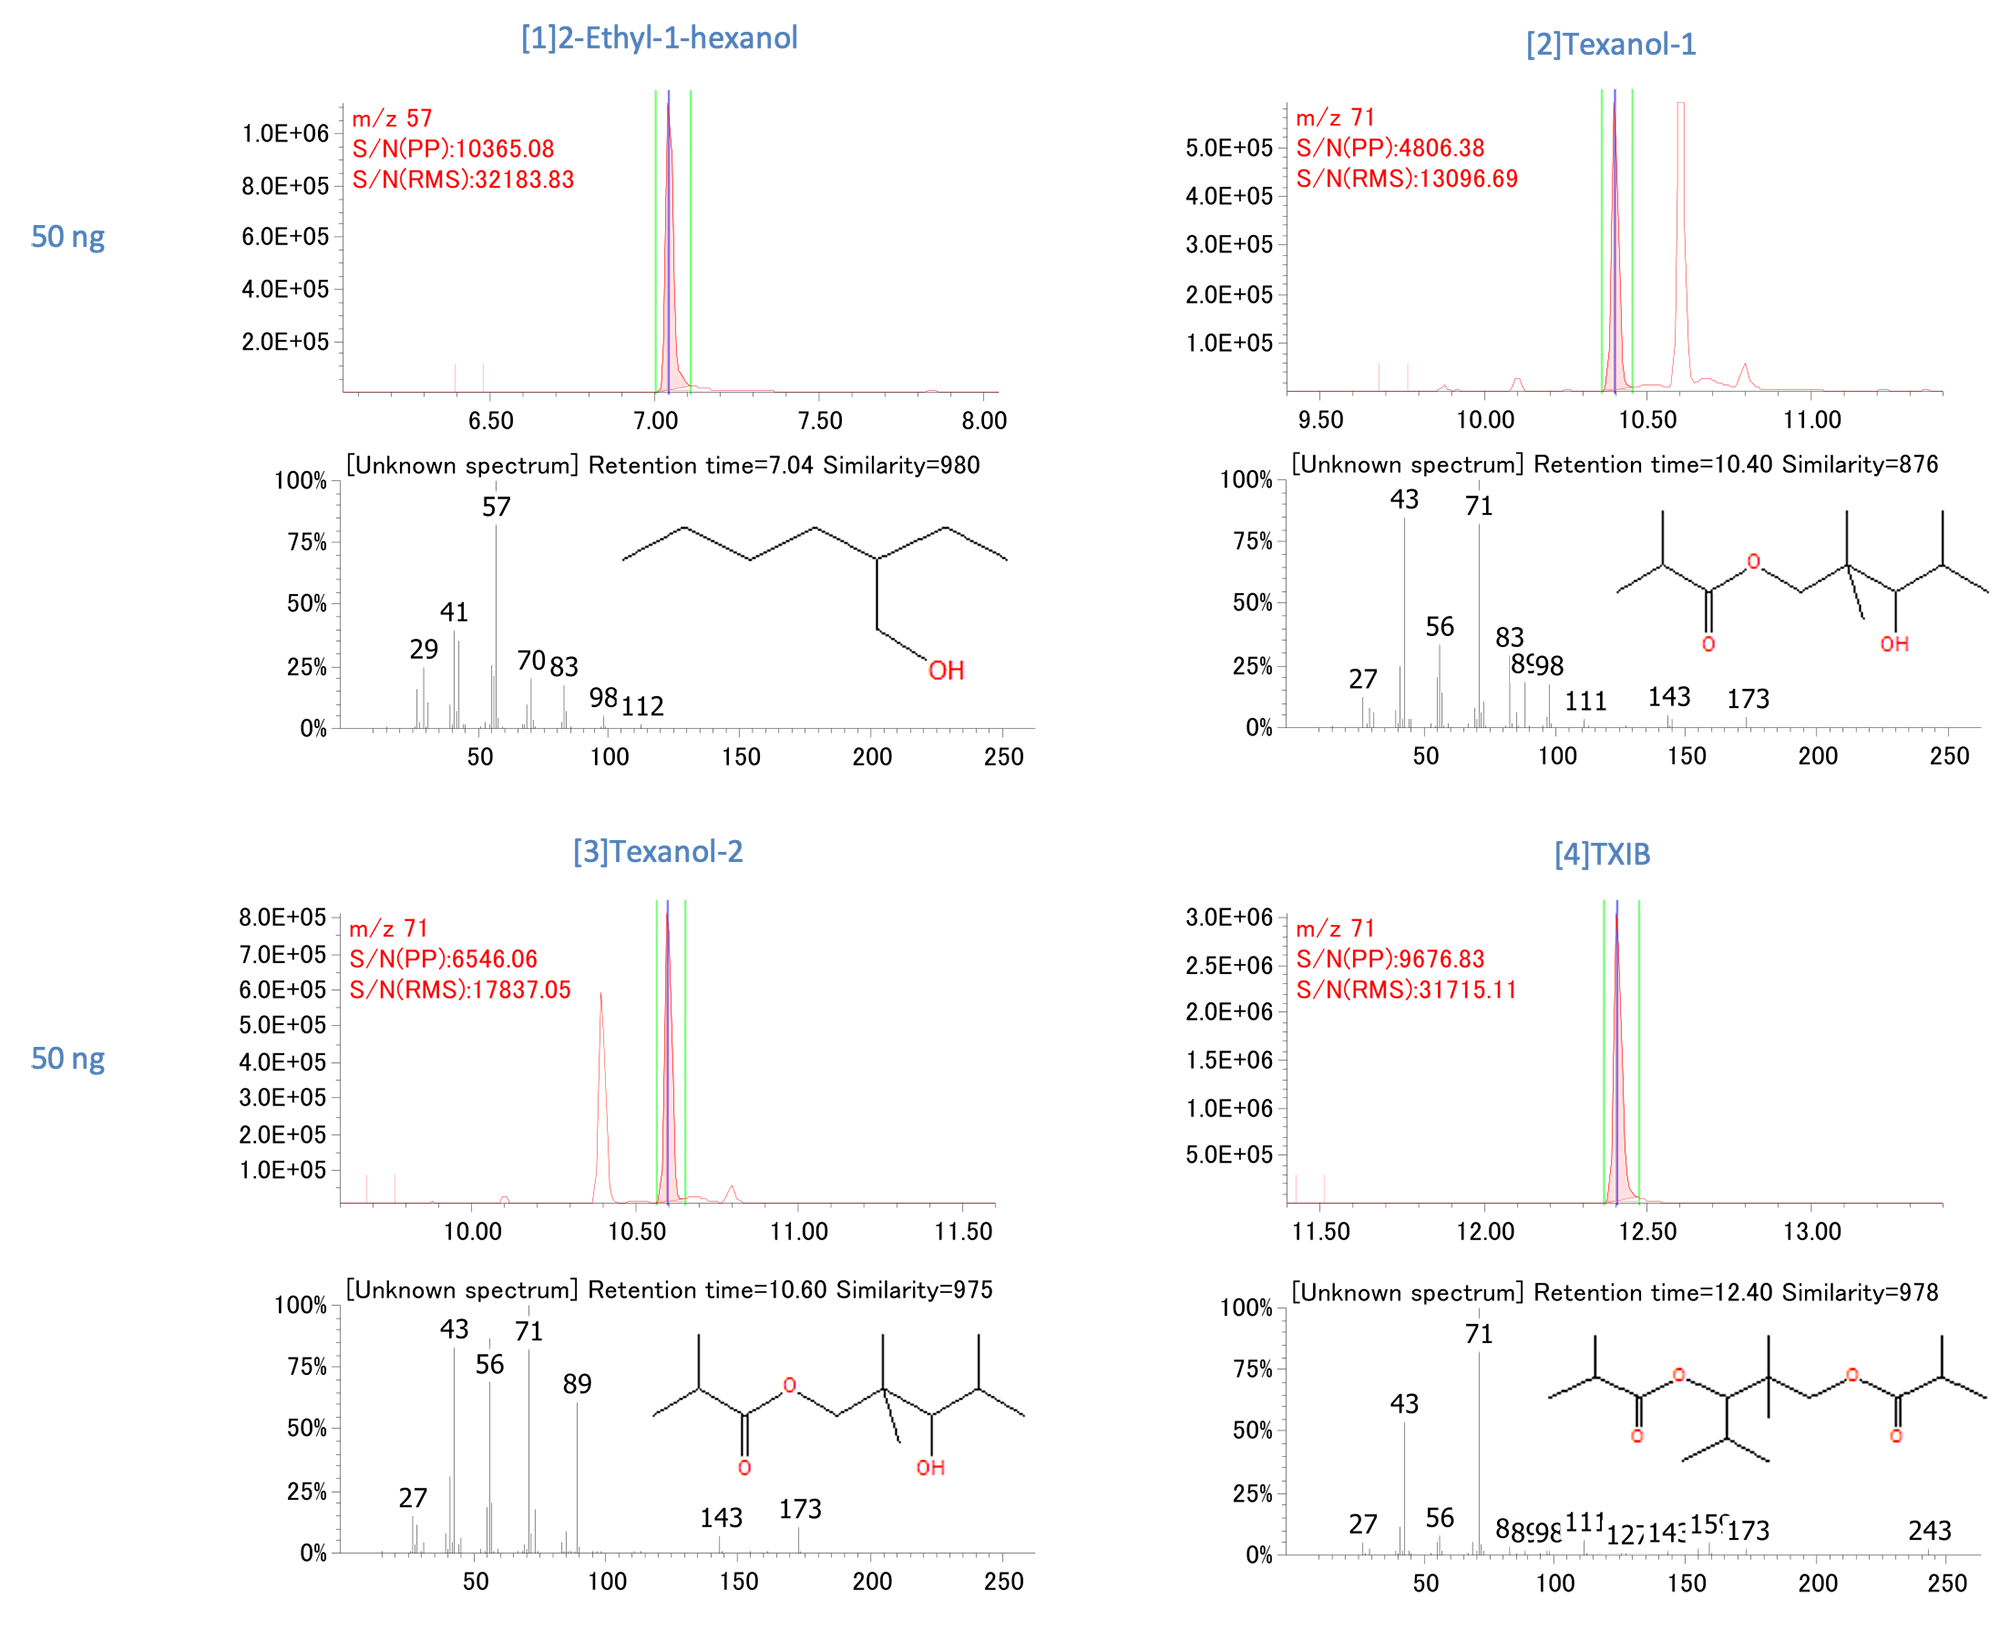
Figure 7 EICs and mass spectra
Conclusion
Using the TD-100xr and JMS-Q1600GC, it is possible to analyze the current 7 components and additional 3 components of VOCs inside a vehicle with high sensitivity and linearity. These devices are expected to be useful in analyzing gas samples such as atmospheric air and indoor air.
Solutions by field
Related information
Are you a medical professional or personnel engaged in medical care?
No
Please be reminded that these pages are not intended to provide the general public with information about the products.