Analysis of volatile organic compounds (VOCs) in water by HS-GC-MS Method
MSTips No. 429
Introduction
Several kinds of volatile organic compounds (VOCs), such as disinfectant byproducts and/or ground water contaminants are monitored by regulation in each country. Especially, VOCs contamination level in tap water are always monitored by governments, municipalities or water utilities. It is well known that the headspace(HS)-Gas Chromatograph(GC)-Mass Spectrometer(MS) is useful for the analysis of such VOCs, HS-GC-MS is employed as the standard analysis method for VOCs in water by the U.S. Environmental Protection Agency (US EPA) and by the Japanese Ministry of Health, Labour and Welfare. Since the rapid analysis method for 25 kinds of VOCs within 20 minutes could be achieved by using JMS-Q1600GC UltraQuad™ SQ-Zeta gas chromatograph-mass spectrometer combined with HT2850T GC autosampler from HTA, the detailed measurement condition and measurement results are reported in this study.
Experiment
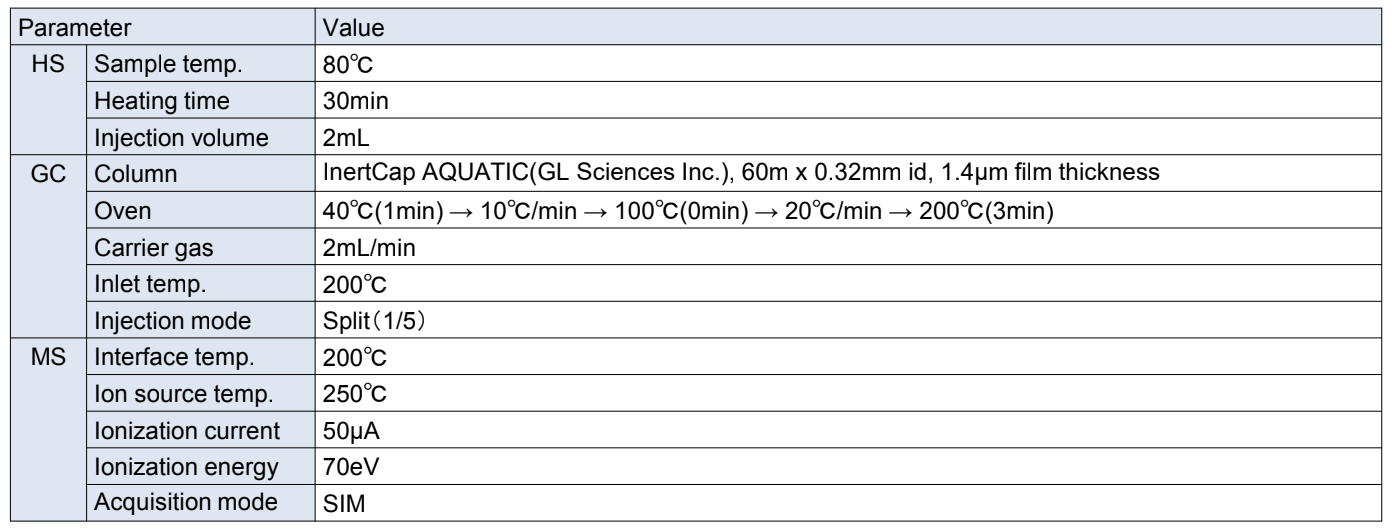
The concentration of the aqueous standard solutions for each compound, except for 1,4-dioxane were prepared at 0.1, 0.5 1.0, 5.0 and 10µg/L. The concentration of 1,4-dioxane in those standard solutions were adjusted at 5.0, 25, 50, 250, 500µg/L. Fluorobenzene and p-bromofluorobenzene were spiked to each aqueous standard solution at 2.5µg/L as internal standards. 1,4-dioxiane-d8 was also spiked at 10µg/L as internal standard dedicated for 1,4-dioxane. Total volume of each aqueous standard solution was adjusted to 10mL and 3g of sodium chloride were added as salt out reagents. Those aqueous standard solutions were measured under the measurement condition described in Table 1, and the calibration curves concerning 25 kinds of VOCs were created and were evaluated its linearity and sensitivity were evaluated. In addition, the lowest concentration solutions were measured five times and the coefficients of variation for each VOCs were calculated.
Table 1. Measurement condition
Results
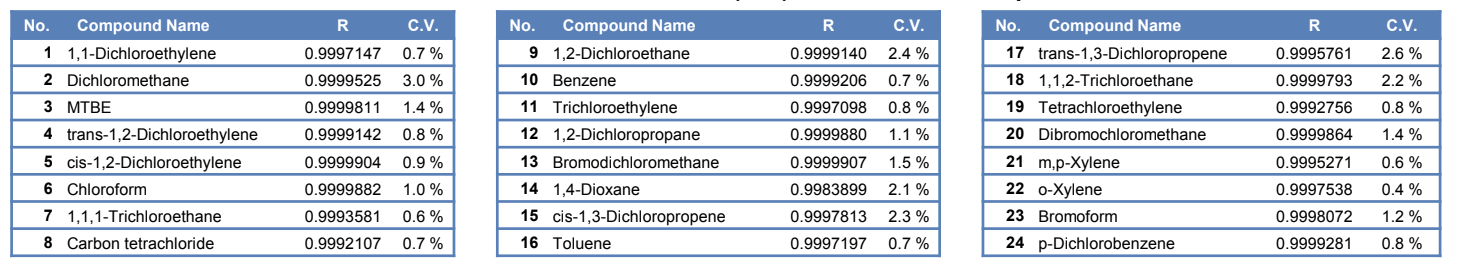
The calibration curves for each VOCs were shown in Figure 1 and the SIM chromatograms of the lowest concentration for each VOCs were shown in Figure 2. The correlation coefficients of each calibration curve and the coefficients of variation (C.V.) values for each VOCs were shown in Table 2. The correlation coefficients of the calibration curves were above 0.999 for all 25 VOCs, showing good linearity. The C.V. values at the lower concentration level were less than 10% for all 25 VOCs.
Conclusion
Rapid measurement method with HS-GC-MS was applied for the analysis of 25 VOCs including 1,4-dioxinane. The JMS-Q1600GC with HT2580T GC autosampler from HTA achieved measurements for all 25 VOCs within 20 minutes with good linearity of calibration curve and good sensitivity and reproducibility.
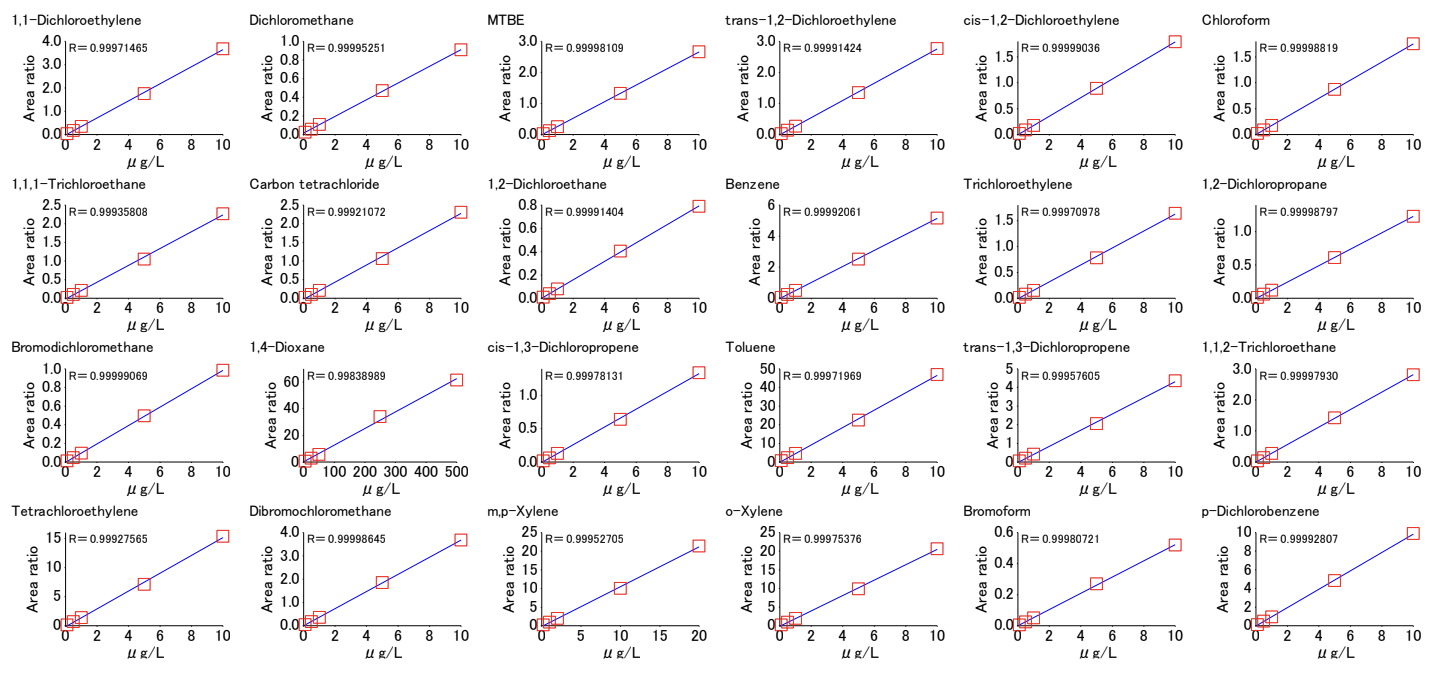
Figure 1. Calibration curves of each compound
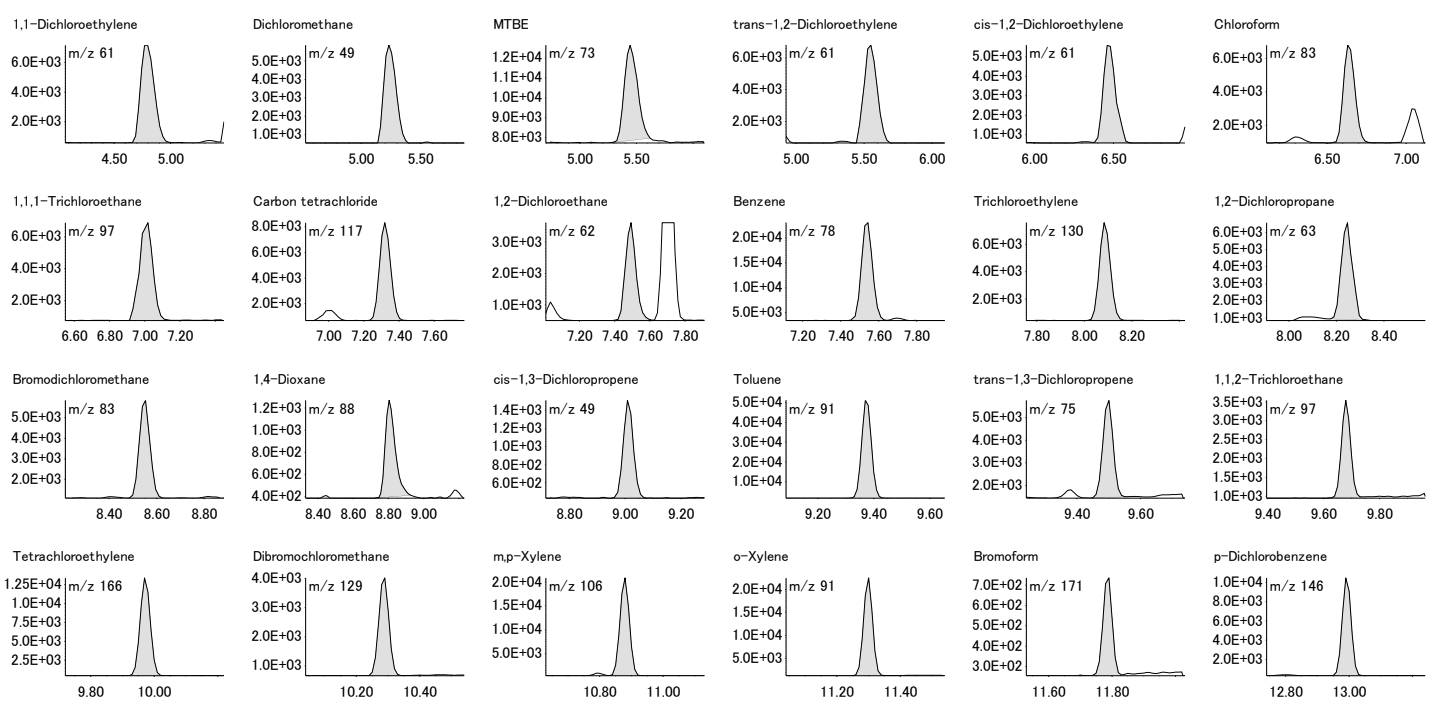
Figure 2. SIM chromatograms of each compound
Table 2. Correlation coefficient(→R) & C.V. of each compound
Solutions by field
Related products
Product category
Are you a medical professional or personnel engaged in medical care?
No
Please be reminded that these pages are not intended to provide the general public with information about the products.