Composition analysis of EO-PO copolymers using JMS-S3000 “SpiralTOF™-plus2.0” and “msRepeatFinder V6”
MSTips No. 399
Matrix-assisted laser desorption/ionization time-of-flight mass spectrometer (MALDI-TOFMS) is a powerful tool for polymer analysis. Since MALDI mainly produces singly charged ions, the m/z values in the mass spectrum is the masses of the polymer ions. By using high mass-resolution MALDI-TOFMS, it is possible to easily distinguish polymer series based on differences in repeating units and end group composition, and to calculate the molecular weight distribution of each series. Recently, the Kendrick Mass Defect (KMD) method has made it possible to easily visualize polymer series contained in complex high mass-resolution mass spectra. When the molecular weight of a sample is several thousand or more, it is known that electrospray ionization (ESI), a typical soft ionization method along with MALDI, tends to produce mainly multiply charged ions, making it difficult to directly analyze the mass spectrum, let alone perform KMD analysis. Therefore, the combination of the high mass-accuracy of the JMS-S3000 “SpiralTOF™-plus2.0” and KMD analysis is particularly effective for the analysis of copolymers. Here, we will report on the binary copolymer search function newly added to msRepeatFinder V6 and the resulting compositional analysis of EO-PO copolymers using the degree of polymerization plot.
Experiments
The samples used were commercially available EO-PO random copolymer (EO-ran-PO, Mn∼2500) and PO-EO-PO triblock copolymer (PO-EO-PO, Mn∼2700, EO 40%wt). DCTB was used as the matrix, and sodium trifluoroacetate (NaTFA) was used as the cationization agent. Mass spectra were acquired using SpiralTOF positive ion mode of JMS-S3000 “SpiralTOF™-plus2.0”. Each mass spectrum was deisotoped and used for KMD analysis.
Results
Figure 1 shows the mass spectra and KMD plots (base unit: PO) (c) of EO-ran-PO (a) and PO-EO-PO (b). The mass spectra show that both have a molecular weight distribution with an apex at slightly less than 3,000 Da. However, the mass spectra are extremely complex, and it is difficult to understand the differences in composition between the two. Therefore, the peak lists of both species after deisotoping were displayed in a KMD plot (Base unit: PO). In this plot, the PO distribution is spread horizontally along the horizontal axis, and the EO distribution is spread diagonally upward to the right. The KMD plots show that the distributions of EO and PO in the two samples were significantly different. In the EO-ran-PO sample, the distribution of EO was wider than that of PO, while in the PO-EO-PO sample, the distributions of EO and PO were similar.
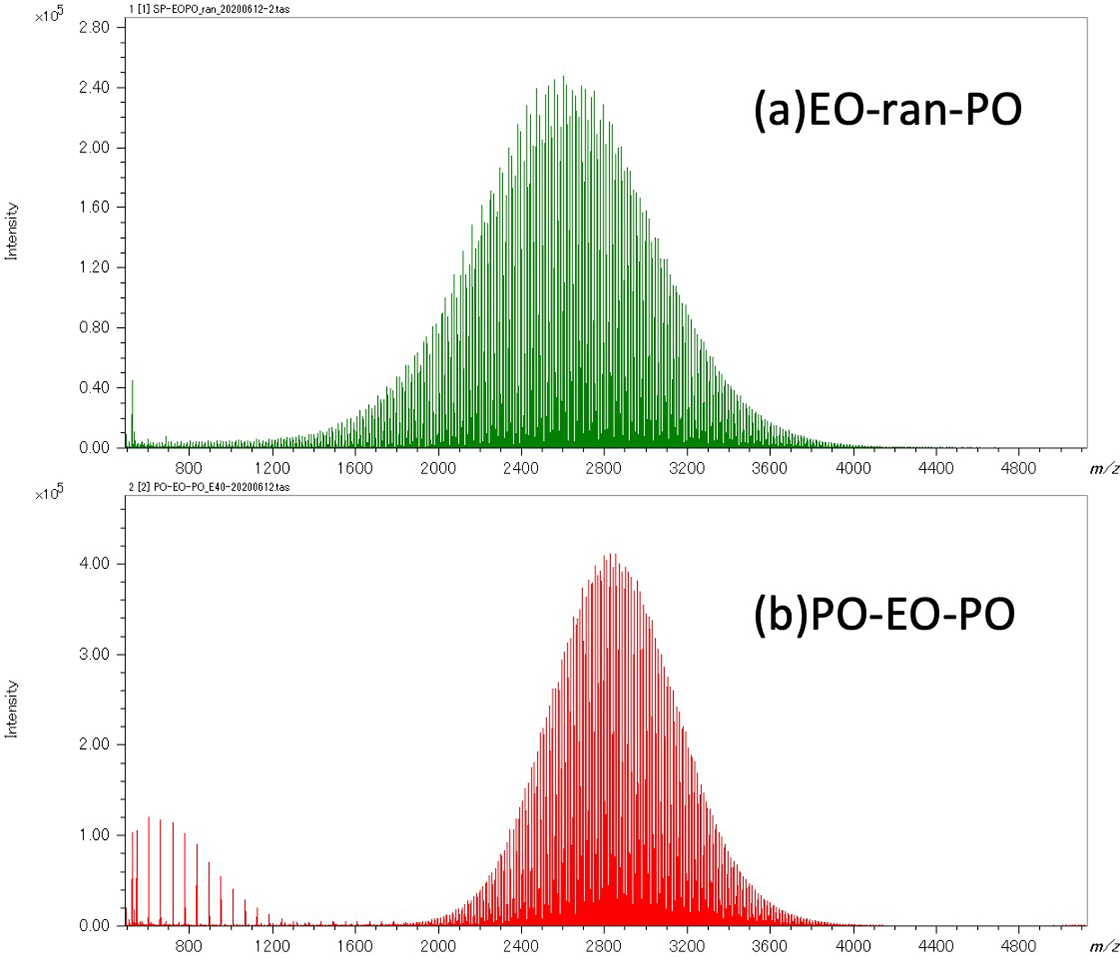
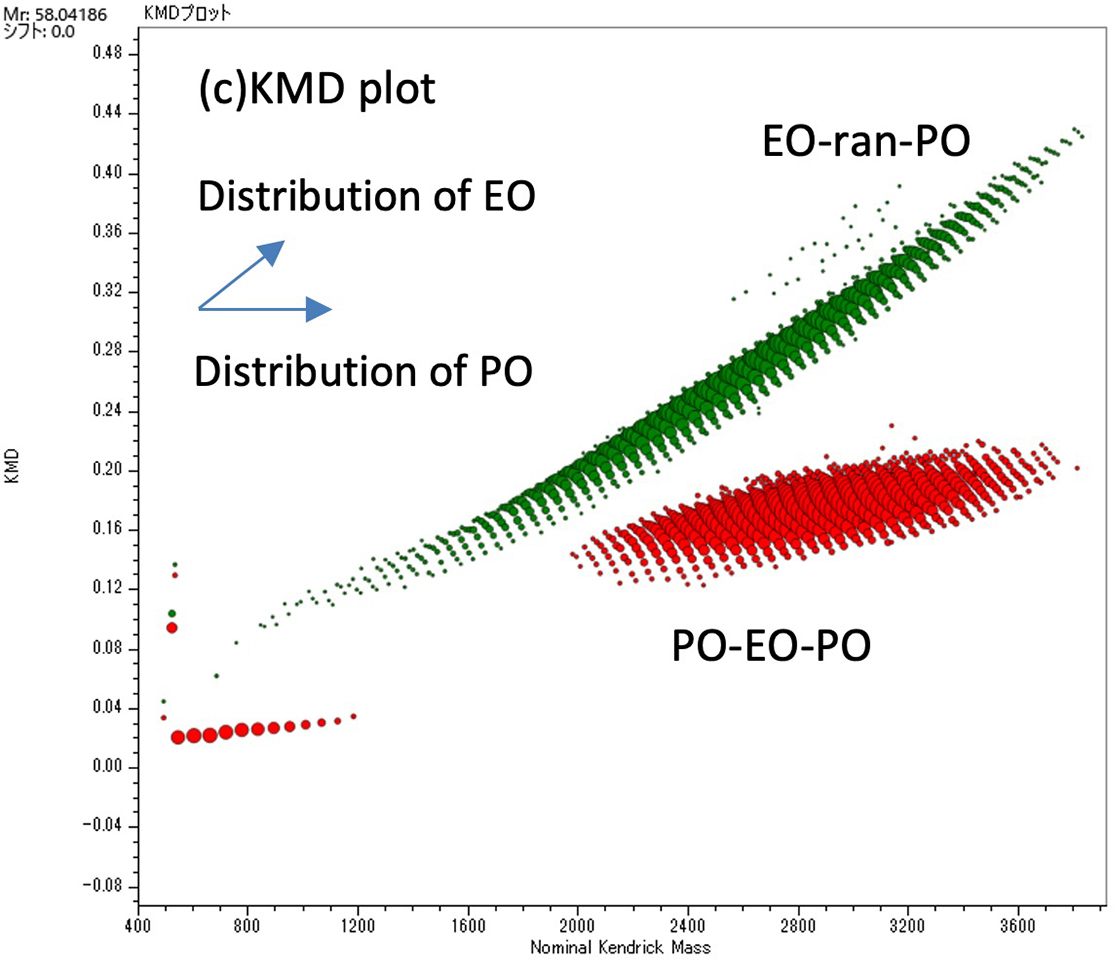
Figure 1 Mass spectra of EO-ran-PO(a), PO-EO-PO(b) and KMD plot of their deisotoped peak lists (c).
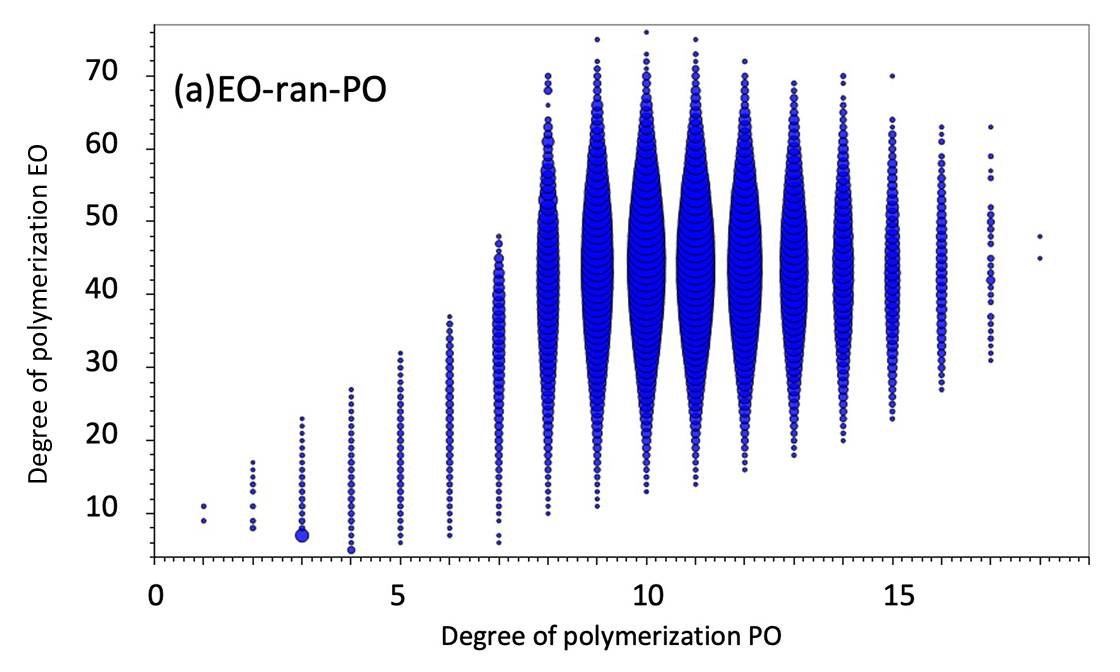
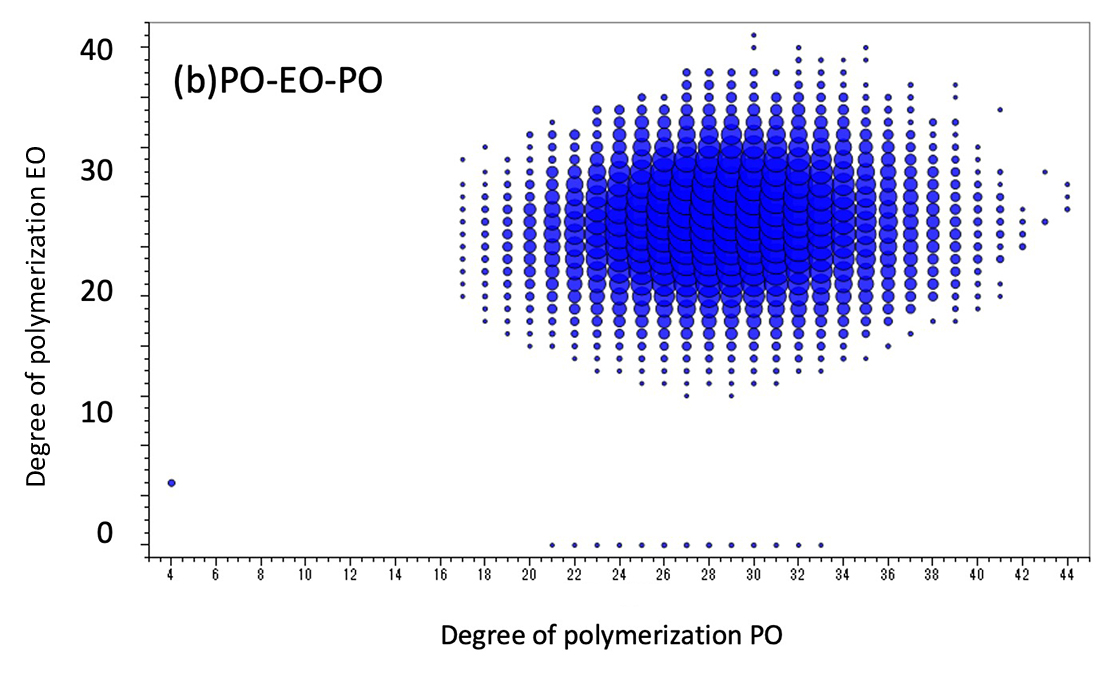
However, the KMD plot does not reveal the distribution of the degree of polymerization. Therefore, we used the new feature of msRepeatFinder V6, the binary copolymer search function. This function searches the peak list for binary copolymer peaks by specifying the composition of the two monomers, the composition of both end groups, and the adduct ions. Here, the search was carried out under the conditions shown in Table 1. One of the results is a degree of polymerization plot (Figure 2). The degree of polymerization plot is a combination of the degrees of polymerization of two monomers in a binary copolymer. Figure 2(a) and (b) show the degree of polymerization plots of EO-ran-PO and PO-EO-PO, respectively. The horizontal axis indicates the degree of polymerization of PO, the vertical axis indicates the degree of polymerization of EO, and the size of each plot indicates the ion intensity. The molar ratio and weight ratio of EO and PO are also calculated from the intensity distribution of the degree of polymerization plot. The weight ratio of EO in PO-EO-PO is stated as 40% in the brochure, which is in good agreement with the present results. Therefore, it is thought that the composition ratio of EO-ran-PO can also be estimated.
Table 1 Search condition for the two types of measured EO-PO copolymer
| Monomer1 | Monomer2 | End Group Alpha | End Group Omega | Adduct Ion | Charge |
|---|---|---|---|---|---|
| C3H6O | C2H4O | H | OH | Na | +1 |
| Mol. % | |
|---|---|
| EO | PO |
| 79.8 | 20.2 |
| wt % | |
| EO | PO |
| 75.0 | 25.0 |
| Mol. % | |
|---|---|
| EO | PO |
| 46.8 | 53.2 |
| wt % | |
| EO | PO |
| 40.1 | 59.9 |
Figure 2 DP plots of EO-ran-PO(a) and PO-EO-PO(b). The molar and weight ratios are also shown.
Conclusion
In this application note, mass spectra of two types of EO-PO copolymers obtained by high mass-resolution MALDI-TOFMS were analyzed using the newly added search function of msRepeatFinder V6. It was shown that by using a degree of polymerization plot, it is not only possible to clearly display the distribution of the two monomers in a copolymer, but also to calculate the molar ratio and weight ratio.
Solutions by field
Related products
Product category
Are you a medical professional or personnel engaged in medical care?
No
Please be reminded that these pages are not intended to provide the general public with information about the products.