Structural analysis of phospholipids in egg yolk using JMS-S3000 “SpiralTOF™” with TOF-TOF option
MSTips No.185
Phospholipids are one of the major components of egg yolk. In this study, we extracted phospholipids from the egg yolk and tried to analyze their structures with the TOF-TOF option of the JMS-S3000 SpiralTOF™.
Measurement conditions
First, the egg yolk was dissolved in a mixed solution of chloroform, methanol, and water in order to separate lipids from water-soluble components such as proteins. After centrifugation, the chloroform/methanol layer was taken out, diluted with methanol, mixed with the matrix solution at a ratio of 1:1, and spotted onto the target plate.
Measurement results and summary
Fig. 1 shows the mass spectra of positive ion mode and negative ion mode measured in SpiralTOF mode. Judging from the m/z values of the observed ions, it is thought that phosphatidylcholines (PCs) were mainly observed in the positive ion mode, and phosphatidylinositols (PIs) were mainly observed in the negative ion mode. To confirm this, we measured the product ion mass spectra in TOF-TOF mode. In MSTips No.186, we reported the product ion mass spectrum of [M+H]+ of a standard sample 1-palmitoyl-2-oleoyl-sn-glycero-3-phosphocholine (PC(16:0, 18:1)) with the total composition of PC(34:1) The [M+H]+ of PC(34:1), which seems to have the same composition as the standard sample, was observed on the mass spectrum of the egg yolk sample. We selected this ion as a precursor ion, measured the product ion mass spectrum, and examined the structural similarity by comparing the spectra (Fig.2). In the negative ion mode, PI (38:4) [M-H]- with strong intensity was selected as the precursor ion. The product ion mass spectrum was measured (Fig. 3). Looking at the spectrum in Fig. 2. However, there is a slight difference, the same result as that of the standard sample was obtained, and the selected precursor ion was confirmed to be derived from PC(16:0,18:1). Next, looking at the spectrum in Fig. 3, each peak can be assigned as shown in Fig. 4, which is presumed to be PI(18:0,20:4).
As described above, it is possible to perform a structural analysis of phospholipids by performing measurements using the TOF-TOF option.
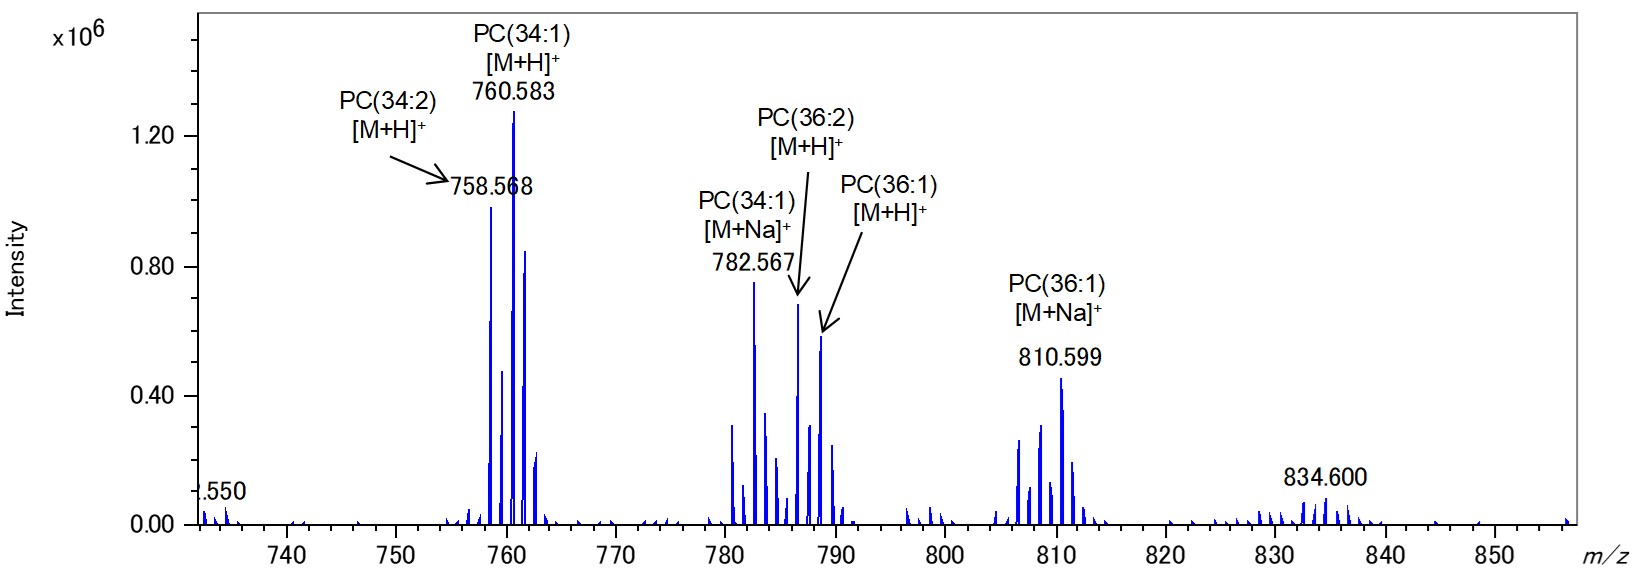
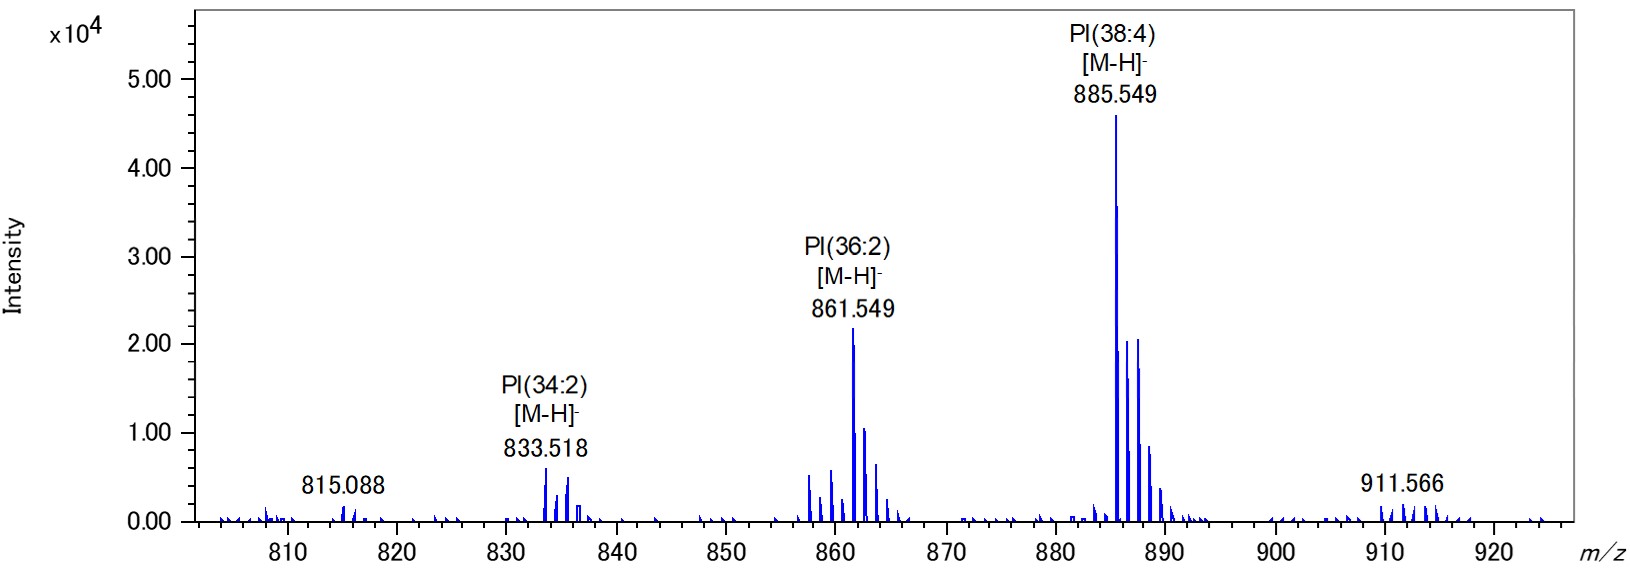
Fig.1 Mass spectra of phospholipids from egg yolk (top:positive ion mode, bottom negative ion mode).

Fig.2 Product ion spectrum of PC(34:1) [M+H]+
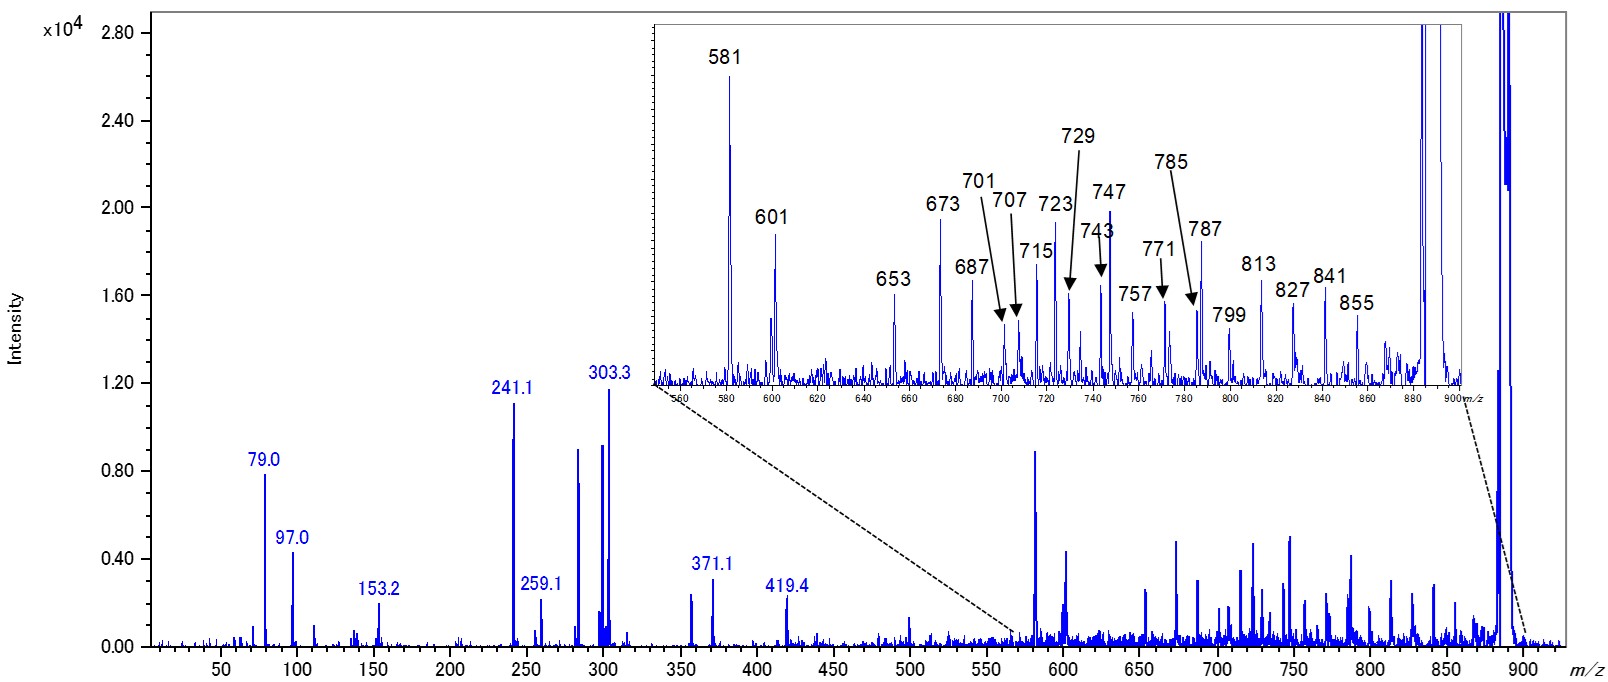
Fig.3 Product ion spectrum of PI(38:4) [M-H]-
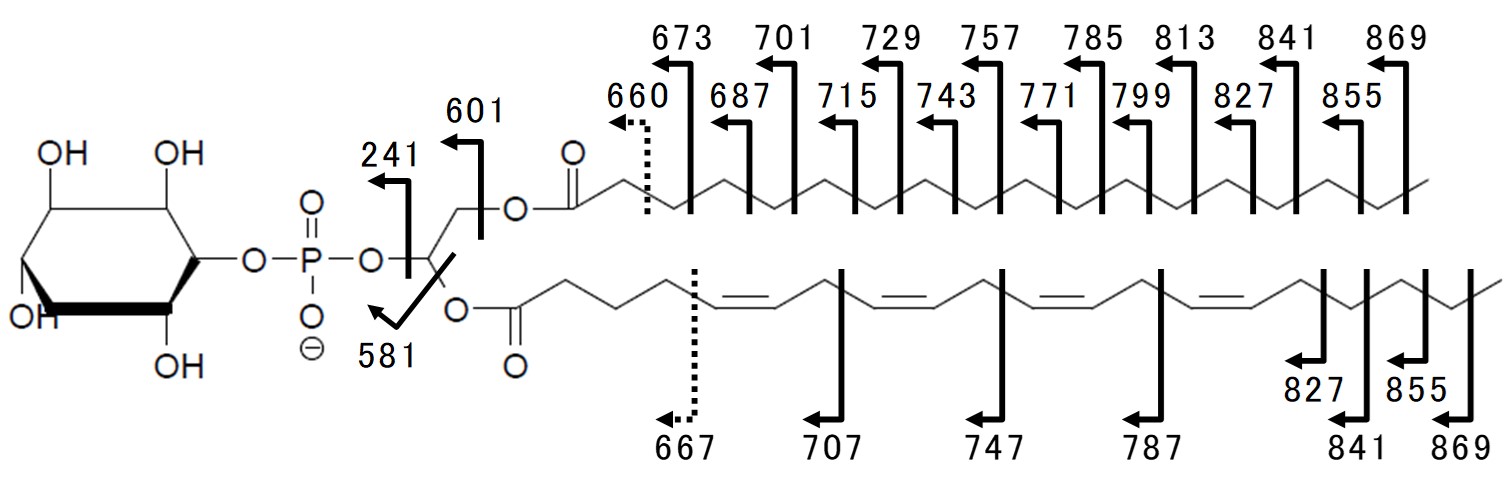
Fig.4 Peak assignment of product ion spectrum of PI(38:4) [M-H]-
Solutions by field
Related products
Are you a medical professional or personnel engaged in medical care?
No
Please be reminded that these pages are not intended to provide the general public with information about the products.