Qualitative Analysis of Calcium Oxalate Using TG-MS System
MSTips No.246
Overview
A thermogravimetry/differential thermal analysis (TG/DTA) system is used to measure weight changes and relative temperatures of samples under programmed heat conditions. A system combining TG/DTA with mass spectrometry (MS) is called a TG-MS system, and is considered one of the best qualitative and quantitative analysis systems for inorganic materials because it can measure sample conditions, evolved gas species, and gas volume simultaneously. In this application note, we introduce the basic application of analyzing calcium oxalate using the TG-MS “STA2500 Regulus” system (NETZSCH) and the GC/QMS “JMS-Q1500GC” system (JEOL).
Equipment and software
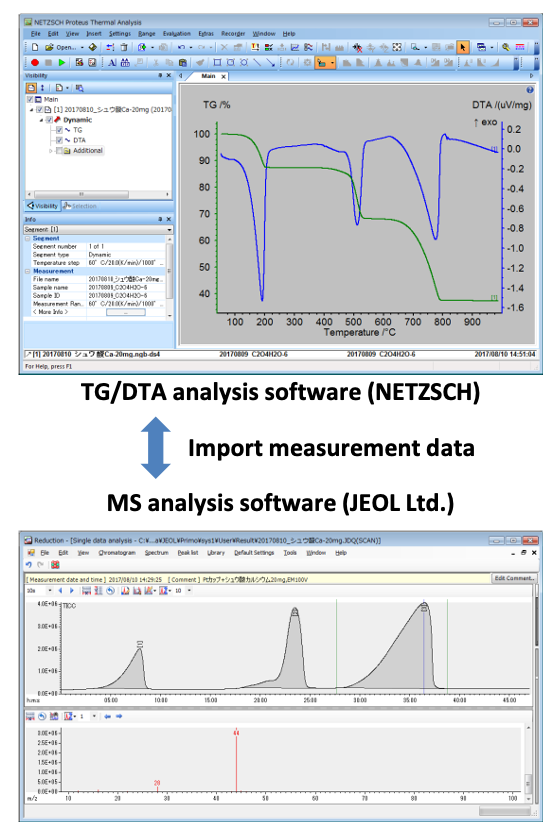
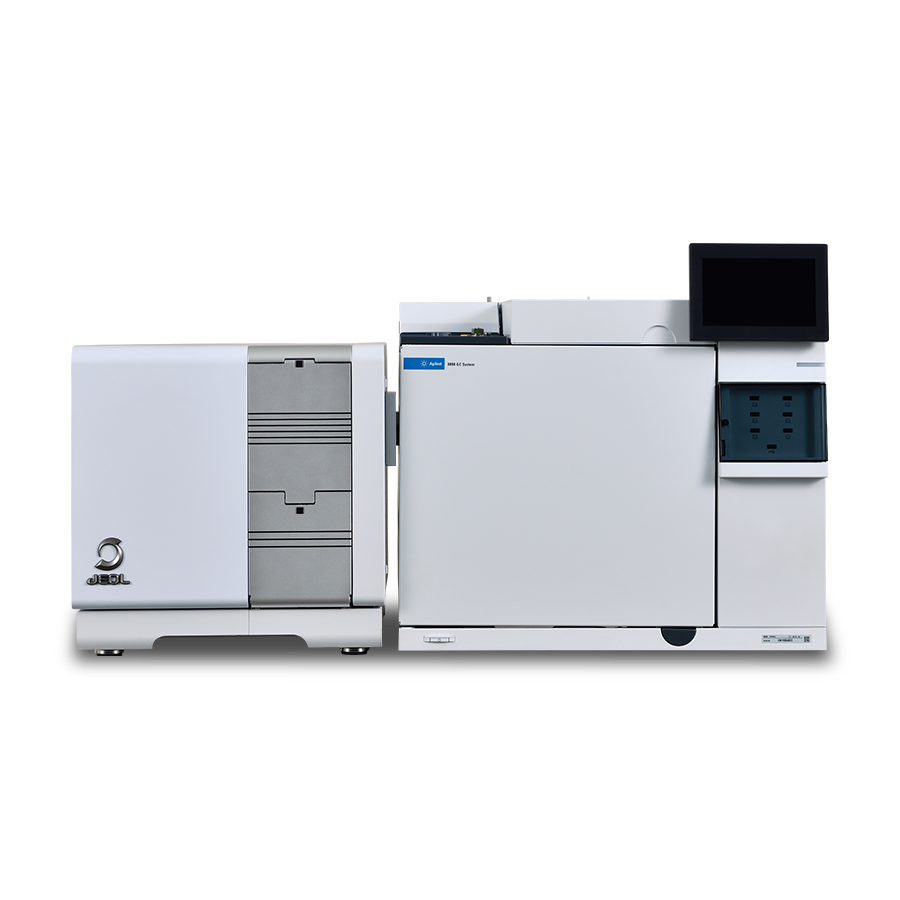
The TG/DTA and gas chromatography/MS (GC/MS) are connected by an inactivated fused-silica capillary tube in the TG transfer line, which is kept at a high temperature. The evolved gases from TG/DTA are introduced into the MS through this tube, which allows the system to measure both MS and TG signals simultaneously. Joint-analysis TG/DTA–GC/MS software can import TG/DTA and MS data, respectively. Consequently, it is possible to correlate weight change results with qualitative-analysis results for evolved gases.
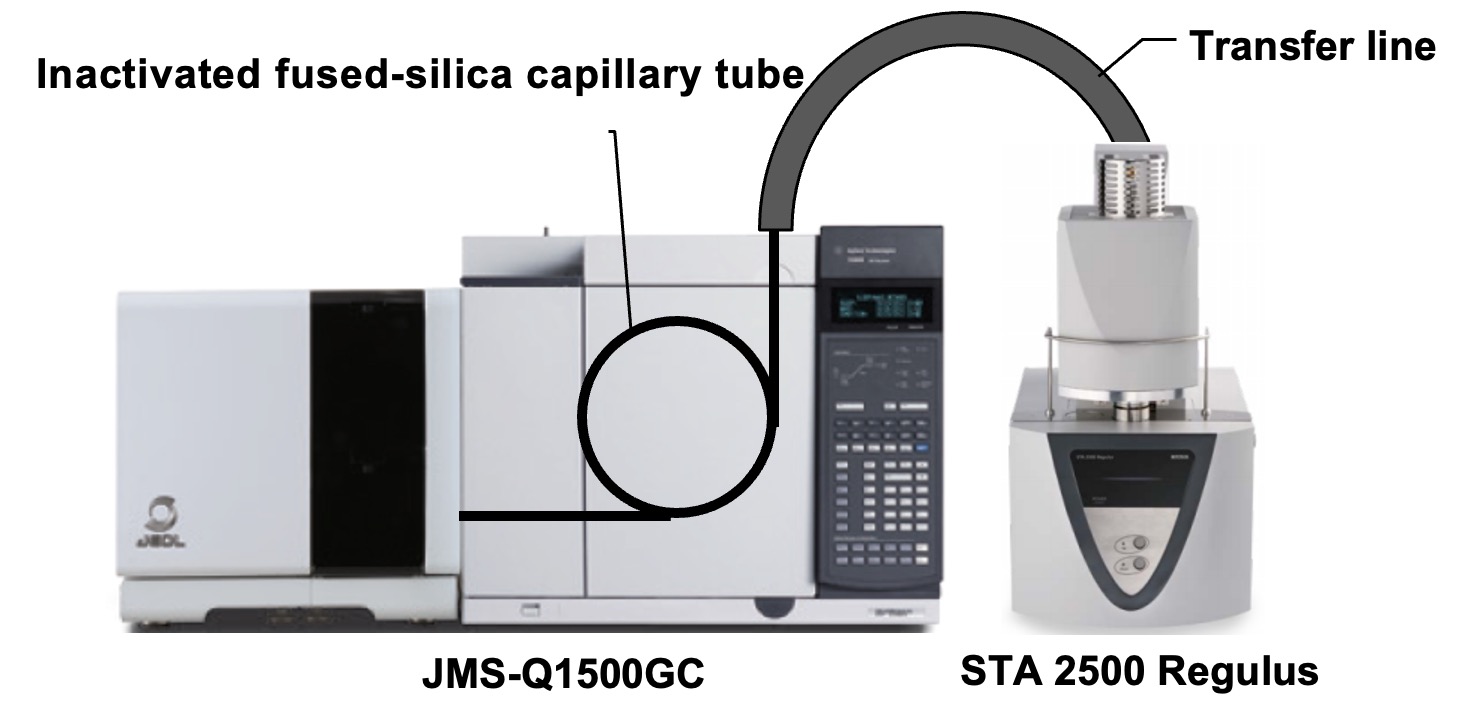
Figure 1. Device and PC software connections
Experiment
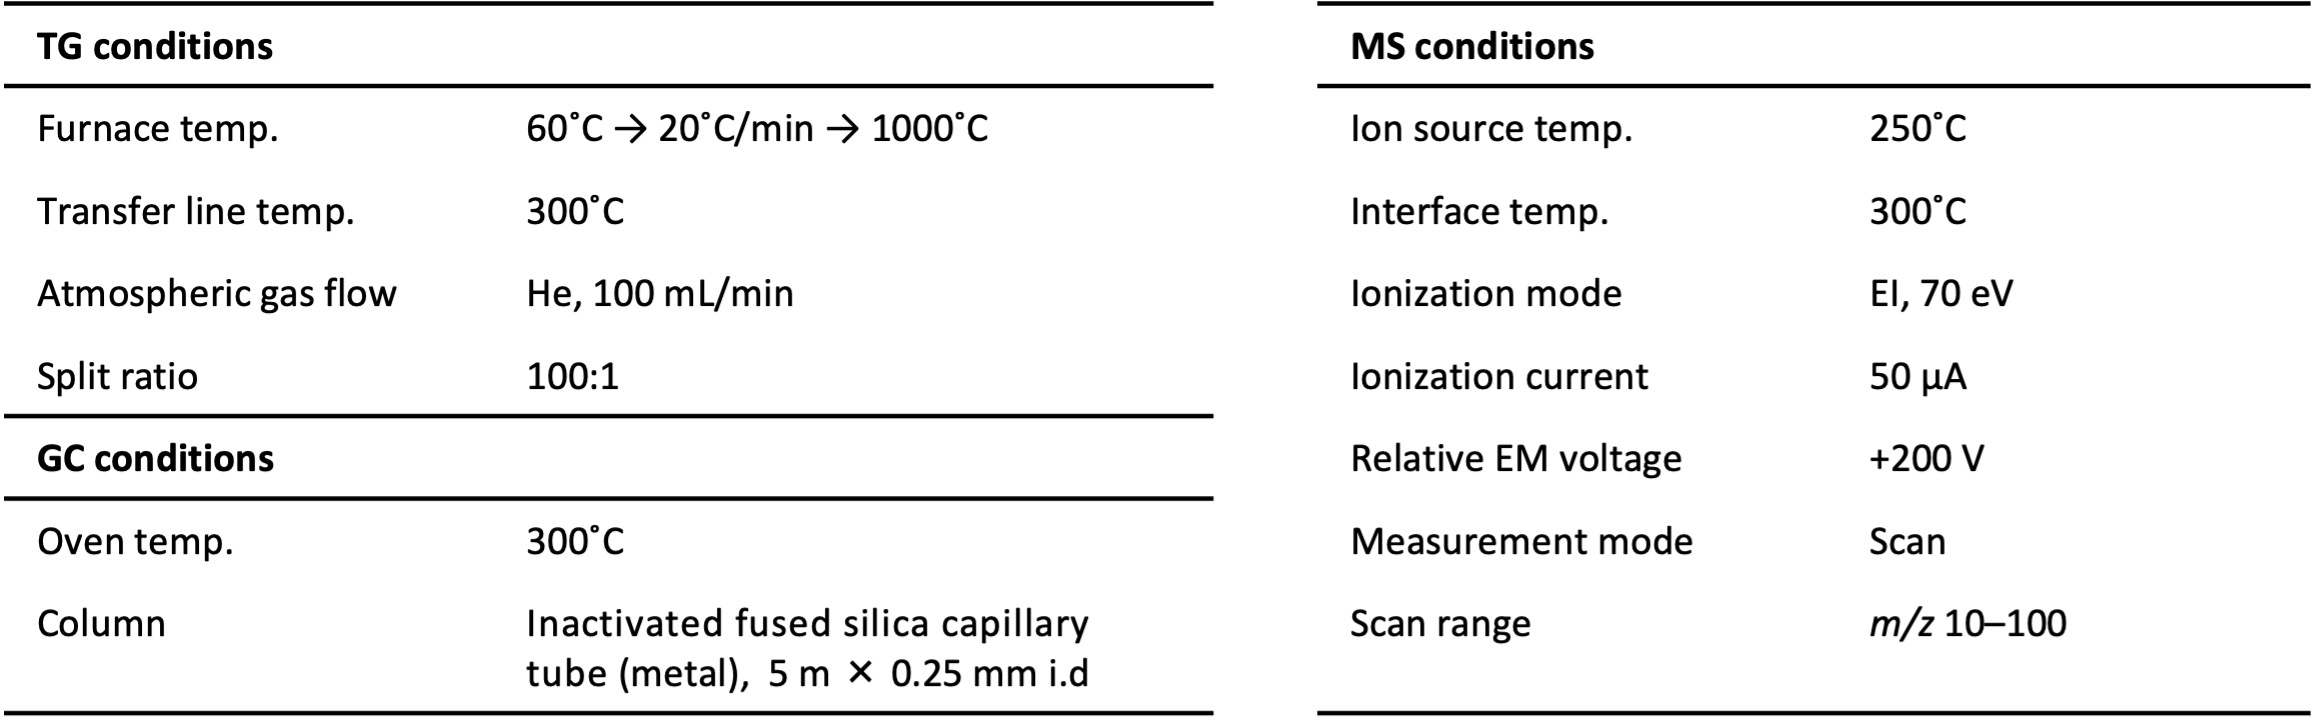
Calcium oxalate hydrate samples of 5 mg and 20 mg were weighed with an electronic balance. Table 1 shows the TG-MS measurement conditions.
Table 1. TG-MS measurement conditions.
Results
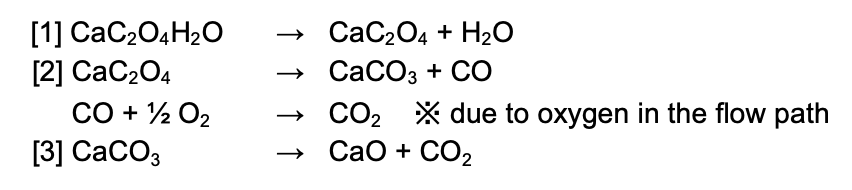
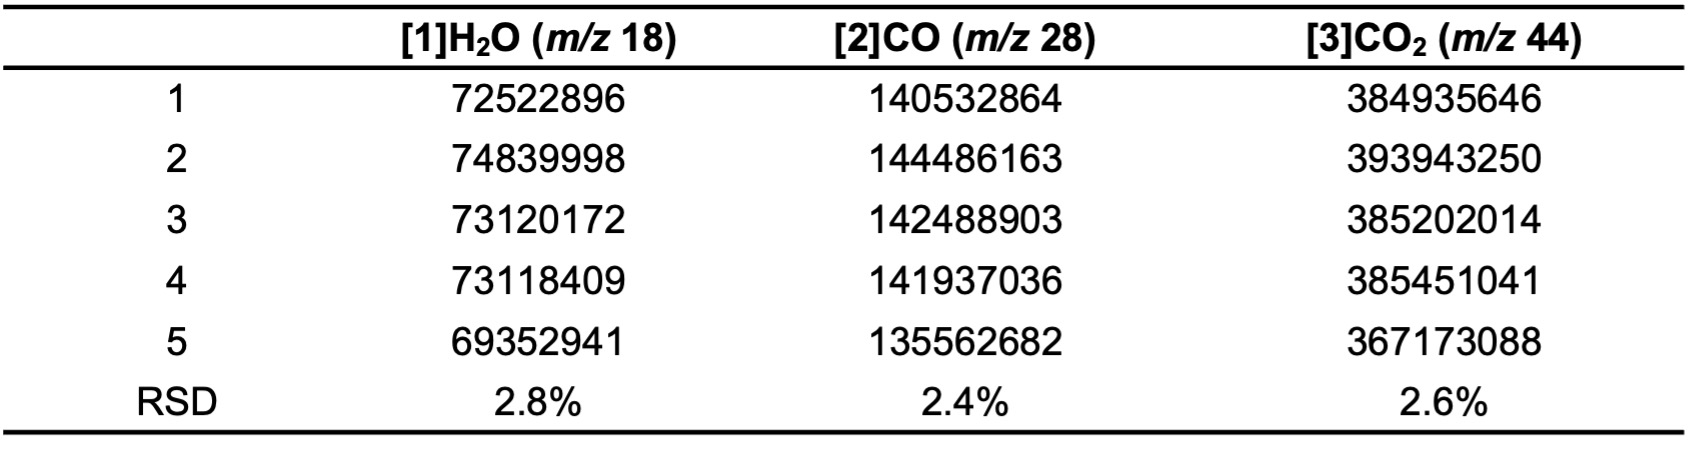
Figure 2 shows measurement results for the 20 mg sample. TG curve (= weight change), DTA curve, and total ion current chromatograms (TICCs) are respectively shown as green, blue, and red lines. On the TG/DTA curve, the weight loss from the endothermic reaction was detected at 190˚C, 500˚C, and 780˚C. The TICC shows three evolved gas peaks at the same temperature as the weight losses. Figure 3 shows the mass spectra of the TICC peaks [1]–[3] from Figure 2. Peaks [1], [2], and [3] were assigned as H2O, CO/CO2, and CO2, respectively, by NIST Library search.
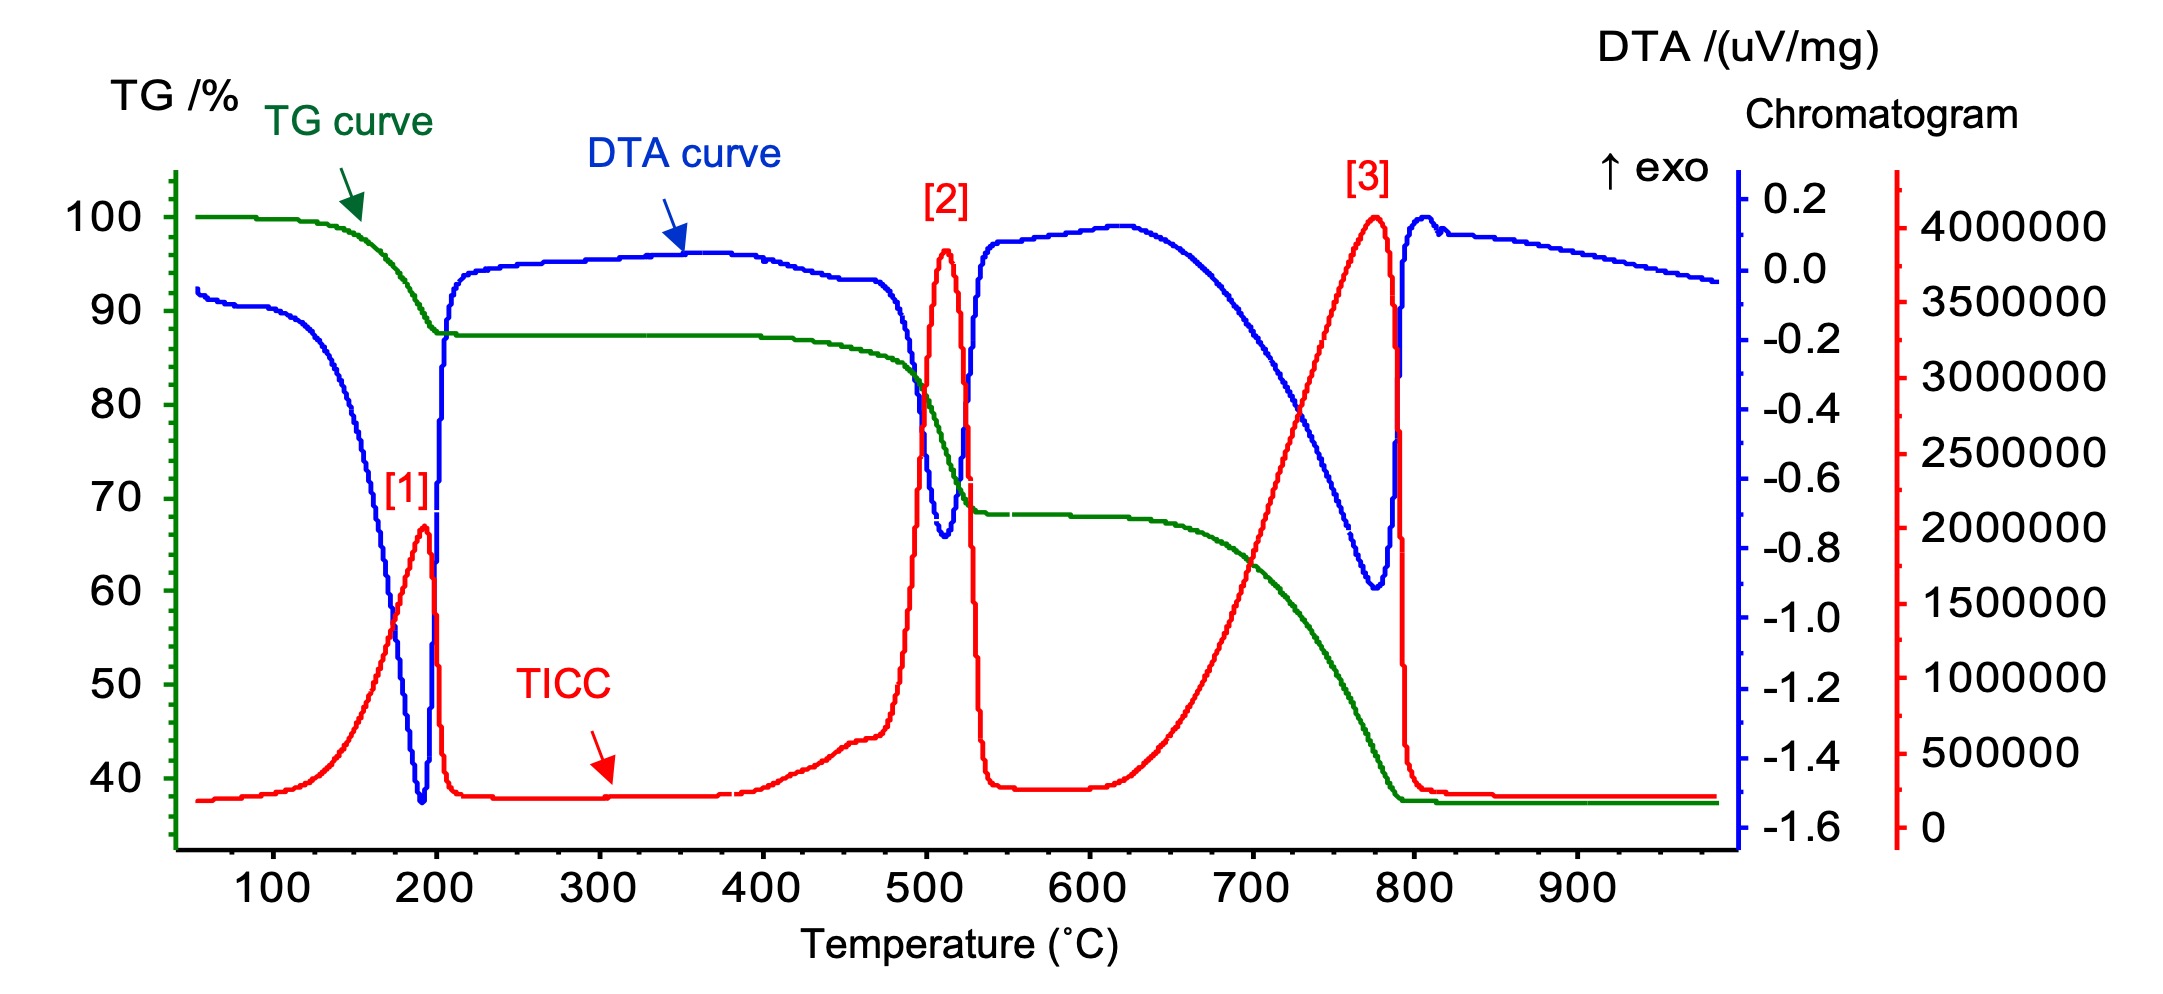
Figure 2. TG/DTA curves and TICC for calcium oxalate.
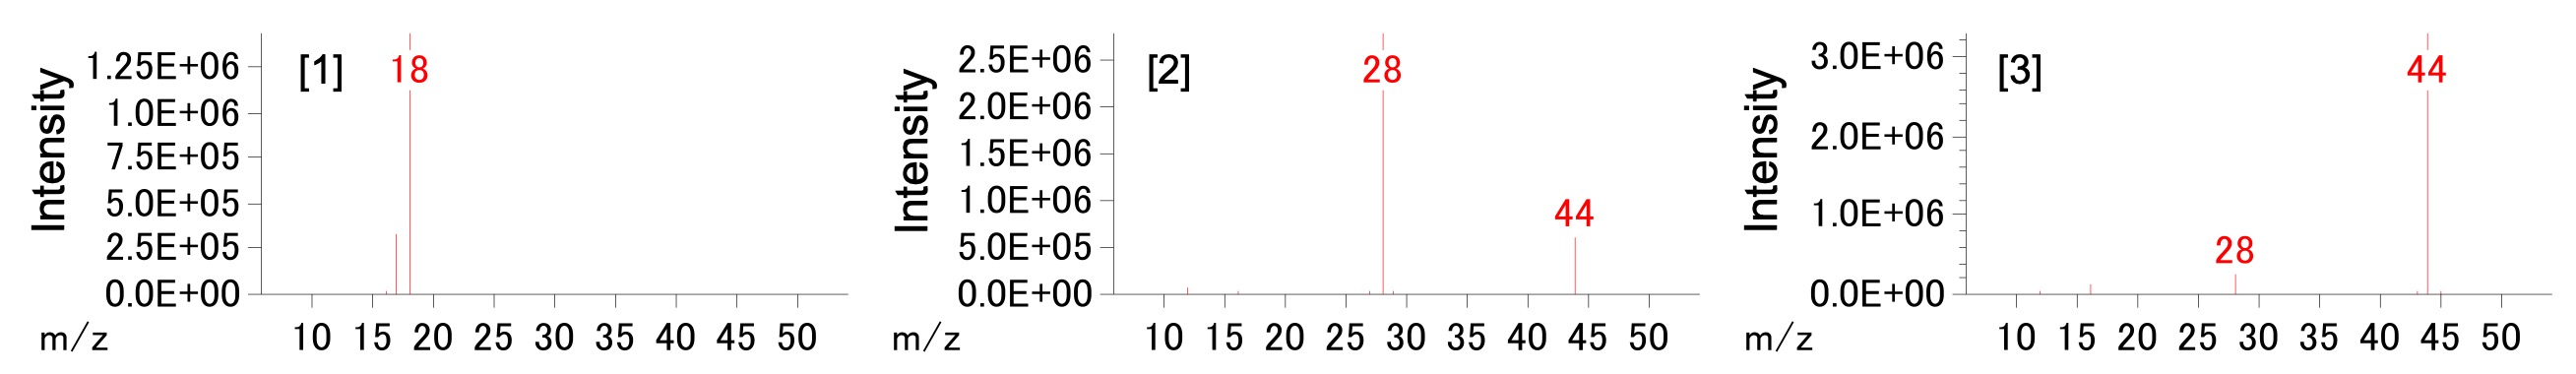
Figure 3. Mass spectra of TICC peaks.
The following chemical-reaction formula shows the thermal-decomposition process of calcium oxalate. The TG-MS measurement results suggest the following chemical reaction occurred:
Repeatability
Table 2 shows the extracted-ion chromatogram (EIC) peak area (per weight) of calcium oxalate 5 mg (n = 5) and its relative standard deviation (RSD). The RSD values of EIC peaks for the three evolved gases are within 3%.
Table 2. Area of EIC peak.
Solutions by field
Related products
Are you a medical professional or personnel engaged in medical care?
No
Please be reminded that these pages are not intended to provide the general public with information about the products.