Automatic classification of particles using particle analysis/detailed classification
~Automatic Classification Example of Asbestos~
MP2025-01
Introduction
Asbestos was once widely used as a building material. However, its harmful effects have become clear, and strict management is required now. For dismantling work of buildings containing asbestos, dust containing asbestos fibers may generate in the atmosphere. If the dust is aspired, the dust will stay in the lungs for a long time, which may cause serious diseases such as mesothelioma, lung cancer, and asbestosis.
Therefore, it is necessary to perform an analysis of the atmosphere to check if there is asbestos release or not for dismantling works. For an analysis of the atmosphere, use of the scanning electron microscope (SEM) is inevitable. Recently, automatic analysis using particle analysis has draw attention in the analysis of the atmosphere by SEM, as an efficient method to analyze/classify many particles (fibers). However, since various particles are present in the atmosphere, it is difficult to automatically classify asbestos from the results of analysis. Therefore, we reviewed the setting value of the chemical type for improving the accuracy of automatic analysis.
Automatic analysis/automatic classification using Particle Analysis Software (PA3)
JEOL's Particle Analysis Software (PA3) can be used to automatically extract fibrous materials and automatically classify asbestos.
Elemental analysis is performed by automatic image-shooting of a setting range (1000 times, 300 field of views) and automatic extraction of particle (fiber) in the images based on the setting value of length/width/aspect ratio, etc. (Fig. 1)
Automatic classification is divided into two: simplified classification/detailed classification by designating characteristic shape and mass % of element of particle (fiber) and QBase by classifying spectrum matching. It is difficult to classify a sample in the atmosphere using QBase where various particles are present because of the complicated spectrum shape. In general, chemical type simplified classification is used.
Automatic analysis with the PA3 are utilized for screening analysis of the analysis of the atmosphere, as not many manual operation is needed during measurement, although the measurement accuracy is worse than when done manually by an operator .
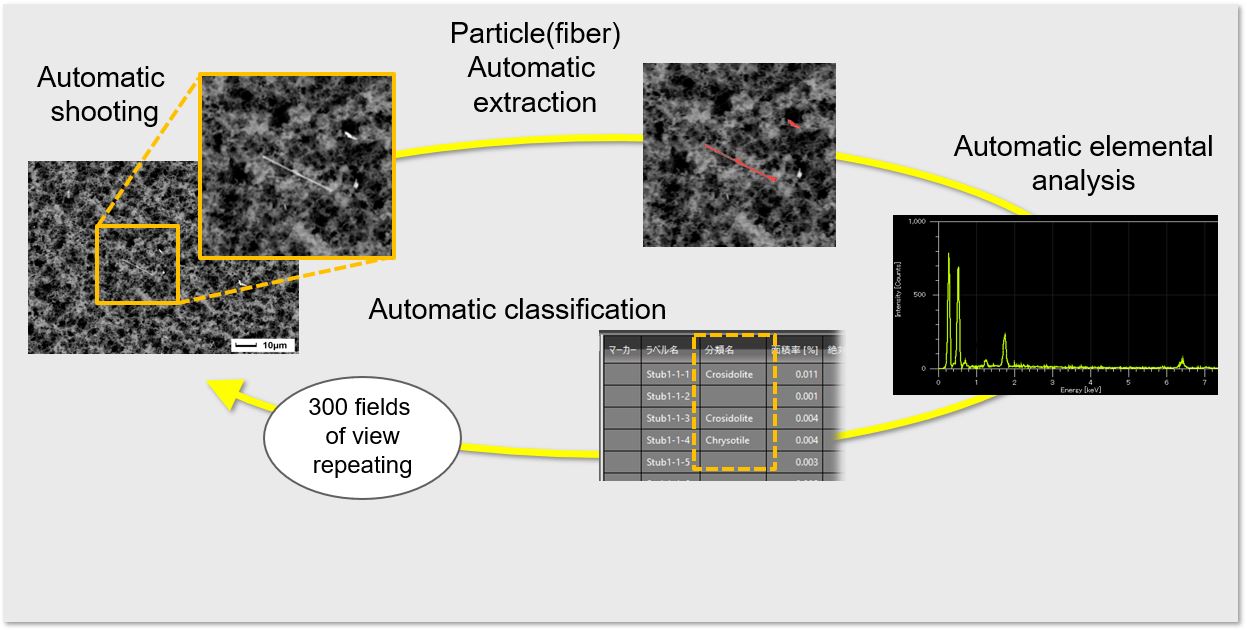
(Fig. 1) Automatic Analysis using PA3
Particle analysis and simplified classification of chemical types
【Experiment】
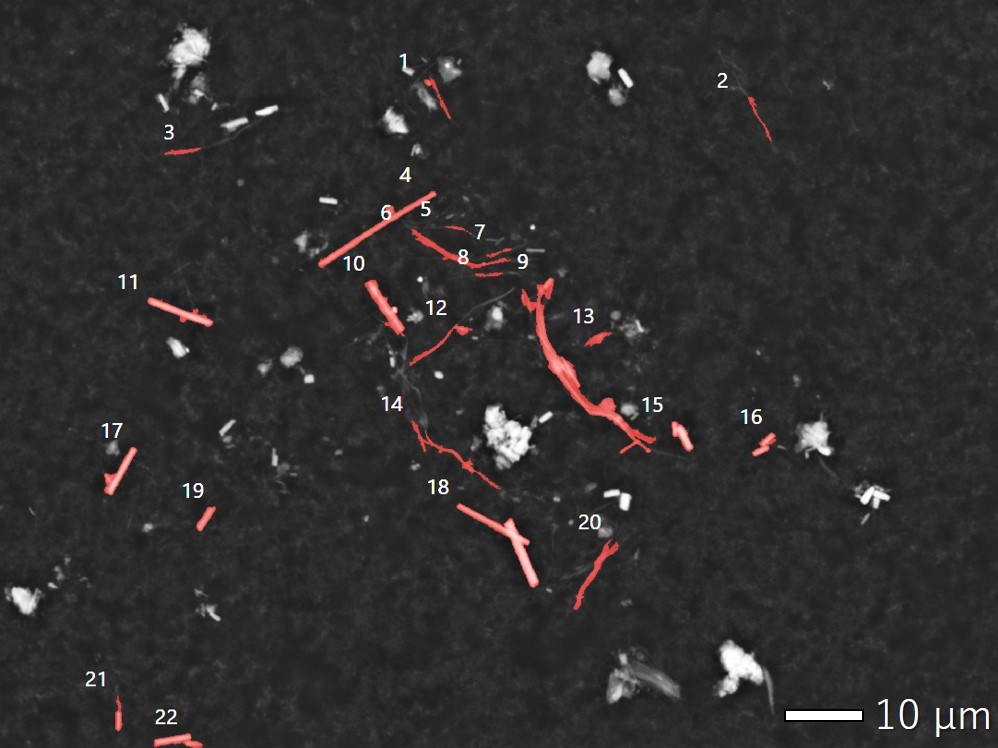
(Fig. 2) Particle Extraction Result
We prepared a test sample of two types of asbestos mixed (chrysotile/Chr:Mg3Si2O5(OH)4, anthophyllite/Ant:Mg7Si8O22(OH)2 ) and extracted fibers based on the lengths and aspect ratio(Fig. 2).
Automatic classification using PA3 was attempted by designating mass % of element for chemical type according to Table 1.
We examined two setting values: setting value 1 which was set by assuming an ideal sample based on the quantitative value of the standard sample, and setting value 2 which was set by assuming actual sample to avoid lack of counting for the sample in the atmosphere where various particles are present. For quantitative analysis, we specified the C and O as non-quantitative element to reduce the influence of background (carbon tape, etc.).
【Results and Consideration】
The setting value 1 which assumes an ideal sample, made it possible to classify Ant and Chr. However, the setting value 2 which assumes an actual sample, allowed in determining all of the asbestos as the asbestos. However, all of the Ant was judged as Chr. This indicates a disadvantage of the chemical type: when there are similar composition particles (fibers) present, it can be impacted by the classification results (Chr this time) which have a higher priority in classification conditions. In an ideal setting value, a good result can be obtained, while with the actual sample, lack of counting may occur for asbestos fibers that are close to sand particles. Therefore, in the actual measurement, more precise classification results are obtained with the setting value 2 which has some flexibility.
(Table 1) Chemical Type Simplified Classification
Setting Value
| Setting Value 1 | Setting Value 2 | |
|---|---|---|
| Chr | Mg:35% or more Si:45% or more Fe:2% or more |
Mg:25% or more Si:35% or more Fe:1%or more |
| Ant | Mg:30%or more Si:50% or more Fe:5% or more |
Mg:20% or more Si:30% or more Fe:2%or more |
(Table 2) Chemical Type Simplified Classification Result
(number of fibers)
| Manual Analysis Results | Setting Value 1 (Accuracy rate 100%) |
Setting Value 2 (Accuracy rate 45.5%) |
|
|---|---|---|---|
| Chr | 12 | 12 | 22 |
| Ant | 10 | 10 | 0 |
Setting of detailed classification of chemical types and automatic classification of asbestos
【Experiment】
We performed detailed classification by adding mass percentage ratio of an element to the setting value 2 which assumes an actual sample used in a chemical type simplified classification (Table 3). The ratio of Mg and Si in chrysotile is about 1:1 in mass percentage. But the actual measurement result has a wider ratio due to the surrounding sand particles. Therefore, we have set the Mg/Si range as 0.6 or more, and less than 1.0. And anthophyllite has the ratio of Mg/Si as 1:2 in mass percentage, so we have set the Mg/Si range as 0.2 or more and less than 0.6.
【Results and Consideration】
Even with the setting value 2 which assumes an actual sample, Chr and Ant were classified without mixing them (Table 4). The ratio of mass percentage of the element that was added to the setting, was effective in precisely classifying particles of similar composition. Detailed settings can expect improvement of accuracy for the automatic classification of asbestos by using PA3.
(Table 3) Chemical Type Detailed Classification Setting Value
| Chr | Mg:25% or more Si:35% or more Fe:1% or more Mg/Si≧0.6 Mg/Si<1.0 |
|---|---|
| Ant | Mg:20% or more Si:30% or more Fe:2% or more Mg/Si≧0.2 Mg/Si<0.6 |
(Table 4) Chemical Type Detailed Classification Results (number of fibers)
| Manual Analysis Results | Detailed Classification Results (Accuracy rate 100%) |
|
|---|---|---|
| Chr | 12 | 12 |
| Ant | 10 | 10 |
Conclusion
Particle analysis software is convenient for extracting fibers from 300 images and performing elemental analysis automatically. In addition, the use of a detailed classification of chemical type can improve the classification accuracy of asbestos while reducing the risk of counting loss. It will need a final confirmation by human eyes, but the particle analysis that is capable of automatic analysis can reduce the operator's burden for sure in the increasing analysis work for the atmosphere. This time, we examined chemical type for automatic classification of asbestos in the atmosphere. In the atmosphere, various particles are present together. Since particles (fibers) are relatively scattered, it was easy to perform particle analysis and classification, leading to a good result.
In the future, we would like to consider applications for asbestos in building materials that are greatly impacted by the sample preparation method and by mixed materials, as well as the cleanliness test for vehicles and contaminant analysis in the production line.
Solutions by field
Related products
Are you a medical professional or personnel engaged in medical care?
No
Please be reminded that these pages are not intended to provide the general public with information about the products.